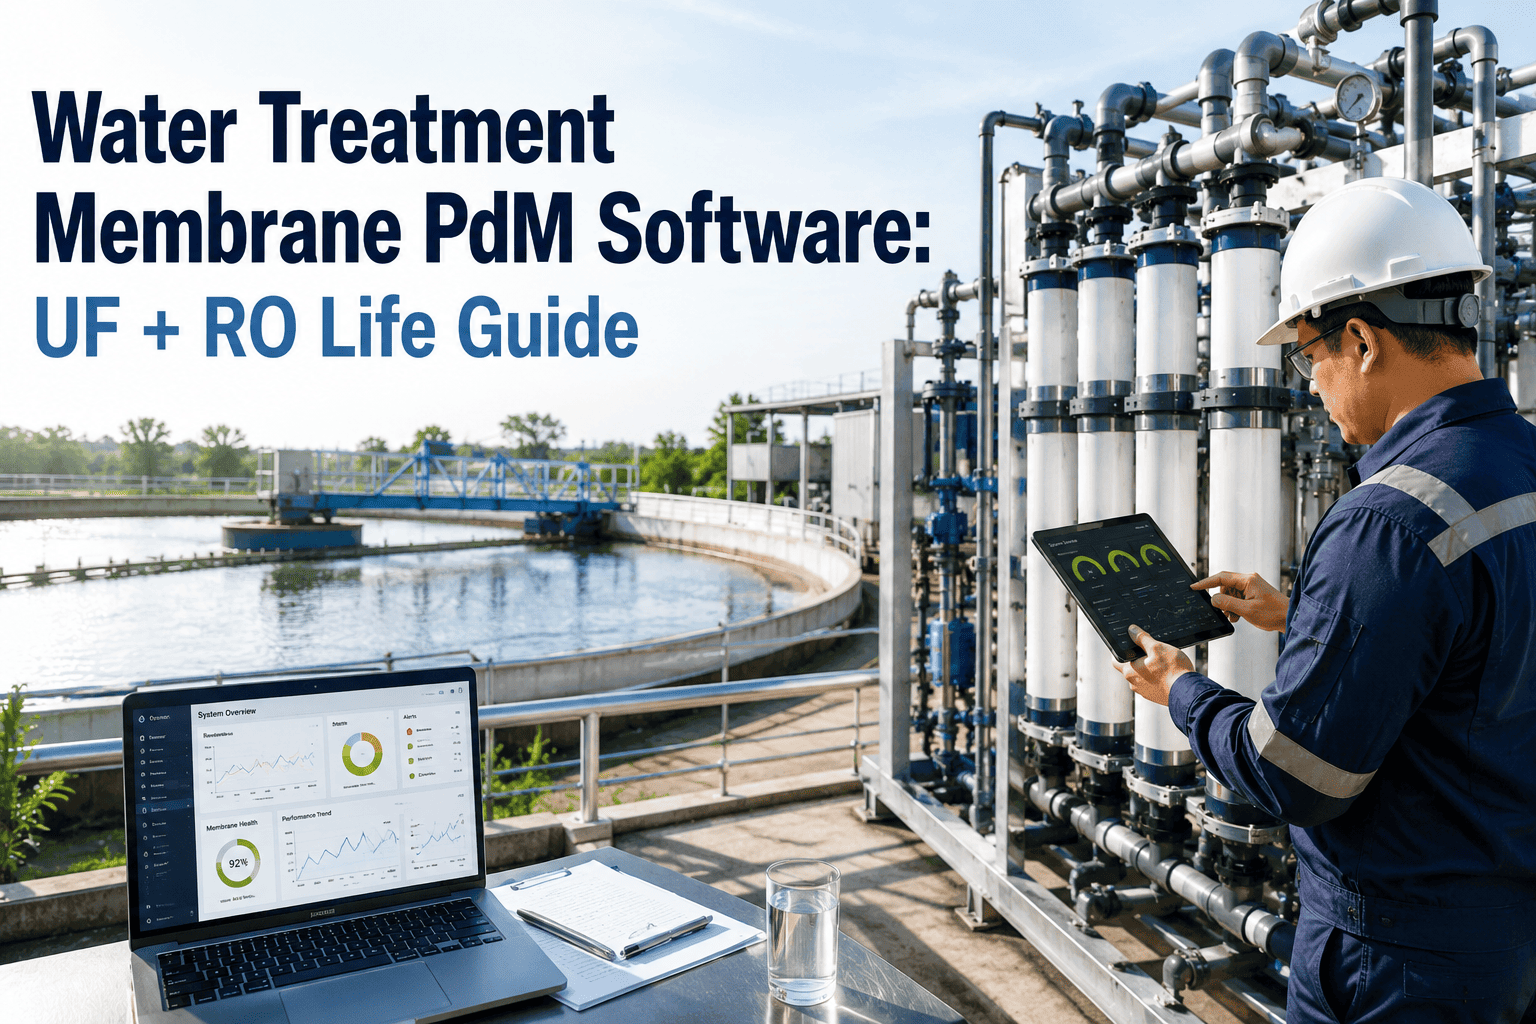
Somewhere between the intake screens and the clearwell, a UF or RO membrane is quietly deciding your plant's entire economics. A one-bar rise in differential pressure or a ten-percent drop in normalized flow rarely trips an alarm on its own, yet left untracked it turns into an emergency cleaning, a shortened membrane life, and a chemical bill nobody budgeted for. Most water treatment plants still catch these signals from a monthly spreadsheet review, long after the fouling curve has already bent the wrong way. A connected water treatment membrane program changes that by turning every reading into a trend line instead of a data point. Book a demo to see how it fits your plant.
10-15%
Normalized flow drop that signals RO fouling or scaling
15-25%
Differential pressure rise that should trigger a CIP
SDI 5
Feed water silt density index where particulate risk climbs sharply
15-20
Days a fouling trend runs before it becomes visible on a raw gauge
Why Membrane Trouble Hides in Plain Sight
A water plant membrane rarely fails all at once. It drifts. Feed pressure creeps up half a bar a week, permeate flow eases down a fraction each shift, and because raw readings bounce around with temperature and demand, none of it looks urgent on a control room screen. Operators are left comparing today's number to a memory of what looked normal last month, which is exactly how a WTP membrane ends up in an unscheduled clean-in-place at the worst possible time. The fix is not more gauges — it is comparing every reading to a temperature and pressure-corrected baseline, every day, automatically, so a real fouling trend is separated from ordinary seasonal noise long before it becomes a production problem.
Four Ways a Membrane Actually Fails
Every WTP UF RO membrane fault traces back to one of four mechanisms, and each one leaves a distinct fingerprint in your operating data. Recognizing the fingerprint early is what separates a routine cleaning from a full element replacement.
Particulate Fouling
Suspended solids and colloidal matter build a resistive cake on the membrane surface, usually inside the lead elements first. It shows up as a fast differential pressure rise within weeks of a pretreatment slip.
Organic Fouling
Dissolved organics and humic material adsorb onto the membrane and gradually restrict flux without an equally sharp pressure change, making it easy to miss on pressure gauges alone.
Biofouling
Bacteria colonize the membrane surface and multiply, producing a slow, steady climb in pressure drop that accelerates once the biofilm matures across an array.
Inorganic Scaling
Calcium, silica, and other sparingly soluble salts precipitate as water concentrates through the system, typically appearing in the tail elements and raising rear-stage differential pressure.
UF and RO Speak Different Monitoring Languages
A water treatment UF membrane and an RO membrane share the same enemy, fouling, but they are diagnosed with different numbers. Treating them the same way inside one dashboard is the fastest way to miss an early signal. The table below lines up the core monitoring language for each.
Reading the Fouling Progression Before It Compounds
Industrial plant data on WTP RO systems shows a repeatable sequence once fouling starts: differential pressure climbs first, normalized permeate flow follows it downward, salt passage rises next, and energy consumption climbs last as pumps work harder to hold output. Because this chain plays out over roughly fifteen to twenty days before it crosses an intervention threshold, there is a real window to schedule a cleaning-in-place cycle on your terms rather than reacting to an alarm. A water plant membrane CMMS that ingests SCADA data continuously and normalizes it for temperature, pressure, and recovery is what turns that window into an actual work order instead of a missed opportunity.
Normalized Permeate Flow
10-15% drop
Signals fouling or scaling is restricting output; an upward move instead usually points to membrane damage.
Differential Pressure
15-25% rise
The most common CIP trigger for RO; measuring per housing rather than plant-wide catches lead-element fouling sooner.
Transmembrane Pressure (UF)
10-20% rise
Usually the earliest UF signal, appearing before permeability itself visibly collapses.
Salt Passage
10% rise
Points toward scaling or a compromised membrane rather than simple particulate buildup.
Turn Membrane Thresholds Into Work Orders
Oxmaint's water plant membrane tool normalizes your UF and RO readings automatically and raises a cleaning work order the moment a threshold is crossed, so nobody has to eyeball a spreadsheet trend at month end.
From a Live Reading to a Closed Work Order
A WTP membrane management CMMS earns its keep by closing the loop between a sensor reading and a technician's wrench, without a human having to notice the trend manually first. The sequence below is how that loop runs in a well-tuned membrane PdM program.
1
Continuous Monitoring
Feed pressure, permeate flow, conductivity, and temperature stream in from your BMS or SCADA layer at the same interval every shift, so nothing gets skipped on a busy day.
2
Automatic Normalization
Raw readings are corrected for temperature, pressure, and recovery so a cold morning is never mistaken for a fouled membrane.
3
Baseline Comparison
Each normalized value is trended against your commissioning or post-clean baseline, per housing rather than as a single plant-wide average.
4
Threshold-Triggered Work Order
Crossing a pre-set NDP, TMP, or flow threshold automatically opens a cleaning work order with the specific array and chemistry already attached.
5
Logged History & Reporting
Every clean, backwash, and reading is stored against the specific membrane asset, building the audit trail your next compliance review will ask for.
What Changes on the Ground
A Pretreatment Fix Beat a Cleaning Schedule
A municipal plant running hollow-fiber UF modules was cleaning every thirty days and still losing flux recovery with every cycle. The membranes were not the problem. There was no coagulation step ahead of the UF, so colloidal fouling was rebuilding faster than any CIP could clear it. Once the pretreatment gap was closed, the cleaning interval stretched from thirty days to ninety without touching the cleaning chemistry itself. The lesson holds for most WTP UF CMMS deployments: track the upstream causes, not just the downstream symptom.
3x
Longer interval between CIP cycles
6 hrs
Downtime avoided per skipped CIP
0
Extra cleaning chemistry required
See Your Own Membrane Data Normalized
Connect your existing UF or RO instrumentation and watch Oxmaint build a live baseline for every housing in your plant within a single shift.
Frequently Asked Questions
How is UF membrane cleaning different from RO cleaning-in-place?
UF relies mostly on frequent backwash and chemically enhanced backwash cycles measured in hours, while RO relies on a full CIP with tailored acid or alkaline chemistry measured in days. A water treatment membrane platform tracks both cycles separately since mixing their thresholds leads to over-cleaning one and under-cleaning the other. You can
start a free trial to see both workflows side by side.
What silt density index keeps particulate fouling manageable?
Feed water with a Silt Density Index above 5 is generally treated as a particulate fouling risk for RO. Below that, pretreatment is usually holding, though a rising SDI trend still deserves attention before it crosses the line.
How often should differential pressure actually be logged?
Commercial and municipal systems are typically logged daily, with per-housing readings rather than a single system average, since one fouled element can hide behind an otherwise healthy plant-wide reading.
Can a CMMS turn a BMS fouling alert into a work order automatically?
Yes. Once a normalized reading crosses its set threshold, the system can generate a cleaning work order with the affected array, likely fouling type, and recommended chemistry attached, ready for technician dispatch.
How much membrane life can a proactive PdM program add?
Results vary by feed water and pretreatment quality, but plants that normalize readings and clean on trend rather than on a fixed calendar consistently report fewer emergency CIPs and longer intervals between element replacements.
Book a demo to review your own baseline.
Give Every Membrane a Living Baseline
Oxmaint brings UF and RO monitoring, normalization, and cleaning work orders into one water plant membrane platform, built for teams who would rather trend a fouling curve than chase an emergency clean.