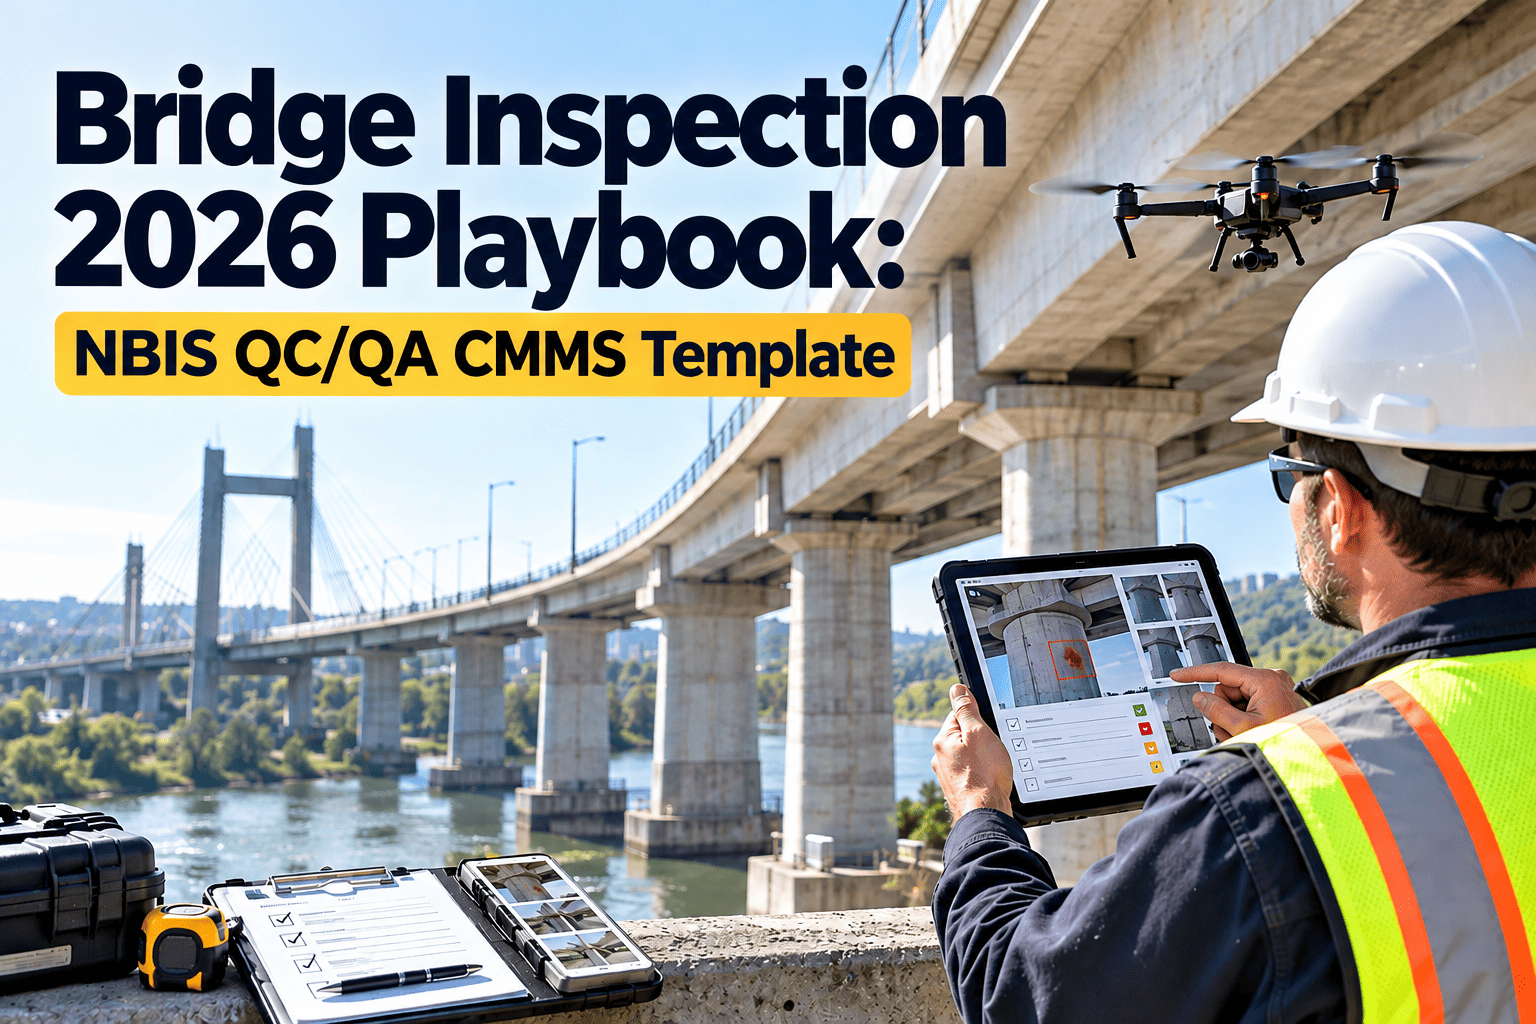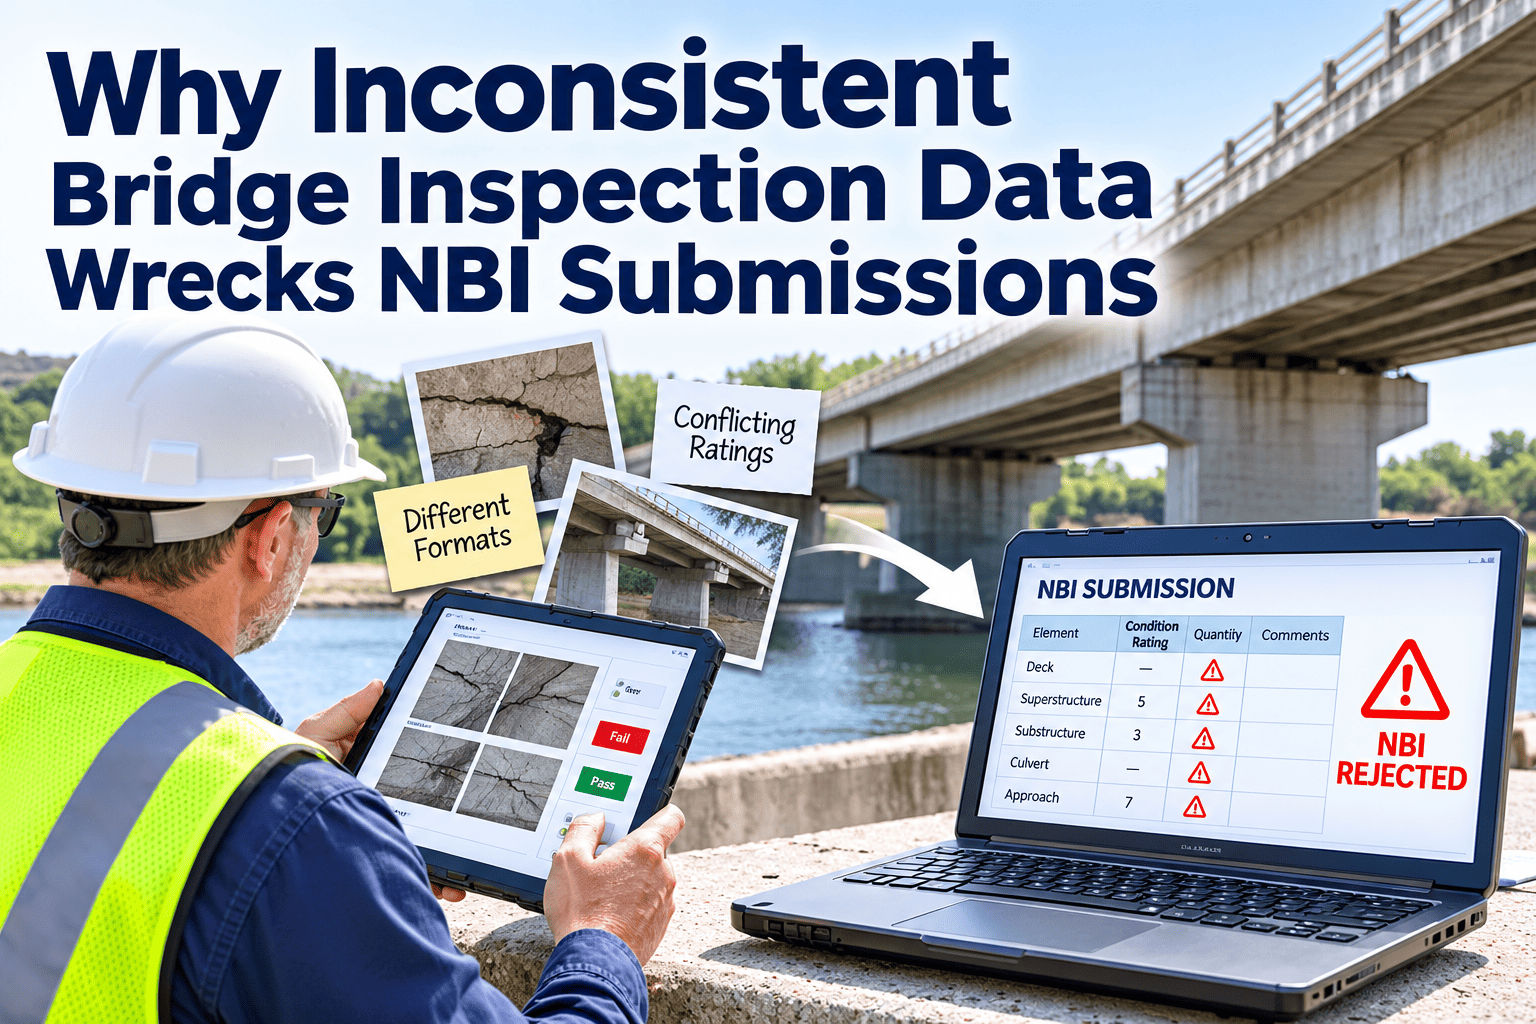
A bridge rating is a small number with a long reach. It decides whether a structure is called Good, Fair or Poor, it feeds the annual National Bridge Inventory submission, and it shapes which projects reach the Statewide Transportation Improvement Program. When two inspectors code the same defect differently, that inconsistency does not stay in the field. It moves into reports, funding arguments and audits. This article explains where bridge inspection data breaks down and how a digital QC/QA workflow in a CMMS can fix the framework.
Why Inconsistent Bridge Inspection Data Wrecks NBI Submissions
Clean NBI submissions and defensible STIP priorities start with consistent field data. Build a QC/QA workflow that catches bad ratings before they travel downstream.
How One Bad Rating Travels Downstream
Most data problems are cheap to fix on the day of inspection and expensive after submission. The table follows a single defect through the chain.
| Stage | Typical defect | Downstream result |
|---|---|---|
| Field inspection | Section loss rated 5 by one inspector and 4 by another | Condition appears to change without any physical change |
| Data entry | Notes typed days later from handwritten sheets | Missing detail and mismatched element quantities |
| Review | Reviewer sees only the final numbers | Logic errors pass through unchallenged |
| NBI submission | Duplicate structure numbers and blank required fields | Rejected records and rushed cleanup near the deadline |
| STIP and funding | Poor rating cannot be traced to evidence | Priority is questioned and the project slips |
Seven Ways Inspection Data Becomes Inconsistent
Few agencies suffer from just one cause. These seven show up repeatedly in inspection programs with mixed paper and spreadsheet tools.
Paper, Excel and CMMS Compared
The point is not that spreadsheets are bad. It is that they cannot enforce the checks an inspection program depends on.
| Control | Paper forms | Excel files | CMMS workflow |
|---|---|---|---|
| Rating validation | None until review | Manual formulas that break | Required fields and logic checks at entry |
| Photo linkage | Separate folders | File paths that go stale | Photos attached to the defect record |
| QC review trail | Initials on a page | Hard to prove who changed what | Timestamped review and return steps |
| Version control | One signed copy | Many copies by email | One record with history |
| Prior-cycle comparison | Pull old binder | Open a second file | Previous ratings shown during inspection |
| Submission prep | Retyping | Manual cleanup and mapping | Filtered, validated export |
| Audit response | Search cabinets | Search drives | Pull the bridge history |
Catch Bad Ratings Before They Reach FHWA
What Federal Rules Expect From an Inspection Program
The National Bridge Inspection Standards in 23 CFR 650 Subpart C set the baseline for public bridges on public roads. The 2022 update tightened expectations around qualifications, risk-based inspection intervals and quality programs.
From Messy Records to Defensible STIP Priorities
Good, Fair and Poor classifications come from the lowest rating among deck, superstructure and substructure, or culvert. One inconsistent rating can therefore move a whole bridge across a threshold.
- Poor bridges listed without defensible evidence
- Planners rebuild the story from old reports
- Funding programs see uncertain need
- Rating changes look like data errors
- Every rating links to notes, photos and reviewer
- Deterioration trends are visible across cycles
- Candidate lists filter by condition and work type
- Changes in condition have a documented cause
Why the stakes are higher now
- Federal performance measures for National Highway System bridges set a minimum condition expectation based on deck area in Poor condition
- Infrastructure Law programs such as the Bridge Formula Program and Bridge Investment Program put bridge need under closer review
- Element-level data and the move to the SNBI make small coding errors more visible
A Digital QC/QA Workflow That Fixes the Source
Quality control happens on every inspection. Quality assurance samples the program. Both need a trail that survives staff changes.
Validation rules worth enforcing
- No rating of 4 or lower without a photo and a note
- Rating drops of more than one point trigger a reviewer comment
- Structure numbers must match the inventory and cannot duplicate
- Element quantities must reconcile with geometry or prior quantities
- Critical findings create a corrective work order immediately
What a Submission-Ready Inspection Record Contains
A record is submission-ready when someone who was not on site can understand and defend it. Aim for these elements on every inspection.
- Correct structure identifier and inspection type
- Inspector, team leader and reviewer names with dates
- Condition ratings for each required component, with notes for ratings that changed
- Photos that show each defect behind a low rating
- Element quantities and condition states that reconcile with prior data
- Recommended work and any urgent follow-up created
- Load rating and posting status, where applicable
Inspection types and what each record needs
| Inspection type | Typical purpose | Record emphasis |
|---|---|---|
| Routine | Scheduled condition assessment | Ratings, photos, change notes |
| Fracture critical | Close review of members whose failure could affect stability | Hands-on findings, access method, crack documentation |
| Underwater | Condition of submerged substructure | Diver notes, scour findings, channel observations |
| Damage or special | Response to an event or monitoring need | Cause, extent, restrictions and follow-up |
The hidden cost of cleanup near the deadline
- Senior engineers spend time correcting entry errors instead of reviewing structures
- Inspectors are recalled to recreate missing details from memory
- Rushed fixes introduce new errors that surface in the next cycle
- Planning teams lose confidence in condition data and rely on informal knowledge
Root Causes by Role and the Control That Fixes Each
Data quality is a team outcome. Each role introduces a different risk and needs a different control.
| Role | Common data problem | Control that fixes it |
|---|---|---|
| Inspector | Rates from memory or from inconsistent guidance | Forms with definitions, prior ratings shown and required photos |
| Team leader | Approves without seeing the previous cycle | Side-by-side comparison with prior inspection data |
| Reviewer | Checks totals but not supporting evidence | Checklist items and logged returns |
| Data coordinator | Retypes and merges multiple files | Direct export from validated records |
| Program manager | Sees problems only after submission | Dashboards for returns, overdue work and error counts |
| Planner | Cannot trace a Poor rating to evidence | Linked photos, notes and corrective work history |
Trends Changing Bridge Inspection Data
The inspection toolbox is changing quickly, and every new tool produces more data that has to be controlled.
An Illustrative Walk-Through: One Bearing Defect, Two Outcomes
This is a hypothetical scenario, not a case study. It shows how the same field observation behaves under each approach.
- Inspector notes corroded bearings on a sheet and rates conservatively
- Notes are typed the next week and the photo is saved under a date
- Reviewer sees a lower rating than the last cycle and no evidence
- The planner asks for support months later and staff search folders
- The repair needs a rushed scope and the request stalls
- Inspector sees the prior rating and records the defect with a photo on site
- Rules require a note for the rating drop
- Reviewer approves with the evidence in front of them
- A corrective work order is created and linked to the bearing
- The planner finds the history without a search
From Defect to Repair: Linking Inspection and Maintenance
Inspection data loses value if defects never become work. Linking the two also helps explain why a rating improved or declined between cycles.
- Define which findings create corrective work orders automatically, such as critical findings and scour concerns
- Schedule recurring maintenance for items that drive deterioration, such as deck drains, joints, bearings and debris
- Attach after-repair photos so the next inspector sees what changed
- Track closure time for safety-related findings separately from routine repairs
- Use maintenance history to explain rating improvements, not just declines
Writing a Bridge Data Standard Your Team Can Follow
Software enforces rules, but people must agree on the rules first. A short written data standard keeps every team coding the same way.
Where Oxmaint Fits in a Bridge Inspection Program
Oxmaint maintenance management software gives inspection and maintenance teams a shared record, so condition data and repair work stop living in separate systems.
Data Quality Scorecard for Inspection Managers
These measures show whether the data framework is improving. Define thresholds with your own program staff.
Pre-Submission Data Audit Checklist
Run this audit well before the annual submission window.
- Reconcile structure numbers against the inventory
- List bridges overdue for inspection by type
- Check each Poor rating for photo and note support
- Compare ratings with the last cycle and explain changes
- Verify element quantities and units
- Confirm load rating and posting status are current
- Review returned QC records for repeat issues
- Export a test file and review rejected fields
- Assign owners for every data gap