Portfolio HVAC KPI dashboard design is where operations leadership either gains actionable visibility or gets lost in data noise. A dashboard that shows raw work order counts and equipment lists tells an operations director nothing about whether their portfolio is performing. A dashboard designed around uptime rates, mean time to response, energy variance, and backlog aging gives leadership the four signals needed to make resourcing decisions, identify underperforming sites, and track improvement programs without hunting through site-level reports. The design problem is not data availability — most CMMS and BAS platforms generate abundant data. The problem is translating that data into KPIs that match the decisions operations leaders actually need to make. OxMaint gives multi-site facility operations teams the maintenance management and reporting infrastructure to Sign Up Free and build portfolio-level visibility into HVAC performance from a single platform. If your leadership team currently reviews HVAC performance through manually compiled site reports, Book a Demo to see how OxMaint supports portfolio KPI dashboards through structured maintenance data.
OxMaint connects multi-site maintenance data into portfolio KPI reporting — so operations leaders see uptime, response speed, backlog, and energy performance without waiting for site reports.
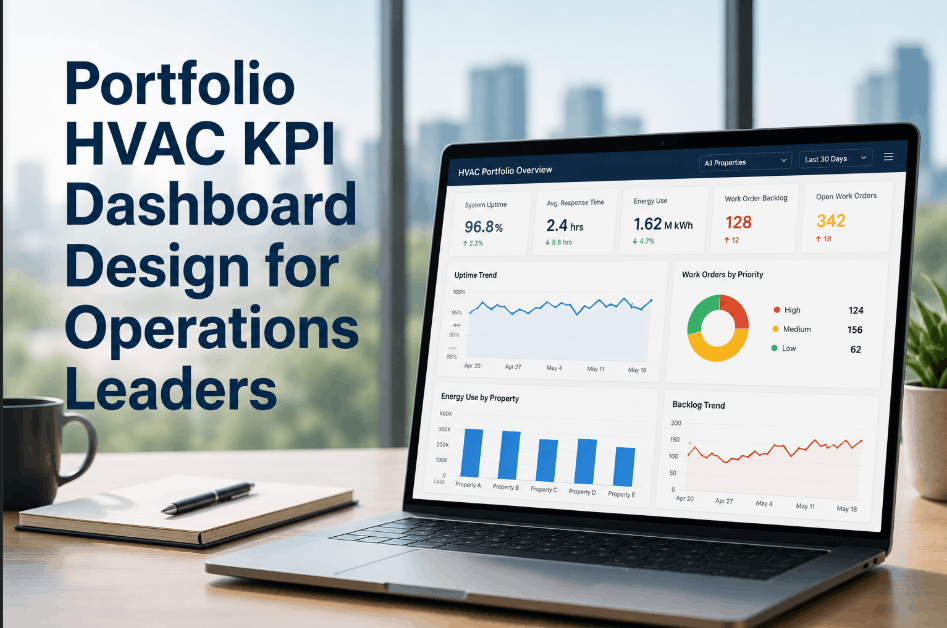
Four KPI Dimensions Operations Leaders Need to See
An effective portfolio HVAC KPI dashboard gives operations leadership four specific signal types — each answering a distinct management question that drives resourcing, escalation, and planning decisions.
What percentage of critical HVAC assets are available and performing? Uptime rates by equipment class and site identify where reliability programs are failing before occupants or tenants report failures.
How long does it take from fault detection to technician dispatch to resolution? MTTR and response time trends by site and equipment type reveal where service delivery is falling behind SLA or contract requirements.
Which sites are consuming energy above baseline relative to degree-day-normalized benchmarks? Energy variance patterns flag control issues, equipment degradation, or scheduling failures before utility bills arrive.
What is the age distribution of open work orders and PM completion rates across the portfolio? Backlog aging and overdue PM counts measure whether the maintenance program is keeping up with deferred work accumulation.
Portfolio Dashboard Design Components
A functional operations dashboard requires four design decisions that determine whether the output drives action or creates reporting overhead. Sign Up Free to manage each component as a structured reporting workflow in OxMaint. These elements determine dashboard utility at the leadership level.
Define no more than 8–10 primary KPIs with explicit calculation rules — MTTR in hours, PM completion rate as percentage of scheduled tasks, uptime as available hours divided by total hours. Undefined metrics produce inconsistent site-to-site comparisons that destroy dashboard credibility.
Structure the dashboard to support drill-down from portfolio summary to site level to equipment class. Operations leaders need the summary view for decisions; site managers need the drill-down for execution. A flat list of site data satisfies neither.
Attach performance thresholds to each KPI — green/amber/red bands that allow operations leaders to scan the portfolio for out-of-band sites without reading every number. Threshold bands convert a reporting dashboard into a management dashboard.
Display rolling 30, 60, and 90-day trend lines alongside current period values. Point-in-time KPIs without trend context allow improving or deteriorating sites to appear the same. Trend data is what separates a dashboard from a monthly report.
Portfolio HVAC KPI Reference Framework
How OxMaint Powers Portfolio HVAC KPI Dashboards
Portfolio visibility requires a maintenance platform that captures structured data across all sites — not site-level tools that each produce custom exports. Book a Demo to see how OxMaint's multi-site architecture supports portfolio KPI reporting without manual data aggregation.
OxMaint captures work order data across all sites in a single platform — enabling portfolio KPI calculation without site-by-site report collection or spreadsheet consolidation.
Track PM completion rates across the portfolio by site, equipment class, and technician — giving operations leaders visibility into where preventive maintenance compliance is lagging before backlog accumulates. Sign Up Free to activate this reporting today.
Maintain a complete asset register across all sites in OxMaint — with equipment class, criticality tier, age, and maintenance history attached to each unit — supporting uptime calculation and replacement planning.
OxMaint timestamps work order creation, assignment, and completion — producing MTTR and first-response metrics at the portfolio level that operations leaders can compare across sites and vendors.
OxMaint backlog reports show open work order age distribution by site — identifying where deferred work is accumulating before it creates equipment risk. Book a Demo to see portfolio backlog reporting in action.
Configure scheduled portfolio summary reports in OxMaint that deliver KPI snapshots to operations leadership on defined cadences — replacing manual site-level data collection with automated structured reporting.
OxMaint gives operations leaders multi-site maintenance data visibility, structured KPI reporting, and portfolio-level backlog and uptime tracking — so leadership decisions are based on real performance data, not site manager summaries. Sign Up Free or Book a Demo to build your portfolio dashboard today.
Frequently Asked Questions
OxMaint gives operations leaders the KPI visibility, backlog tracking, and PM compliance reporting infrastructure to manage HVAC performance across every site from a single platform.