Grocery chain refrigeration portfolios fail at different rates depending on asset age, installation environment, service history, and load intensity — yet most operators apply uniform PM schedules and replacement timelines across the entire fleet. Facility teams using Sign Up Free on OxMaint can build refrigeration asset lifecycle benchmarks that correlate repair frequency, compressor wear patterns, and leak exposure data to actual replacement timing decisions. Replacing uniform equipment management with benchmarked lifecycle data reduces food safety risk, emergency repair costs, and capital planning errors across multi-site grocery portfolios.
Why Lifecycle Benchmarking Matters for Grocery Refrigeration Portfolios
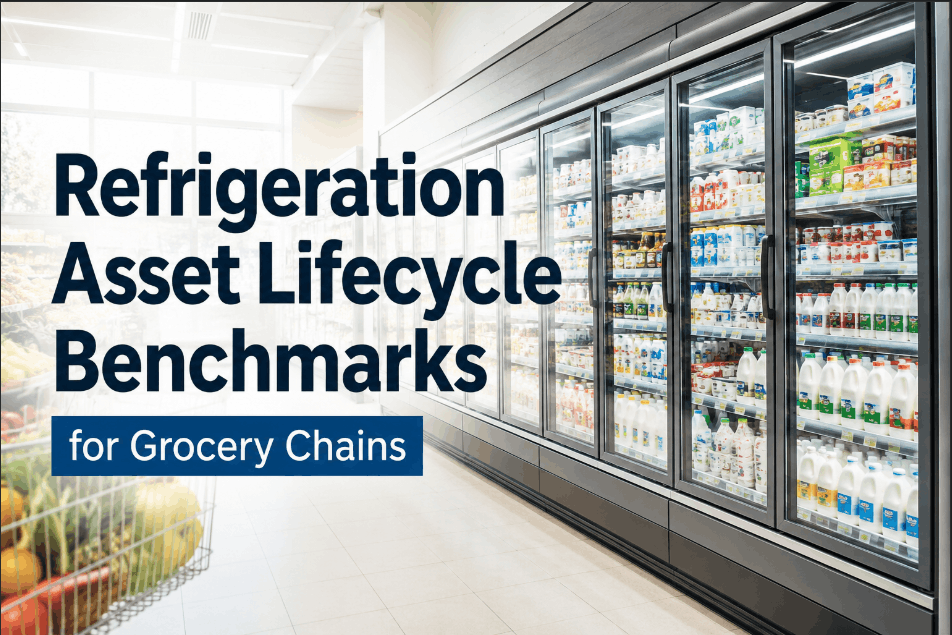
A refrigeration display case approaching end of lifecycle in a high-volume produce section carries materially different risk than an identical unit serving a low-turnover frozen aisle. Without asset-level repair history and failure rate benchmarks, facility managers cannot distinguish aging assets requiring replacement planning from units that remain cost-effective to maintain. Book a Demo to see how OxMaint tracks refrigeration asset performance across grocery locations, enabling data-driven lifecycle decisions that protect food safety and operating budgets.
Five Lifecycle Benchmark Metrics for Grocery Refrigeration Assets
Effective refrigeration lifecycle benchmarking requires tracking performance dimensions that correlate with failure probability and replacement timing. Sign Up Free to begin capturing refrigeration asset data in OxMaint and build the lifecycle performance baseline your portfolio management requires.
Repair Frequency Rate by Asset Age Cohort
Tracking the number of unplanned service events per asset per year, grouped by installation age, reveals the inflection point at which repair frequency accelerates. Assets exceeding two to three unplanned repairs annually typically signal approach to lifecycle end — regardless of calendar age.
Refrigerant Leak Exposure and Annual Charge Volume
Cumulative refrigerant leak exposure tracks both environmental compliance risk and systemic seal degradation. Assets requiring annual refrigerant additions above 10% of system charge indicate compressor, valve, or line set deterioration that makes continued operation increasingly costly and regulatory exposure high.
Compressor Wear Indicators and Amperage Trend
Compressor amperage draw trending above nameplate specification, increasing suction pressure variance, and elevated discharge temperatures are measurable wear indicators that precede compressor failure. Logging compressor performance readings at each PM event in OxMaint builds the trend data needed for early replacement decisions.
Temperature Exceedance Frequency and Duration
Tracking how often each case exceeds safe temperature thresholds — and for how long — connects equipment performance directly to food safety risk. Assets with increasing exceedance frequency despite current PM coverage are candidates for accelerated replacement planning before a regulatory or food safety event occurs.
Total Maintenance Cost vs. Replacement Value Ratio
Cumulative repair and PM costs expressed as a percentage of current replacement value provide the clearest single replacement trigger metric. Assets where three-year service costs exceed 50–60% of replacement cost are almost universally better candidates for capital replacement than continued repair investment.
Refrigeration Lifecycle Benchmarks by Equipment Type
Different refrigeration equipment types in grocery environments carry distinct lifecycle profiles and failure drivers. Book a Demo to see how OxMaint organizes refrigeration asset records by equipment type, location, and service history to support multi-site portfolio benchmarking.
| Equipment Type | Typical Service Life | Primary Failure Driver | End-of-Life Signal | OxMaint Benchmark Lever |
|---|---|---|---|---|
| Open Produce Display Cases | 10–14 years | Evaporator coil corrosion, defrost failure | Repeated defrost cycle failures | Defrost fault frequency tracking |
| Reach-In Dairy Cases | 12–18 years | Door gasket wear, compressor aging | Compressor amperage trending above nameplate | PM compressor readings log |
| Walk-In Coolers | 15–25 years | Condenser fouling, panel seal degradation | Increasing refrigerant charge frequency | Annual leak and charge volume records |
| Frozen Food Cases | 12–16 years | Defrost heater failure, refrigerant leaks | Temperature exceedance above -10°F threshold | Temperature exceedance event log |
| Rack Refrigeration Systems | 15–20 years | Compressor wear, oil separator degradation | Rising suction pressure variance across circuits | Suction pressure trend log by circuit |
How Lifecycle Benchmarking Reduces Grocery Refrigeration Risk
Refrigeration asset management without lifecycle benchmark data creates compounding operational, food safety, and capital planning risks across the grocery portfolio. Sign Up Free to connect your refrigeration service records to OxMaint's asset lifecycle tracking and start building the benchmark data that improves replacement timing decisions.
Frequently Asked Questions: Refrigeration Asset Lifecycle Benchmarks for Grocery Chains
What is refrigeration asset lifecycle benchmarking?
Lifecycle benchmarking tracks repair frequency, failure types, refrigerant usage, and maintenance costs by asset and age cohort to identify when individual units or equipment populations are approaching optimal replacement timing.
How does OxMaint support refrigeration lifecycle management?
OxMaint logs service history, parts costs, and performance readings at the asset level, enabling repair frequency analysis, cost-to-replacement ratio calculations, and PM schedule adjustments based on lifecycle stage.
What repair frequency signals end-of-lifecycle for grocery refrigeration?
Assets requiring more than two to three unplanned service events per year, with cumulative three-year repair costs exceeding 50–60% of replacement value, are typically strong replacement candidates regardless of calendar age.
How does refrigerant leak history indicate asset lifecycle stage?
Recurring refrigerant additions above 10% of system charge annually indicate progressive seal and compressor degradation. Cumulative leak exposure also creates regulatory compliance risk under EPA Section 608 charge thresholds for commercial refrigeration systems.
Can lifecycle benchmarks be applied across multi-site grocery portfolios?
Yes — OxMaint enables cross-location comparison of failure rates, repair costs, and lifecycle stage by equipment type, identifying which locations carry the highest end-of-life asset risk and where capital replacement investment should be prioritized.