Constrained production lines fail under pressure in ways that are difficult to predict from standard throughput models. Buffers that appear adequate during normal operations empty in minutes when a bottleneck shifts, and throughput losses that look recoverable on a capacity plan become unrecoverable in a live schedule. Operations teams using Sign Up Free with Oxmaint capture the asset health, maintenance history, and work order data that digital twin stress testing models depend on — ensuring virtual scenario analysis is grounded in actual equipment behavior, not theoretical specifications. Book a Demo to see how Oxmaint feeds asset performance data into constrained line analysis and what-if scenario planning for manufacturing and process operations. Teams that validate their models against real maintenance history before running stress scenarios get results they can act on. Sign Up Free and connect Oxmaint's asset data to your line simulation and capacity planning workflow.
DIGITAL TWIN · SCENARIO SIMULATION · CONSTRAINT MAPPING · CAPACITY PLANNING · 2026
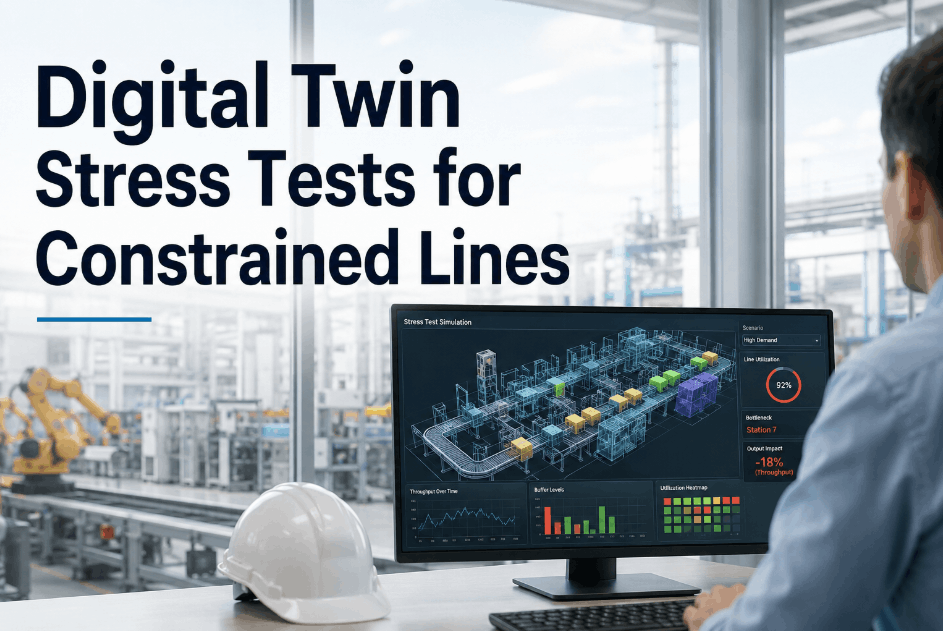
Digital Twin Stress Tests for Constrained Lines
Run virtual stress scenarios on constrained production lines to see where buffers fail, bottlenecks shift, and throughput drops before schedules tighten — using Oxmaint's asset performance data to ground simulation models in real equipment behavior.
82%Of constrained line throughput failures involve bottleneck shifts that were predictable from asset performance trends already in maintenance records
VirtualStress testing in a virtual environment costs nothing — discovering buffer failure in a live schedule costs hours of production
What-IfWhat-if analysis is only as useful as the data it runs on — asset maintenance history is the fidelity foundation for credible scenario results
ShiftBottlenecks move when constraints change — scenario simulation reveals where the new constraint lands before the schedule depends on it
Why Constrained Line Stress Tests Fail Without Real Asset Performance Data
Digital twin simulations built on nameplate capacity and theoretical uptime produce optimistic stress test results that don't reflect how equipment actually behaves under load. The gap between simulation fidelity and operational reality comes from missing asset health data — downtime history, failure frequency, mean time between failures, and maintenance backlog — that only a connected CMMS can provide. Book a Demo to see how Oxmaint's asset and work order data feeds constrained line models with the performance history that makes scenario results operationally credible.
Simulation Fidelity
Models Built on Specs, Not History
Stress test scenarios built from OEM specifications miss the actual reliability behavior of aging or maintenance-intensive assets. Oxmaint provides asset-level MTBF, downtime frequency, and failure mode history — the operational inputs that make digital twin scenarios reflect real constraint behavior rather than theoretical performance.
Bottleneck Visibility
Constraint Shifts Are Invisible Until They Happen
When a primary constraint improves, it exposes the next bottleneck in the sequence. Without scenario modeling grounded in the maintenance history of candidate assets, operations teams cannot see where the constraint will land after a throughput intervention. Oxmaint's work order and downtime data provides the asset reliability context that reveals which equipment becomes the next constraint.
The 4 Phases of Digital Twin Stress Testing for Constrained Lines
1
Asset Performance Baseline
Extract actual asset reliability data — downtime frequency, MTBF, failure modes, and maintenance backlog — from Oxmaint's work order and asset history. This operational baseline replaces theoretical uptime assumptions with measured equipment behavior, giving the stress test model credible fidelity before a single scenario runs.
2
Constraint Mapping
Identify the current binding constraint and the sequence of secondary constraints that would activate if the primary is relieved. Oxmaint work order queue depth by asset and line section provides the demand-loading data that constraint mapping requires — making the bottleneck sequence visible rather than assumed.
3
Scenario Construction and Testing
Build stress scenarios around demand spikes, maintenance downtime events, and buffer depletion rates grounded in actual asset performance data.
Book a Demo to see how Oxmaint's maintenance and asset data supports constrained line scenario construction for production planning teams.
4
Model Validation and Decision Output
Validate scenario results against historical production events to confirm model fidelity before using outputs for scheduling decisions. Oxmaint's historical downtime records provide the validation data set — confirming that the model predicts events consistent with what actually happened on the line before trusting it for forward-looking decisions.
Stress Test Scenario Reference — Constrained Line Variables
| Scenario Variable |
Data Source |
Stress Threshold |
Failure Indicator |
Buffer Response |
Model Fidelity Requirement |
| Demand spike |
Production schedule history |
+20–30% above baseline |
Queue depth exceeds buffer |
WIP accumulation at constraint |
Asset MTBF data required |
| Unplanned asset downtime |
Oxmaint WO downtime records |
MTBF − 1 sigma event |
Buffer depletion time |
Starved downstream stations |
Failure frequency per asset |
| Maintenance backlog surge |
Oxmaint WO queue depth |
Backlog > 2× weekly capacity |
PM deferrals increasing |
Reliability degradation lag |
PM compliance rate history |
| Bottleneck shift (post-improvement) |
Throughput and OEE records |
Primary constraint > 85% OEE |
Secondary asset utilization spike |
New constraint exposed |
All-asset reliability baseline |
| Changeover extension |
WO task time records |
Actual vs. planned > 25% |
Buffer starvation rate |
Reduced effective run time |
Changeover time distribution |
| Multi-asset concurrent failure |
Oxmaint failure mode history |
2+ critical assets simultaneous |
Line stop event |
Full buffer depletion |
Correlated failure mode data |
How Oxmaint Supports Digital Twin and Scenario Analysis for Production Lines
Oxmaint captures the asset performance history that production simulation models require — downtime events, work order frequencies, failure modes, PM compliance rates, and maintenance backlog depth — all linked to specific assets and line sections. When this data feeds into digital twin models, stress test scenarios reflect how equipment actually behaves under load rather than how it was designed to perform. Sign Up Free to connect Oxmaint's asset and maintenance data to your constrained line analysis and scenario planning workflow.
Asset Reliability Baseline
MTBF, downtime frequency, and failure mode data per asset — the operational fidelity foundation for credible digital twin stress scenarios.
Maintenance Backlog Visibility
Work order queue depth by asset and line section — enabling backlog-driven reliability degradation modeling in constrained line scenarios.
PM Compliance Tracking
Planned maintenance completion rates tracked by asset — providing the compliance history that predicts reliability drift under demand pressure.
Downtime Event Records
Timestamped downtime records with failure codes and duration — the historical event data that validates model outputs against actual line behavior.
OEE and Throughput Data
Asset-level OEE and production throughput records from Oxmaint work orders — enabling constraint identification and bottleneck shift scenario modeling.
Line Section Work Order History
Work order history segmented by line section and asset — giving scenario models the spatial context to map how failures propagate through the constraint sequence.
Ground Your Stress Tests in Real Asset Data. Find Constraint Failures Before Schedules Do.
Oxmaint provides the asset reliability baseline, downtime history, and maintenance backlog data that digital twin stress scenarios require — making constrained line simulations credible enough to drive scheduling and capacity decisions.
Frequently Asked Questions — Digital Twin Stress Tests for Constrained Lines
What data makes a digital twin stress test credible for a constrained line?
Asset-level MTBF, downtime frequency, failure modes, PM compliance rates, and maintenance backlog depth — operational data that reflects actual equipment behavior, not nameplate specifications.
How does Oxmaint support constrained line scenario analysis?
Oxmaint captures asset reliability history, downtime events, and work order data by line section — providing the performance baseline that simulation models need to produce credible stress test results.
What is a bottleneck shift and why does it matter in stress testing?
A bottleneck shift occurs when a primary constraint improves and exposes the next binding asset in the sequence. Stress scenarios must model the full constraint chain to avoid optimizing one bottleneck while creating another.
How often should constrained line stress tests be run?
Before major schedule changes, after throughput interventions, and whenever asset reliability data shows a meaningful shift in MTBF or downtime frequency on a constraint asset.
Can Oxmaint data be used to validate digital twin model outputs?
Yes. Oxmaint historical downtime records provide the event data set needed to confirm that a model predicts behavior consistent with what actually occurred on the line.
Build Stress Test Models That Reflect How Your Line Actually Behaves.
Oxmaint provides asset performance history, downtime records, and maintenance backlog data — the operational inputs that give digital twin stress scenarios the fidelity needed to find buffer failures, constraint shifts, and throughput risks before schedules tighten.