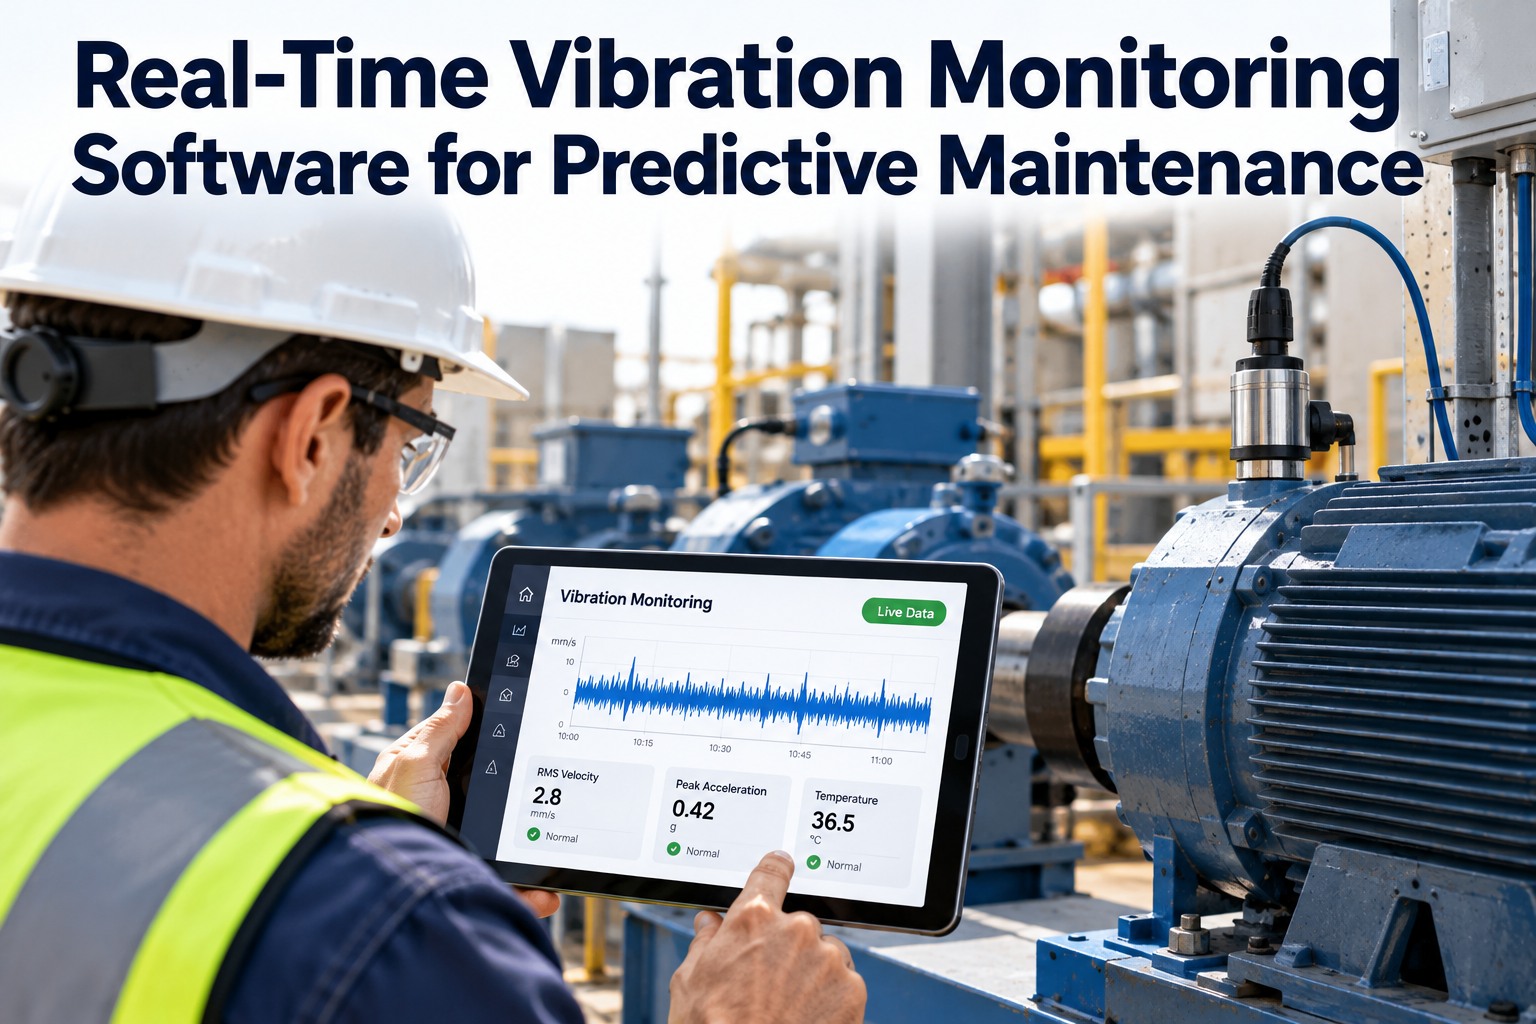
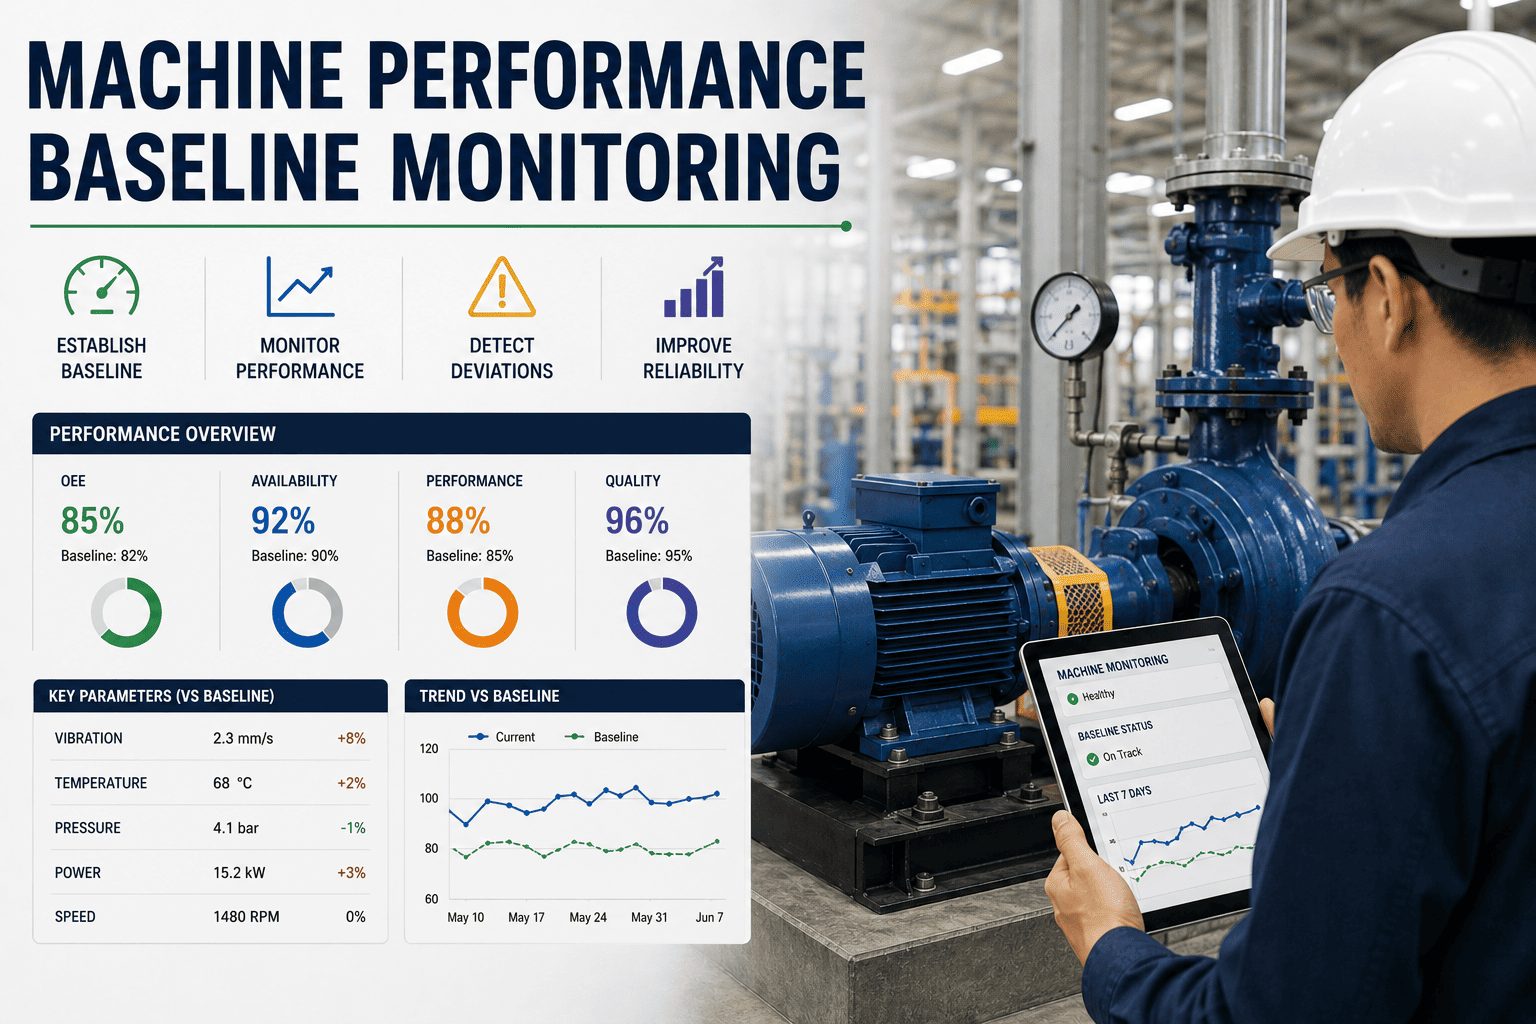
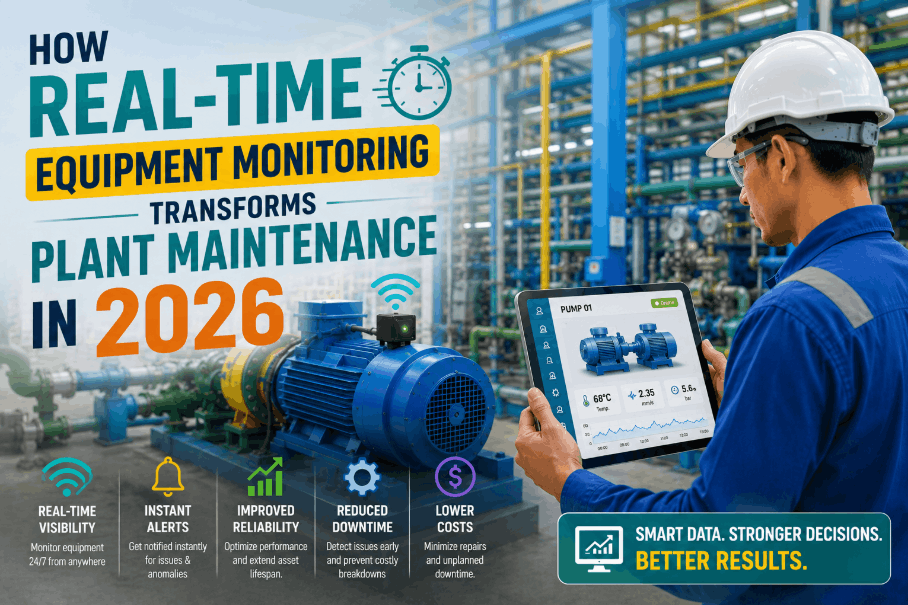
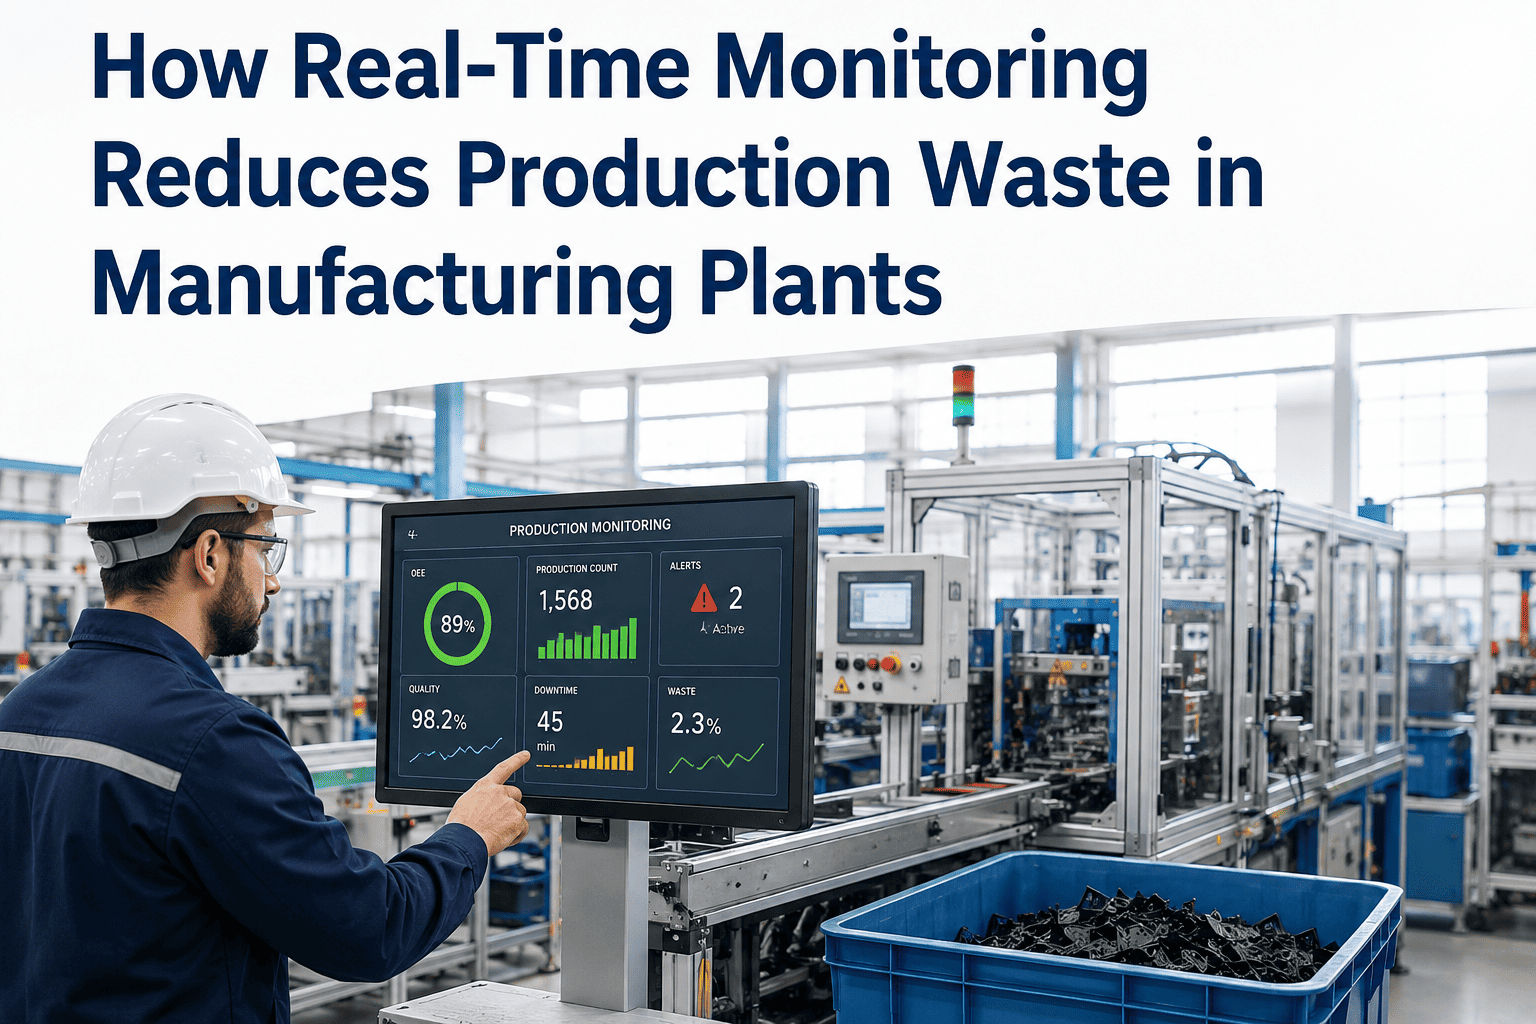
Overall Equipment Effectiveness is the metric that exposes what daily production reports hide — the slow cycles, the minor stops nobody logs, the changeovers that quietly eat into run time. A smart factory running multiple production lines knew its output targets but had no consistent way to see Availability, Performance, and Quality losses as they happened. Sign Up Free to start tracking OEE in real time across your lines — or Book a Demo to see the Six Big Losses framework applied to your floor.
OEE Analytics · Real-Time Monitoring · Six Big Losses
Find the Hidden Factory Inside Equipment You Already Own
Live OEE dashboards, Six Big Losses tracking, downtime Pareto analysis, and closed-loop work order automation — Oxmaint helps manufacturing teams see exactly where productivity is being lost, shift by shift.
Facility Profile
The Operation: Multiple Lines, No Shared OEE Visibility, and a Production-Maintenance Disconnect
Facility Overview
IndustrySmart factory — multi-line manufacturing with mixed CNC, press, and assembly equipment
Prior ApproachOEE calculated manually and intermittently from shift-end reports, not tracked live on the floor
Core Pain PointPlant-average OEE well below world-class benchmark, with no clear visibility into which loss category was driving the gap
Oxmaint ModulesOEE Analytics · Six Big Losses Tracking · Downtime Pareto Analysis · OEE-to-CMMS Closed Loop · Custom Reporting
Baseline Pressure Points
68%
Typical plant-average OEE for manufacturers before structured tracking — well below the 85% world-class benchmark and even below the 60% industry average
6
Distinct loss categories under the TPM Six Big Losses framework — equipment failures, setup time, minor stops, slow cycles, startup rejects, production rejects — none tracked separately before deployment
Hrs
Of daily downtime visible only in retrospect through shift-end paperwork, with no automatic reason-code categorization to identify chronic contributors
Root Cause Analysis
Why OEE Stayed Flat Even With an Active Production Reporting Process
A review of shift reports and downtime logs found that OEE was being calculated, but too infrequently and too coarsely to act on. Availability, Performance, and Quality losses were blended into a single end-of-shift number, with no breakdown by loss category, machine, or shift to guide improvement priorities. Sign Up Free to see your own plant's OEE breakdown — or Book a Demo to walk through live OEE dashboards.
01
OEE Calculated Only at Shift End, Not in Real Time
Without live monitoring, supervisors learned about lost productivity hours after the fact. A line running slow or stopping intermittently through a shift produced no alert and no opportunity to intervene before the output target was missed.
02
Availability, Performance, and Quality Losses Never Separated
A single blended OEE number told the team productivity was low but not why. Equipment failures, changeover time, minor stops, slow cycles, and quality rejects were not broken out, so improvement efforts targeted guesses rather than the actual largest loss.
03
No Automatic Downtime Reason Coding
Downtime causes were recorded manually and inconsistently between operators, making it difficult to run a reliable Pareto analysis to find the few causes responsible for most of the lost time.
04
No Link Between OEE Drops and Maintenance Response
When OEE dropped due to an equipment issue, there was no automatic trigger to maintenance. Production and maintenance teams worked from separate systems, slowing the time between a problem appearing on the floor and a work order being opened.
The Solution
How Oxmaint OEE Analytics Connected Real-Time Visibility to Maintenance Action
The facility deployed Oxmaint's OEE Analytics module to calculate Availability, Performance, and Quality continuously from machine and operator data, replacing manual end-of-shift estimates with live dashboards visible on the plant floor. Sign Up Free to connect your own line data, or Book a Demo to see how real-time OEE applies to your specific line configuration.
01
Live OEE Dashboards by Machine, Line, and Shift
Real-time Availability × Performance × Quality scores are now visible per machine and aggregated by line and shift, with instant alerts when OEE drops below a configured threshold so supervisors can intervene while a shift is still running.
02
Six Big Losses Tracked and Categorized Automatically
Equipment failures, setup and adjustment time, minor stops, reduced speed, startup rejects, and production rejects are tracked as distinct categories, replacing a single blended OEE figure with a clear breakdown of where time and output are actually being lost.
03
Downtime Pareto Analysis With Auto Reason Coding
Downtime is now captured with standardized reason codes and visualized through Pareto analysis, letting the team identify the small number of chronic causes responsible for the majority of lost production time, alongside live MTBF and MTTR tracking.
04
Closed-Loop Integration Between OEE and Maintenance Work Orders
When OEE drops below threshold or a specific downtime reason is logged, Oxmaint automatically creates a maintenance work order, then tracks the OEE recovery once the repair is complete — closing the loop from detection to resolution in one connected workflow.
Results
What OEE Looked Like After Real-Time Monitoring Was Deployed
Results are illustrative, based on Oxmaint's published platform-wide outcomes across its OEE Analytics customer base; figures for your facility will depend on starting OEE, equipment mix, and data collection maturity. Sign Up Free to start measuring your own baseline OEE.
25%
Typical OEE improvement reported by manufacturers using Oxmaint's real-time OEE analytics
40%
Typical reduction in downtime once Six Big Losses tracking surfaces chronic causes for targeted action
17%
Additional production capacity unlocked by closing the gap to 85% world-class OEE without new capital equipment
44%
Faster maintenance response time once OEE drops trigger automatic work order creation in the closed-loop workflow
10–25%
OEE improvement range most manufacturers see within the first year of consistent, real-time tracking
Hours
Typical time to first actionable insight after installation, since accurate OEE measurement alone often reveals quick wins
| Metric |
Before Real-Time OEE |
With Oxmaint OEE Analytics |
Typical Change |
| OEE visibility |
End-of-shift, manual |
Real-time, per machine |
Continuous |
| Plant-average OEE |
~60-68% typical baseline |
Improved toward world-class |
+25% typical |
| Downtime |
Baseline |
Reduced via loss targeting |
-40% |
| Loss category visibility |
Blended, not separated |
Six Big Losses tracked individually |
Full breakdown |
| Maintenance response to OEE drop |
Manual handoff, delayed |
Auto work order on threshold breach |
+44% faster |
OEE Analytics
Measure Your Real OEE Before You Try to Improve It
Most manufacturers discover their true OEE is lower than expected the moment they start measuring it accurately. See your Availability, Performance, and Quality breakdown in one live dashboard.
FAQ
How does Oxmaint calculate OEE in real time?
Oxmaint multiplies Availability, Performance, and Quality using live data from sensors, operator input, or existing system integrations, updating the score continuously instead of waiting for end-of-shift manual calculation.
What are the Six Big Losses and why do they matter?
They are the standard TPM categories behind lost productivity — equipment failures, setup and adjustment time, minor stops, reduced speed, startup rejects, and production rejects. Tracking them separately shows exactly which loss to target first.
What counts as a good OEE score?
Roughly 40% is considered low, 60% is typical for most manufacturers, and 85% is the world-class benchmark achieved by only a small share of operations. The goal is continuous improvement rather than a single fixed target.
How does OEE tracking connect to maintenance work orders?
When OEE drops below a configured threshold or a specific downtime reason is logged, Oxmaint can automatically generate a maintenance work order and then track OEE recovery once the issue is resolved, closing the loop between production and maintenance.
OEE Analytics
See Where Your Hidden Factory Capacity Is Sitting Right Now
Oxmaint turns Availability, Performance, and Quality into a live dashboard your floor can act on the same shift — connected directly to maintenance work orders when issues are found.