Three forces are converging to make EAF the dominant steelmaking technology of the next two decades: carbon regulation, scrap availability, and grid decarbonization. Plants already operating EAFs have a structural advantage — and plants considering the transition need to understand both the opportunity and the operational requirements. Managing EAF operations effectively requires digital maintenance platforms like OXmaint that handle the unique demands of electric steelmaking.
Carbon Regulation Pressure
EU CBAM, US EPA regulations, and Asian carbon markets are putting a price on every ton of CO₂. At $50–100/ton carbon cost, BF-BOF steelmaking faces $90–180/ton additional cost versus EAF. By 2030, this gap widens as carbon prices increase and free allowances phase out. EAF operators avoid 1.4 tons of CO₂ per ton of steel — worth $70–140 in carbon cost savings alone.
Scrap Availability & DRI Growth
Global obsolete scrap generation is growing 2–3% annually as infrastructure from the 1960s–1990s building boom reaches end-of-life. Simultaneously, hydrogen-based DRI (direct reduced iron) is scaling — giving EAFs access to virgin-quality metallic feed without the blast furnace. By 2030, 40+ million tons of green DRI capacity is planned globally.
Grid Decarbonization
EAF emissions depend on electricity source. As grids add renewable capacity, EAF carbon intensity drops automatically — without any change to the steelmaking process. An EAF running on 80% renewable power produces steel at 0.15 tons CO₂/ton — approaching near-zero steelmaking without hydrogen or CCS infrastructure.
The economics are shifting fast. A new EAF mini-mill costs $300–500M to build. A new blast furnace costs $2–4B. The capital cost gap alone is driving investment decisions — before carbon costs, operational flexibility, or scrap economics are even considered.
02
EAF vs BF-BOF: The Full Comparison
The comparison isn't just about emissions. EAF and BF-BOF differ across every dimension — capital cost, operating cost, raw materials, product range, flexibility, and maintenance requirements. Understanding the trade-offs is essential for investment decisions, operational strategy, and maintenance planning.
Dimension
EAF Route
BF-BOF Route
CO₂ emissions
0.4 t/t steel (scrap) · 0.7 t/t (DRI)
1.8–2.2 t/t steel
Capital cost (greenfield)
$300–500M (1M ton mini-mill)
$2–4B (integrated works)
Primary raw material
Scrap steel, DRI/HBI, pig iron
Iron ore, coking coal
Tap-to-tap time
35–55 minutes
30–45 min (BOF only, excludes BF)
Production flexibility
Start/stop in hours. Idle economically.
Continuous operation required. $1M+/day idle cost.
Product quality range
Expanding — now includes automotive, API pipe
Full range including ultra-low carbon, tinplate
Energy source
Electricity (400–550 kWh/t) + chemical energy
Coking coal + oxygen + electricity
Workforce (per M tons)
250–400 employees
2,000–5,000 employees
Startup from cold
4–8 hours
Days to weeks (BF restart)
Maintenance complexity
Lower — fewer subsystems, no coke ovens/BF
Higher — BF, coke ovens, sinter plant, BOF
03
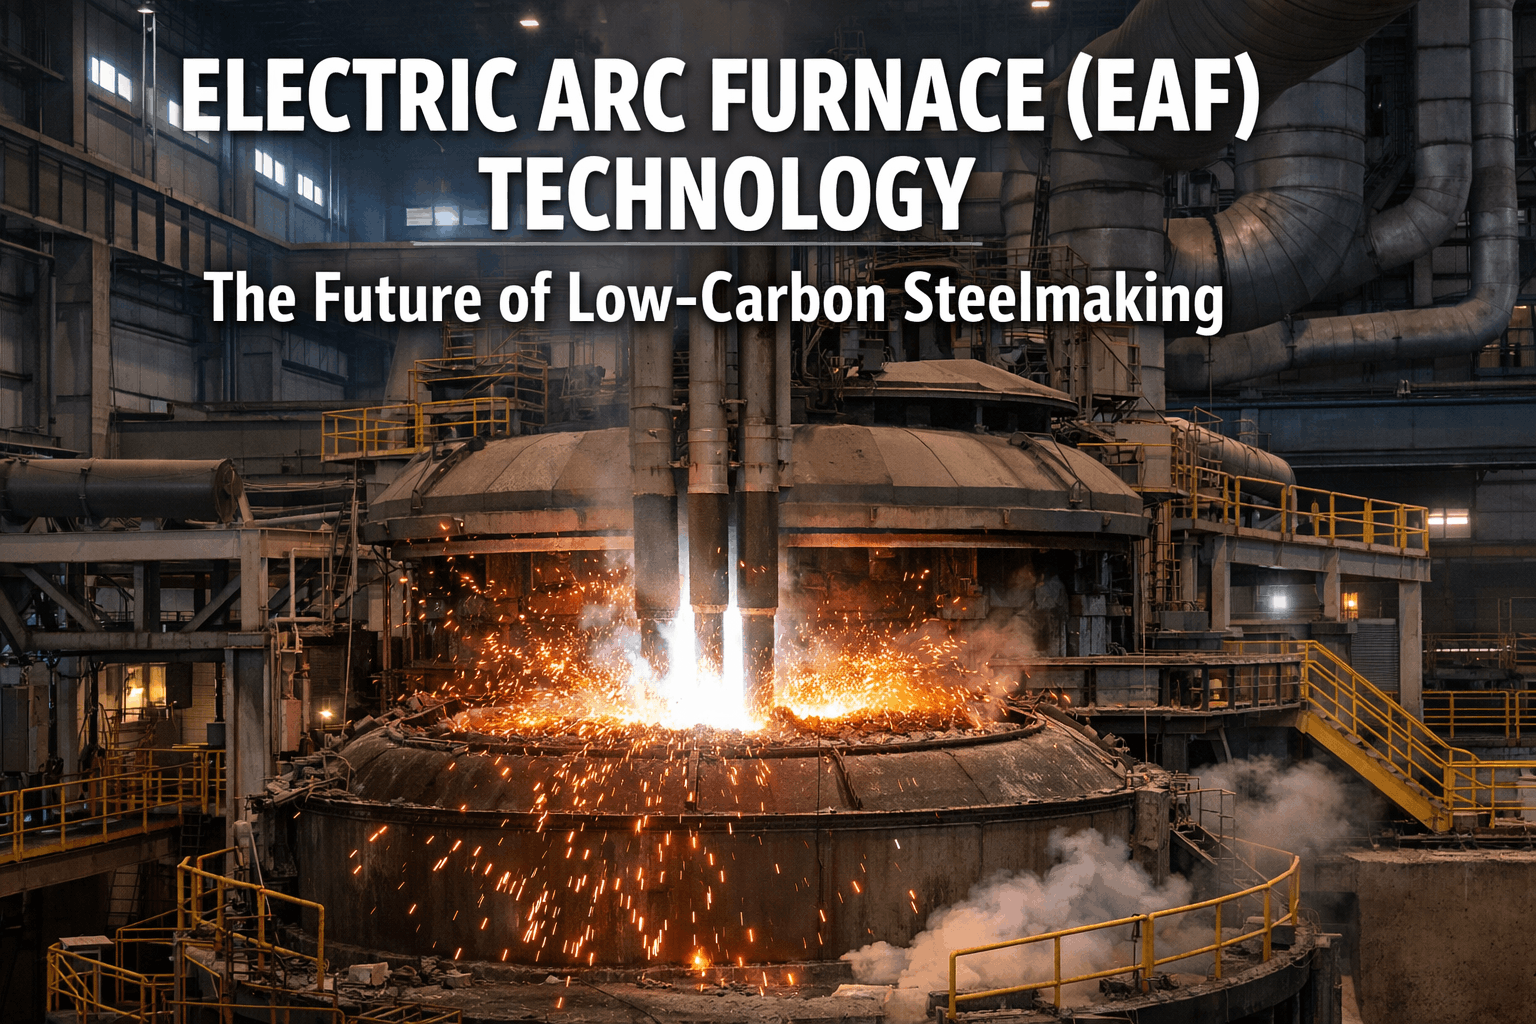
Inside the Modern EAF: Key Components & Maintenance
A modern ultra-high-power EAF is a high-intensity machine — 80–150 MW of electrical power concentrated in a vessel 7–8 meters in diameter, processing 120–200 tons of steel every 35–55 minutes. The thermal and mechanical stresses are extreme, and maintenance requirements are demanding but manageable with the right systems. OXmaint's CMMS platform manages every component listed below across its full lifecycle.
Three graphite electrodes (450–700mm diameter) carrying 50,000–80,000 amps into the furnace. Electrode consumption is the largest operating cost after energy and scrap — $3–5M annually for a 1M ton EAF. Arms, clamps, and regulation systems position electrodes within millimeters of the scrap pile.
Maintenance focus: Electrode joint integrity, arm alignment, current regulation response time, clamp condition, column guide wear. OXmaint tracks consumption rate per heat, breakage events, and joint failure patterns to optimize purchasing and handling procedures.
Water-cooled panels (sidewall) and refractory brick (hearth and EBT area). Sidewall panels handle 80% of thermal load. Hearth refractory determines campaign life — 2,000–5,000 heats between relines depending on practice. A full reline costs $2–4M and takes 7–14 days.
Maintenance focus: Panel leak detection, hearth thermocouple trending, refractory wear rate calculation, EBT condition monitoring. OXmaint's thermal mapping identifies hot spots weeks before breakthrough risk, extending campaigns by 500–1,500 heats.
Water-cooled roof panels, fourth-hole extraction system, ductwork, quench tower, baghouse, and fans processing 600,000–1,200,000 Nm³/hr of off-gas at temperatures up to 1,700°C. Environmental compliance depends on this system — fugitive emissions mean regulatory penalties.
Maintenance focus: Roof panel integrity, duct erosion measurement, baghouse bag condition, fan bearing monitoring, damper actuator health. A single fan bearing failure can halt production for 24–72 hours while creating an environmental exceedance.
80–150 MVA furnace transformer, high-current bus tubes, flexible cables, and power regulation system. The transformer is the single most expensive and longest-lead-time component — $3–8M to replace, 12–18 month lead time. No spare means months of lost production on failure.
Maintenance focus: Dissolved gas analysis trending, tap changer condition, bushing temperature, oil quality.
AI-powered monitoring detects transformer degradation 30–60 days before failure — the longest early warning on any EAF component.
Roof swing mechanism, electrode regulation, furnace tilt, EBT slide gate, charging bucket system, and scrap handling crane. These systems execute 40–60 movements per heat — roof open/close, electrode raise/lower, tilt for tapping — each one a potential failure point under extreme heat and dust conditions.
Maintenance focus: Hydraulic valve response time, cylinder seal condition, pivot bearing wear, slide gate plate life. High cycle count means condition-based scheduling delivers enormous value — extending healthy components while catching degraded ones early.
Oxy-fuel burners, carbon injection, oxygen lancing, and foaming slag control. Chemical energy provides 30–40% of total energy input on modern EAFs, reducing electricity consumption and tap-to-tap time. System degradation silently increases energy cost and cycle time.
Maintenance focus: Burner tip erosion, injector nozzle condition, oxygen lance alignment, foaming slag consistency. OXmaint correlates energy consumption per heat with equipment condition to identify degradation before it impacts costs.
Every EAF Component. One Maintenance Platform.
OXmaint manages electrodes, refractory, transformer, hydraulics, off-gas, and chemical systems from a single dashboard — with AI monitoring that catches degradation weeks before it impacts production.
04
EAF Performance Metrics: What Good Looks Like
EAF performance varies enormously between operations. The gap between average and world-class represents $5–15M per year in cost differences on a 1M ton furnace. Most of the gap traces back to maintenance-driven factors — electrode handling, refractory management, power-on time, and equipment reliability.
Metric
Average
World-Class
Gap Driver
Tap-to-tap time
50–65 min
35–42 min
Charging system reliability, roof swing speed
Power-on time
35–45 min
28–34 min
Transformer capacity, electrode regulation
Electricity consumption
420–500 kWh/t
340–380 kWh/t
Chemical energy optimization, scrap preparation
Electrode consumption
1.8–2.5 kg/t
1.2–1.5 kg/t
Joint failures, breakage, regulation quality
Refractory life
2,000–3,000 heats
4,000–5,500 heats
Slag practice, hot spot management, repair timing
Yield (liquid steel/charge)
88–91%
93–95%
Oxygen practice, slag chemistry, temperature control
Availability
78–84%
91–95%
Unplanned stops from equipment failures
05
The DRI-EAF Pathway: Near-Zero Carbon Steelmaking
The combination of hydrogen-based direct reduction with EAF melting represents the most commercially viable pathway to near-zero carbon steelmaking. Multiple billion-dollar projects are under construction globally — and the maintenance requirements for DRI-EAF operations differ significantly from scrap-based EAF.
Now — 2026
Natural Gas DRI + EAF
CO₂: 0.6–0.8 t/t steel
Proven at scale — Midrex and HYL processes operating 80+ million tons/year globally. EAFs running on DRI require different practice than scrap-based — higher power input, different slag chemistry, and longer tap-to-tap times. Maintenance intensity increases 15–25% versus pure scrap operation.
2026 — 2032
Hydrogen Blend DRI + EAF
CO₂: 0.3–0.5 t/t steel
Natural gas DRI plants retrofit to 30–70% hydrogen blend. SSAB HYBRIT, ArcelorMittal Hamburg, and Salzgitter SALCOS are operating or commissioning. Maintenance teams need new competencies for hydrogen handling, different reductant properties, and modified DRI metallurgy affecting EAF operations.
2030 — 2040
100% Green Hydrogen DRI + EAF
CO₂: 0.05–0.15 t/t steel
Full hydrogen reduction produces H₂O instead of CO₂. Combined with renewable electricity for the EAF, this achieves near-zero steelmaking. The EAF itself doesn't change — but the feed material properties, energy patterns, and production scheduling (linked to renewable availability) create new maintenance challenges that require
intelligent scheduling platforms.
The EAF is the constant in every decarbonization pathway. Whether the feed is scrap, natural gas DRI, or green hydrogen DRI — the melting step is always an electric arc furnace. Investing in EAF operational excellence today builds the foundation for every future pathway.
06
Digital Maintenance for High-Performance EAF Operations
EAF maintenance is different from integrated plant maintenance. Shorter campaigns, faster cycle times, and extreme thermal cycling create a maintenance environment where condition-based scheduling delivers outsized returns. The difference between average and world-class EAF operations — worth $5–15M annually — is primarily a maintenance and operational discipline gap.
01
Refractory Lifecycle Management
Track hearth wear per heat, correlate with slag practice and tapping temperature, predict remaining campaign life, and schedule relines during planned windows — not as emergencies. OXmaint extends average campaign by 800–1,500 heats, worth $1.5–3M per campaign.
02
Transformer Health Monitoring
Continuous dissolved gas analysis, temperature mapping, and tap changer cycle tracking. AI detects degradation 30–60 days before failure on a component with 12–18 month replacement lead time. One prevented transformer failure saves $5–15M in avoided production loss.
03
Electrode Optimization
Track consumption rate, joint failures, breakage events, and column performance per heat. AI correlates electrode performance with furnace practice to reduce consumption 10–15% — worth $300K–$750K annually on electrode costs alone.
04
Off-Gas System Reliability
Fan bearing vibration monitoring, baghouse differential pressure trending, and duct erosion tracking. Environmental system failures create both production stops and regulatory risk — the only failures on this list that carry legal consequences beyond financial.
05
Hydraulic System Condition Monitoring
40–60 hydraulic movements per heat × 20–30 heats/day = 800–1,800 cycles daily. Condition-based maintenance on roof swing, electrode regulation, and tilt systems prevents the mechanical failures that cause 40% of unplanned EAF downtime.
$3.2M
Extended refractory campaigns + fewer relines
$2.8M
Eliminated unplanned downtime (42% reduction)
$1.5M
Reduced electrode consumption and breakage
$800K
Energy optimization from equipment condition
Total Annual Value
$8.3M
Investment: $250K–$500K · Payback: 1–2 months
Build Your EAF Maintenance Foundation for the Decarbonized Future
Whether you're running scrap today or transitioning to DRI tomorrow, OXmaint manages every EAF component with condition-based scheduling, AI health monitoring, and automated work orders that keep your furnace at world-class performance.
EAF technology is the steelmaking platform of the future — and digital maintenance is what separates high-performing EAF operations from average ones. Learn how OXmaint's integrated CMMS manages EAF operations end-to-end, how AI failure detection catches transformer and bearing degradation weeks early, how real-time OEE monitoring tracks EAF availability and performance per heat, how continuous caster AI scheduling optimizes downstream of the EAF, and how surface defect inspection catches quality issues originating from EAF practice.
The Future of Steel Is Electric. The Future of EAF Maintenance Is Digital.
OXmaint is the maintenance platform built for EAF operations — managing refractory, transformer, electrodes, hydraulics, and off-gas with the AI-driven intelligence that world-class EAF performance requires.
Frequently Asked Questions
Can EAFs produce the same product quality as BF-BOF steel?
For most products, yes. Modern EAFs with DRI feed produce automotive-grade, API pipe-grade, and structural steel that meets identical specifications. The remaining gap is in ultra-low carbon grades (tinplate, some electrical steels) where residual copper and tin in scrap limit quality. DRI-based EAF largely closes this gap.
How does EAF maintenance differ from blast furnace maintenance?
EAF maintenance is shorter-cycle and higher-frequency. Refractory campaigns are 2,000–5,000 heats (months) versus 15–20 years for a blast furnace. Electrode management is continuous. Hydraulic systems cycle 800–1,800 times daily. The intensity is higher, but the complexity per system is lower — fewer subsystems with more predictable failure patterns.
What's the realistic timeline for hydrogen-based EAF steelmaking at scale?
Pilot and demonstration plants are operating now (HYBRIT, H2 Green Steel). Commercial-scale hydrogen DRI-EAF production (1M+ tons/year per site) is expected by 2028–2032. Full industry transition is a 2035–2045 trajectory, limited more by green hydrogen production scale and cost than by EAF technology readiness.
How does OXmaint handle the unique maintenance requirements of DRI-fed EAFs?
DRI-fed EAFs have higher energy intensity, different slag chemistry, and longer tap-to-tap times that stress components differently than scrap operations. OXmaint's AI models adapt to DRI-specific wear patterns — higher refractory wear in slag line areas, different electrode consumption profiles, and adjusted hydraulic cycling patterns.
What ROI should an EAF operation expect from digital maintenance management?
EAF operations typically see $6–10M annual savings per million tons from extended refractory campaigns, eliminated unplanned stops, reduced electrode consumption, and energy optimization. Payback is 1–3 months — driven by the high frequency of maintenance events and the direct cost impact of every hour of EAF downtime.