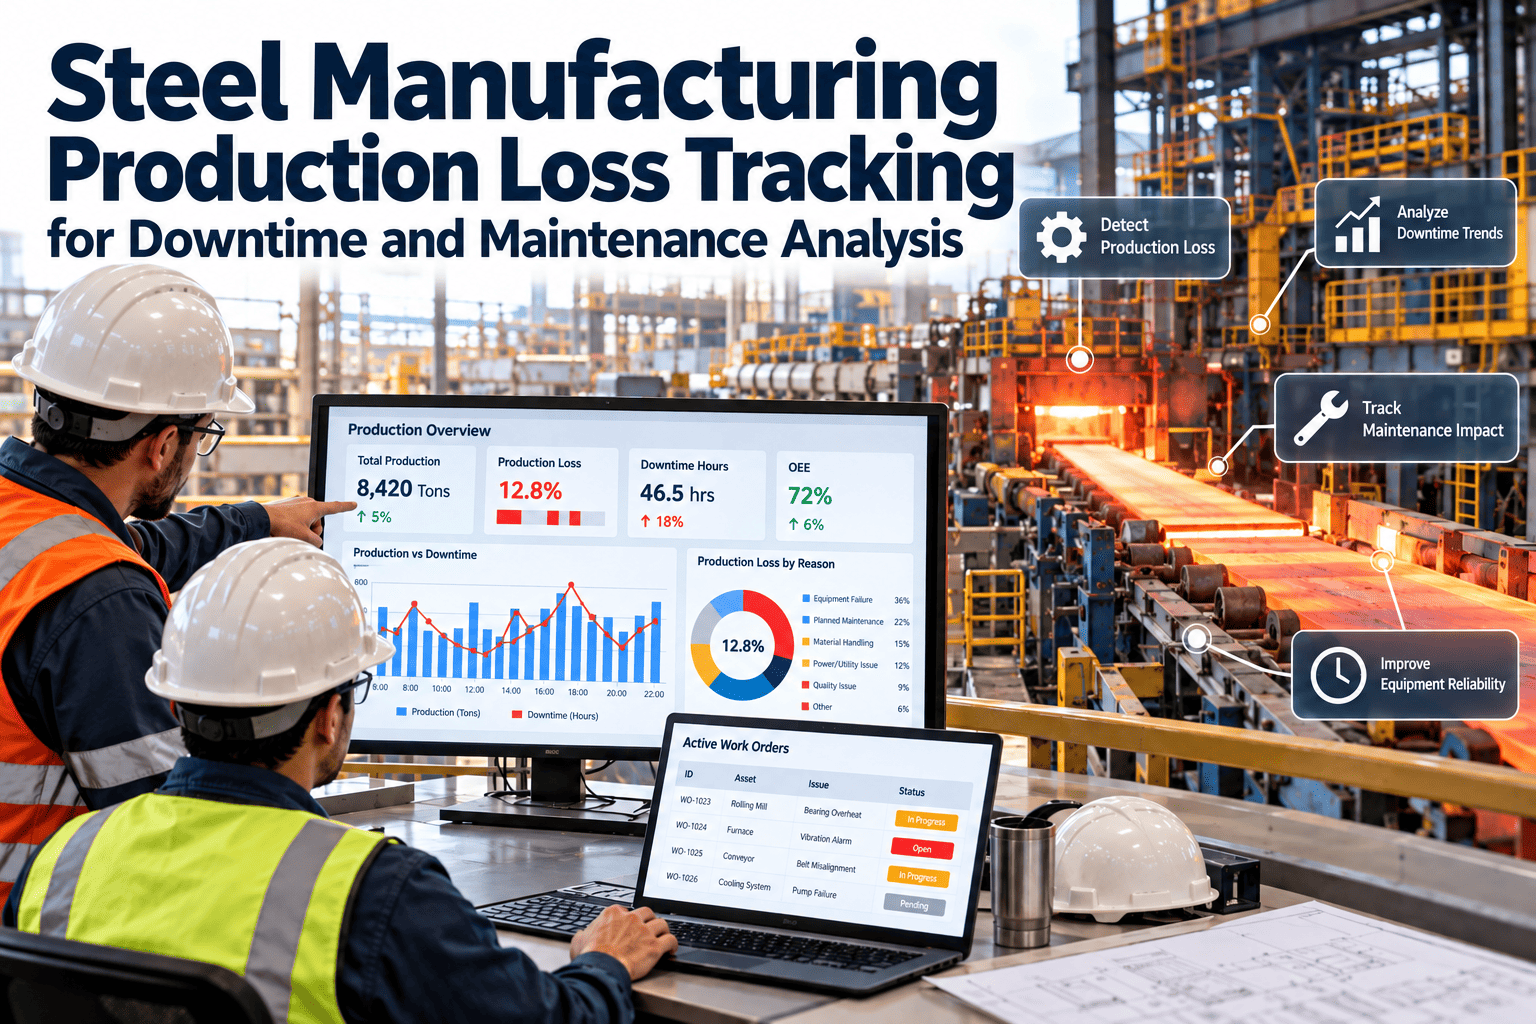
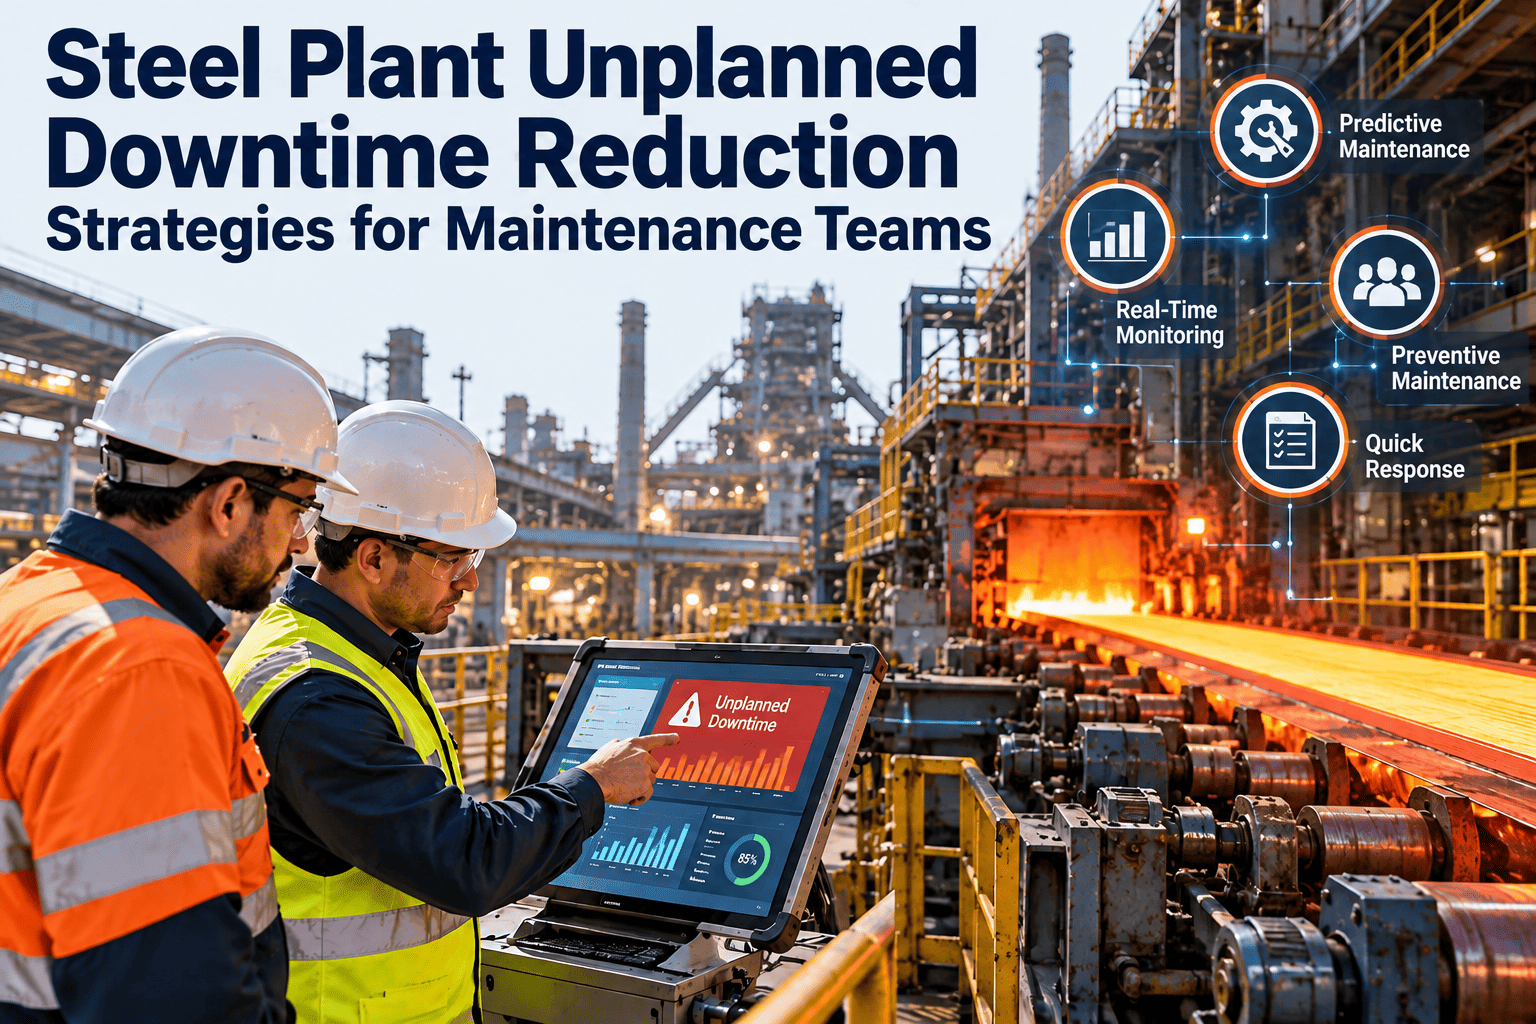
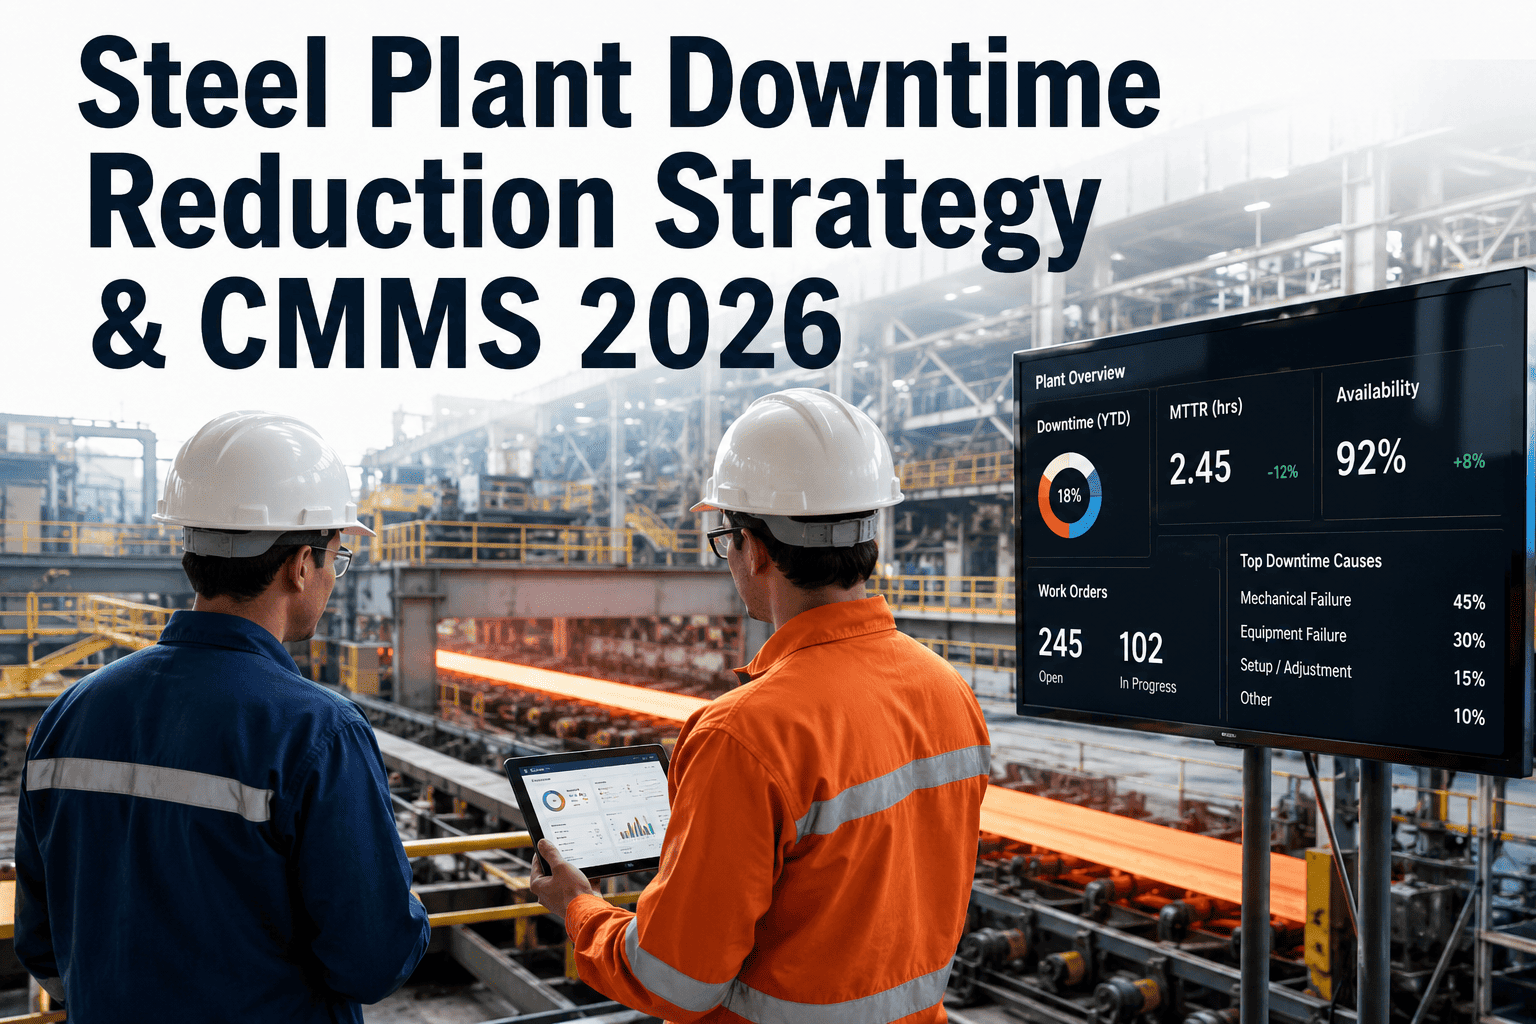
Your equipment can only produce value when it's running. Yet for most manufacturers, equipment sits idle 10-20% of scheduled production time—and every minute of downtime is a minute of lost output, lost revenue, and lost opportunity. Availability, the first pillar of OEE, measures the percentage of planned production time that equipment actually runs. Improving Availability often delivers the fastest, most visible OEE gains because the problem is tangible: the machine is stopped. Modern OEE tracking systems make downtime visible in real-time, enabling rapid response and systematic reduction.
This guide explains exactly what Availability measures, what causes Availability losses, and provides proven strategies to reduce downtime and increase the time your equipment spends producing.
Availability Defined
The percentage of planned production time that equipment is actually running
Example Calculation
The Two Types of Availability Loss
Availability losses fall into two categories from the Six Big Losses framework. Understanding the distinction helps you target improvement efforts correctly. Talk to our OEE experts about analyzing your availability losses.
Unplanned Stops
Typically 60-70% of availability lossEquipment scheduled to run but stopped due to unexpected events. These are the most disruptive and costly stops because they happen without warning.
Common Causes
Planned Stops
Typically 30-40% of availability lossEquipment not running due to planned events during scheduled production time. While necessary, these stops still represent time that could theoretically produce output.
Common Causes
See Every Minute of Downtime
Oxmaint automatically tracks all downtime—planned and unplanned—with reason codes, timestamps, and duration. Know exactly where your Availability is lost and prioritize improvement.
Availability Benchmarks
Where does your Availability stand? These benchmarks help you assess performance and set realistic improvement targets.
Context Matters
Strategies to Reduce Unplanned Downtime
Unplanned stops are the biggest enemy of Availability—and the biggest opportunity. These strategies systematically reduce unexpected equipment failures and stoppages. Oxmaint helps you implement these strategies with integrated CMMS and OEE tracking.
Implement Preventive Maintenance (PM)
Schedule maintenance based on time or usage intervals before failures occur. The goal: fix it before it breaks.
Move to Predictive Maintenance (PdM)
Use condition monitoring (vibration, temperature, oil analysis) to predict failures before they happen and maintain only when needed.
Enable Autonomous Maintenance
Train operators to perform basic maintenance tasks—cleaning, inspection, lubrication, tightening—as part of their daily routine.
Manage Critical Spare Parts
Ensure parts needed for quick repairs are available on-site. Nothing extends downtime like waiting for parts.
Conduct Root Cause Analysis (RCA)
Don't just fix failures—understand why they happened. Eliminate root causes to prevent recurrence.
Strategies to Reduce Planned Downtime
Planned stops are necessary but not fixed. These strategies minimize the time equipment spends on changeovers, setup, and scheduled maintenance. Schedule a consultation to develop a changeover reduction plan.
SMED: Single-Minute Exchange of Die
The gold standard for changeover reduction. SMED systematically converts setup time from hours to minutes.
Document Current State
Video the changeover. List every task, who does it, and how long it takes. This creates your baseline.
Separate Internal vs External
Internal: Must be done while machine is stopped. External: Can be done while machine is still running. Identify which is which.
Convert Internal to External
Move as many tasks as possible to external. Pre-stage tools, pre-heat molds, prepare materials—all while current job runs.
Streamline Remaining Internal
Simplify tasks that must remain internal. Use quick-release clamps, eliminate adjustments, parallelize tasks with multiple operators.
Standardize & Sustain
Document the improved process. Create checklists. Train all operators. Audit compliance. Continuously improve.
Typical SMED Results
Additional Planned Downtime Strategies
Optimize PM Scheduling
Schedule preventive maintenance during non-production time—between shifts, weekends, planned shutdowns. Every PM done during production time steals Availability.
Batch Similar Products
Schedule production to group similar products together, minimizing changeovers. Run all blue products, then all red, instead of alternating colors.
Dedicate Changeover Teams
Have trained specialists ready to swarm changeovers rather than relying on operators to do everything. Parallel tasks cut total time.
Automate Changeovers
Where possible, use automated recipe downloads, motorized adjustments, and quick-change tooling to remove manual steps entirely.
Measuring and Tracking Availability
Improvement requires measurement. These practices ensure your Availability data is accurate and actionable.
Capture All Downtime Events
Every stop matters. Set thresholds appropriately—if 2-minute stops are significant, track them. Automated data collection ensures nothing is missed.
Use Meaningful Reason Codes
Keep codes simple enough that operators use them consistently, but specific enough to drive action. 10-15 codes typically optimal—not 100.
Separate Planned vs Unplanned
Track changeovers separate from breakdowns. The causes and solutions are completely different—lumping them together hides insights.
Pareto Your Losses
Rank downtime reasons by total time lost. The top 3-5 causes typically account for 60-80% of losses. Attack those first.
Trend Over Time
Track Availability weekly/monthly to see improvement trajectory. A single day's data is noise—trends reveal true performance.
Review Daily
Daily review of significant downtime events keeps problems visible and drives accountability. Yesterday's breakdown becomes today's improvement project.
Start Improving Availability Today
Oxmaint provides automated downtime tracking, reason code analysis, and Pareto reports that show exactly where to focus your improvement efforts.
Frequently Asked Questions
Should breaks and lunches count as Availability loss?
Most companies exclude breaks and lunches from Planned Production Time entirely—they're not OEE losses because there's no intention to produce during that time. However, if your operation could theoretically run through breaks (with relief operators) and you're not doing so, you could include them as losses to surface that opportunity. The key is consistency: pick an approach and apply it uniformly.
Should changeover time count against OEE?
Yes—changeover time is an Availability loss. While changeovers are necessary, they're also improvable. SMED typically reduces changeover time by 50-75%. Excluding changeovers from OEE would hide this significant improvement opportunity. Include them in Availability, track them separately from unplanned downtime, and work to reduce them.
What's a good threshold between "downtime event" and "minor stop"?
A common threshold is 2-5 minutes. Stops longer than the threshold are downtime events (Availability loss) requiring reason codes. Shorter stops are minor stoppages (Performance loss) captured through cycle time analysis. The right threshold depends on your operation—set it where you can practically track reason codes without overwhelming operators.
How quickly can I expect Availability improvement from these strategies?
Timeline varies by strategy: SMED typically shows results in 4-8 weeks. Preventive maintenance programs take 3-6 months to show significant breakdown reduction. Predictive maintenance may take 6-12 months to fully implement. Root cause analysis on chronic problems can show results within weeks. Most manufacturers see 5-10% Availability improvement in the first year of focused effort.
If I have limited resources, should I focus on unplanned or planned downtime first?
Start with unplanned downtime if your breakdowns are frequent and unpredictable—these cause the most disruption to scheduling and often indicate deeper reliability issues. Start with planned downtime (SMED) if your changeovers are long and frequent but equipment is relatively reliable. Look at your Pareto: attack whatever causes the most total lost time first.