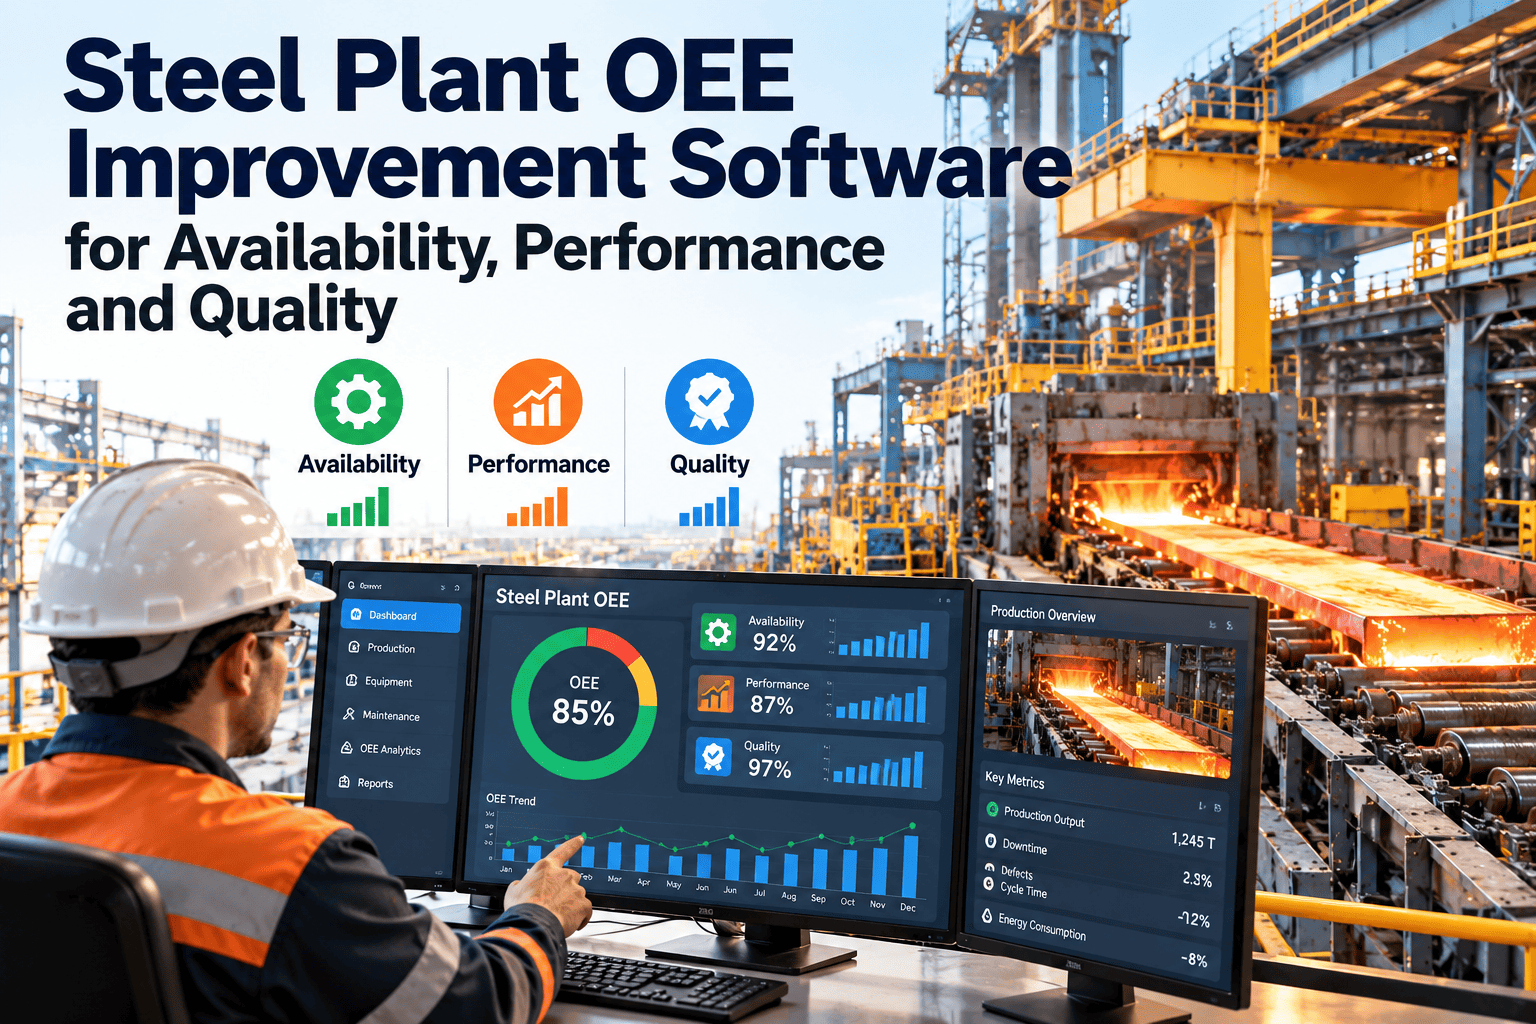
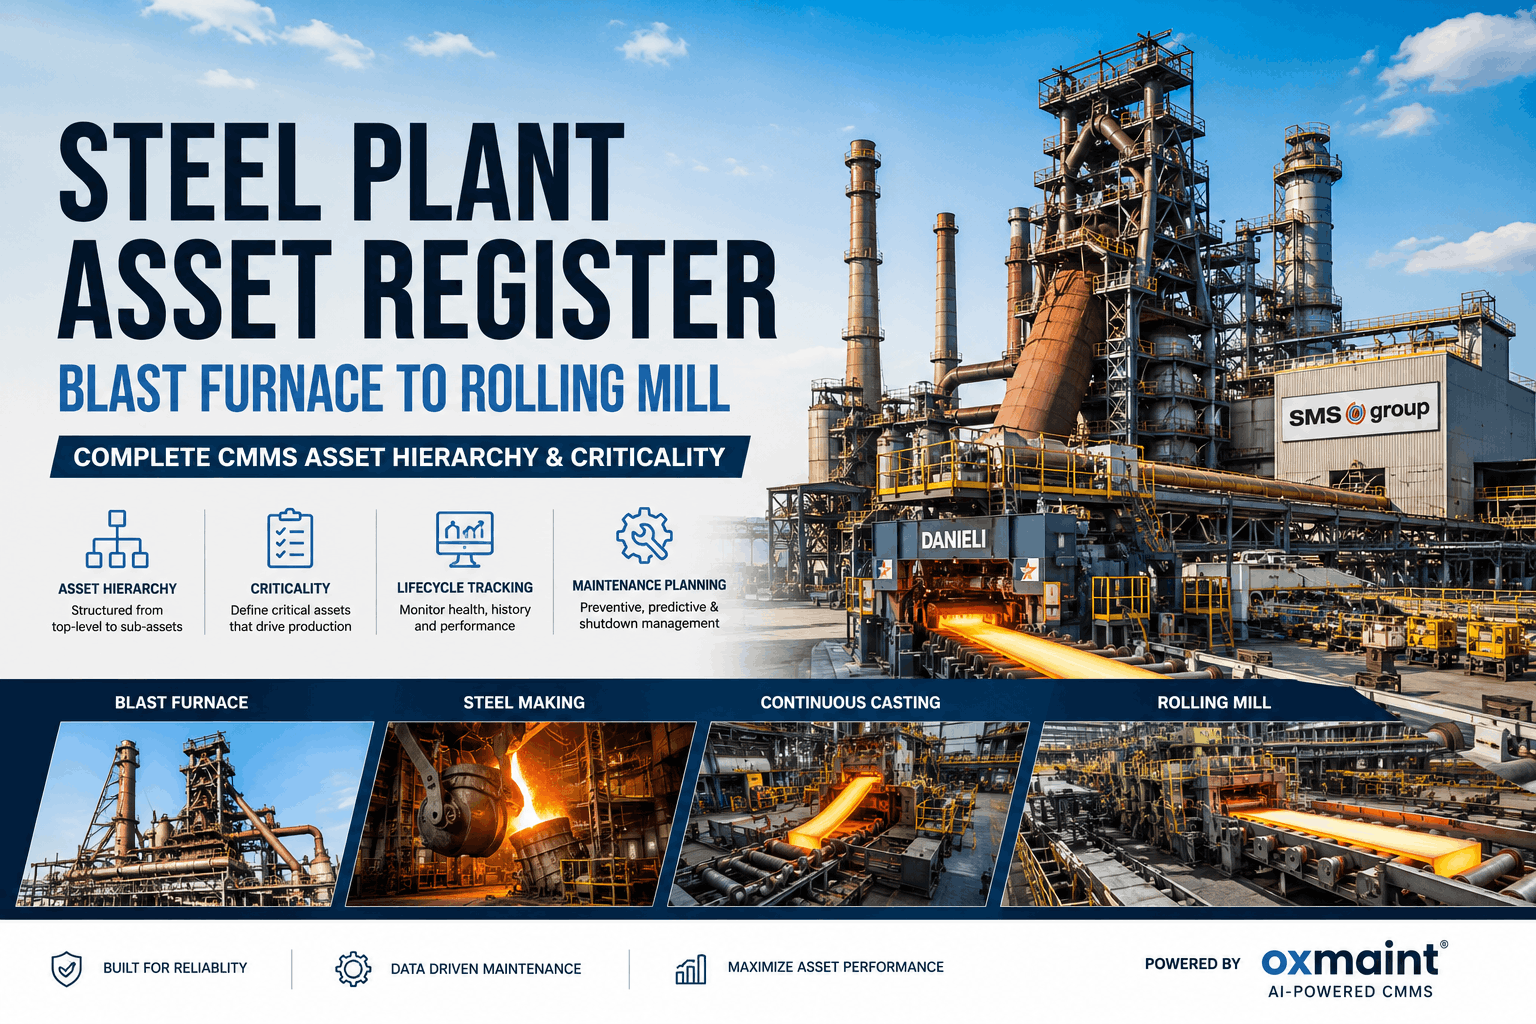
Steel manufacturing operates at extreme temperatures, crushing forces, and relentless production schedules where a single furnace breakdown can cost $50,000 per hour. In this unforgiving environment, OEE (Overall Equipment Effectiveness) isn't just a performance metric—it's the difference between profit and loss, between competitive advantage and obsolescence.
Steel plants face unique challenges that make OEE tracking both critical and complex: equipment that runs 24/7/365, processes measured in hours not minutes, quality issues that appear downstream from their source, and maintenance windows that require days of planning. Yet the plants that master OEE measurement consistently outperform competitors by 15-25% on throughput and profitability.
The Steel Plant Challenge
OEE Impact in Steel
Why Steel Manufacturing Needs Specialized OEE Tracking
Generic OEE systems designed for discrete manufacturing fall apart in steel plants. Continuous processes, thermal inertia, multi-stage dependencies, and quality issues with 30-minute lag times require purpose-built approaches.
Continuous Process Complexity
Unlike discrete manufacturing where each unit is independent, steel processes are interconnected. A furnace feeds casting, which feeds rolling, which feeds finishing. A bottleneck anywhere cascades through the entire line. OEE must account for constraint management and flow optimization, not just individual equipment efficiency.
Extreme Operating Conditions
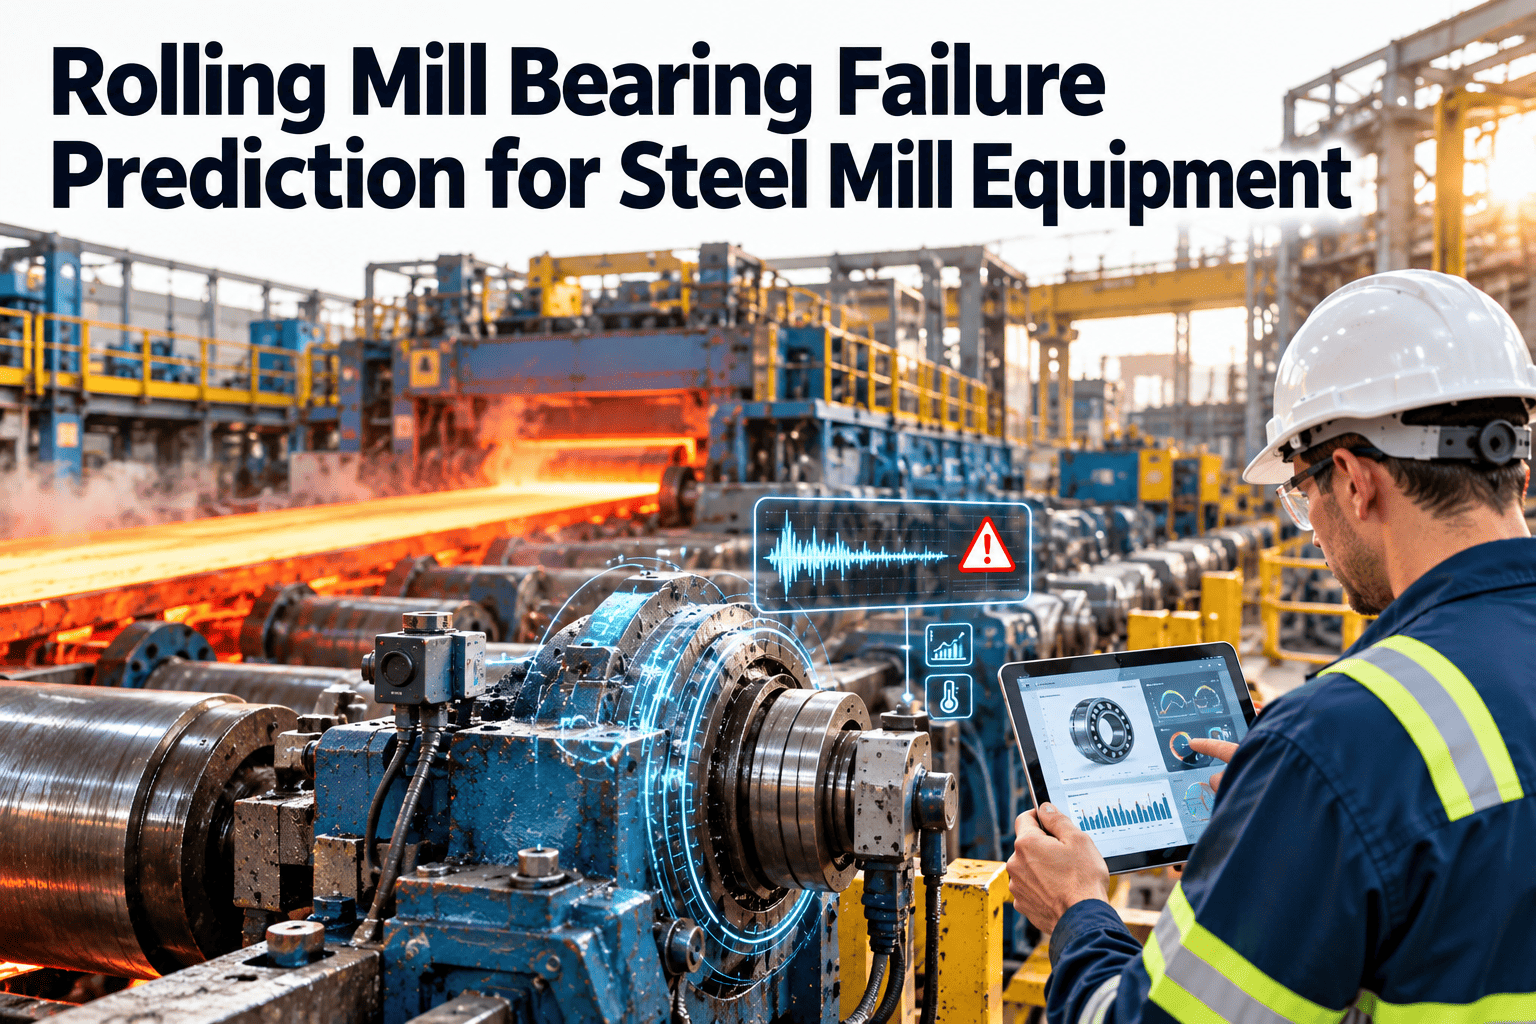
Equipment operates under thermal, mechanical, and chemical stresses that accelerate degradation. Predictive maintenance based on OEE performance trends prevents catastrophic failures that could idle entire facilities for weeks. Automated tracking systems catch performance deterioration before breakdown occurs.
Material Quality Variability
Input material chemistry, temperature, and physical properties vary batch-to-batch. OEE systems must distinguish between losses from controllable factors (equipment settings, operator actions) versus uncontrollable variation (raw material quality) to focus improvement efforts correctly.
Campaign-Based Production
Steel plants often run extended campaigns of similar grades to minimize changeovers. OEE tracking must accommodate multi-day production runs, planned transition periods, and the reality that stopping a furnace for minor issues costs more than running slightly degraded.
OEE Calculation for Steel: The Three Components
The fundamental OEE formula remains Availability × Performance × Quality, but application in steel requires industry-specific adjustments to accurately reflect operational reality.
Availability in Steel
Steel-Specific Considerations:
Planned downtime exclusions: Scheduled relining, deskulling, major maintenance campaigns
Thermal stabilization: Heat-up and cool-down periods treated separately from production losses
Changeover complexity: Grade changes requiring temperature/chemistry adjustments tracked distinctly
Performance in Steel
Steel-Specific Considerations:
Tonnage vs cycles: Measure tons/hour not units/hour; adjust for product density variations
Speed losses: Running below design capacity due to refractory wear, equipment degradation
Micro-stops: Brief interruptions for slag removal, adjustment, sampling often invisible in daily reports
Quality in Steel
Steel-Specific Considerations:
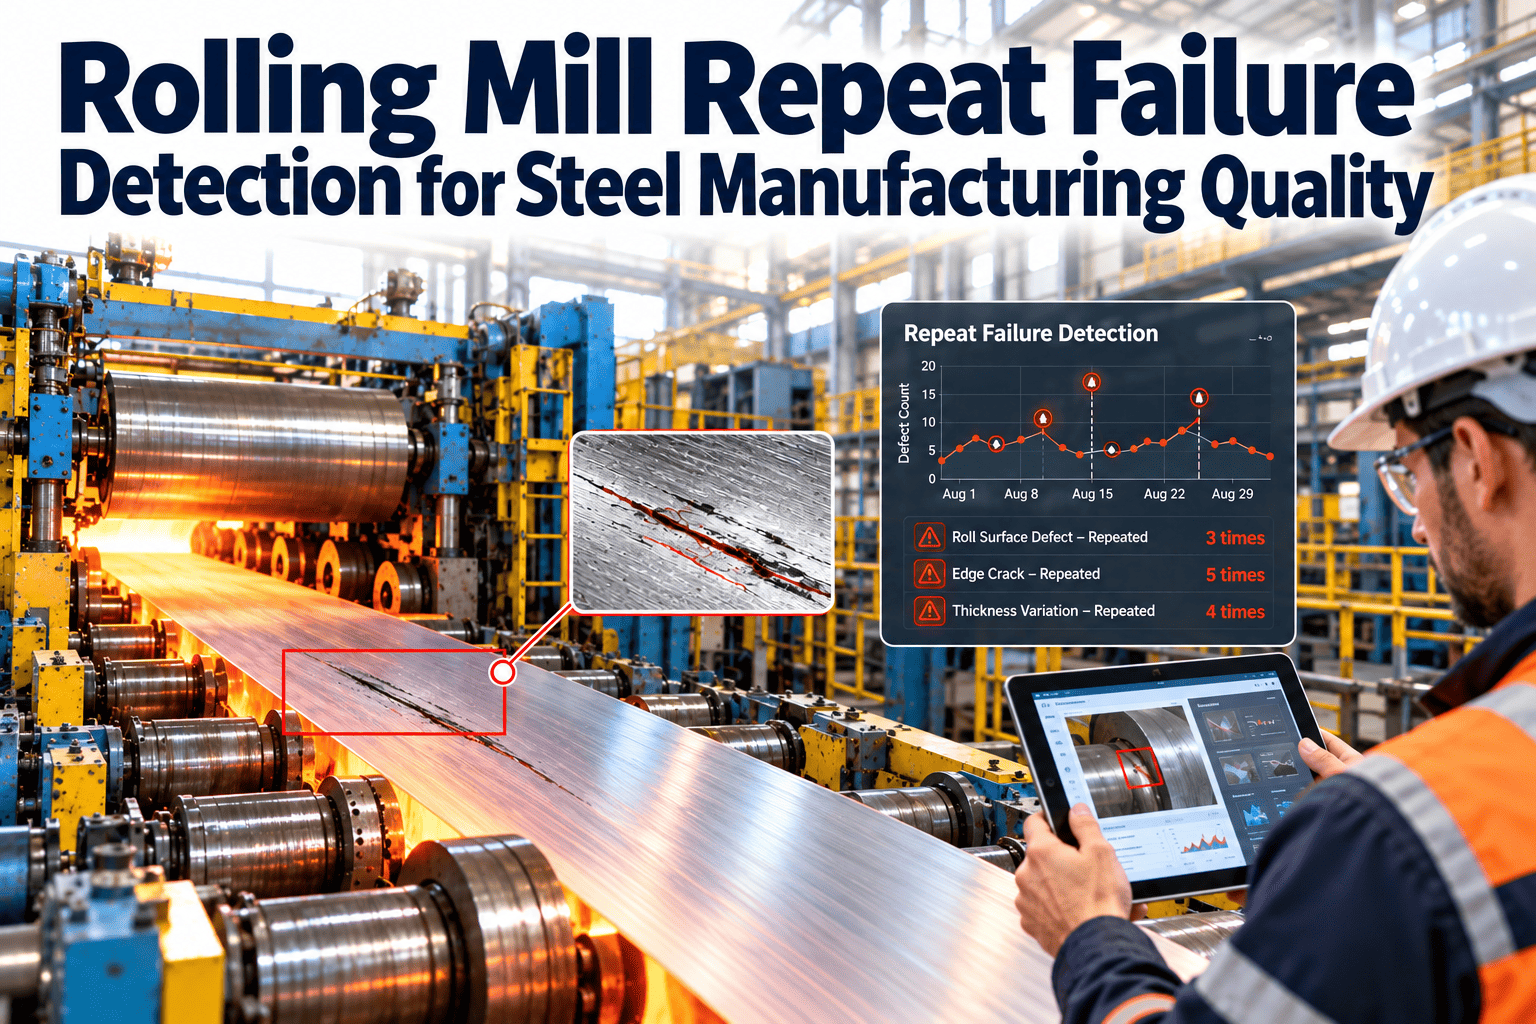
Delayed detection: Surface defects often found downstream; attribute losses to originating process
Downgrading: Product sold at lower price due to specification misses counts as quality loss
Scrap recycling: Internal scrap remelted doesn't eliminate the production time/energy loss
Critical Loss Categories in Steel Production
Steel plants lose productive capacity through specific, measurable mechanisms. Identifying and quantifying these losses directs improvement resources to highest-impact areas.
Availability Losses
Performance Losses
Quality Losses
Identify Your Hidden Production Losses
Discover where your steel operation is bleeding capacity with comprehensive OEE tracking designed for heavy industry.
Technology Infrastructure for Steel OEE
Accurate OEE measurement in steel requires robust data collection from harsh environments and intelligent systems that distinguish signal from noise in complex processes.
Data Collection & Sensors
Pyrometers, thermocouples tracking furnace, ladle, mold temperatures. Deviations indicate efficiency losses or impending quality issues.
Load cells, scale systems providing real-time throughput data. Integration with MES validates production counts.
PLC integration capturing run/stop states, alarm conditions, cycle completions for availability calculation.
Online inspection (cameras, ultrasonic), lab results integration identifying defects and attributing to source.
Data Processing & Analytics
Automated computation of availability, performance, quality every 5-15 minutes with trending and alerting.
AI-assisted classification of downtime events, speed losses, quality excursions with root cause suggestions.
Statistical analysis linking upstream conditions to downstream quality, enabling predictive intervention.
Performance degradation patterns trigger inspection before failure. Prevents 60-75% of unplanned stops.
Visualization & Action
Floor displays showing current OEE, equipment status, active alerts visible to operators and supervision.
Plant managers monitor performance remotely, receive critical alerts regardless of location.
Automated shift reports, trend analysis, benchmarking across lines/shifts for continuous improvement targeting.
OEE insights trigger work orders, inform maintenance scheduling, validate repair effectiveness post-completion.
Implementation Roadmap for Steel Plants
Rolling out OEE systems in steel requires phased approach balancing quick wins with long-term capability building. Most successful implementations follow this proven path.
Assessment & Baseline
Pilot System Deployment
Optimization & Scale
Continuous Improvement
Measurable Results: Steel OEE Success Stories
Steel plants implementing comprehensive OEE systems report consistent, substantial improvements that flow directly to bottom-line profitability.
Frequently Asked Questions
What's a realistic OEE target for steel production?
World-class steel operations achieve 75-85% OEE depending on process type. Integrated mills typically target 70-78%, mini-mills 75-82%, specialty producers 65-75% due to frequent changeovers. Starting from 55-65% is common; focus on 5-point improvement per year.
How do we handle scheduled relining in OEE calculations?
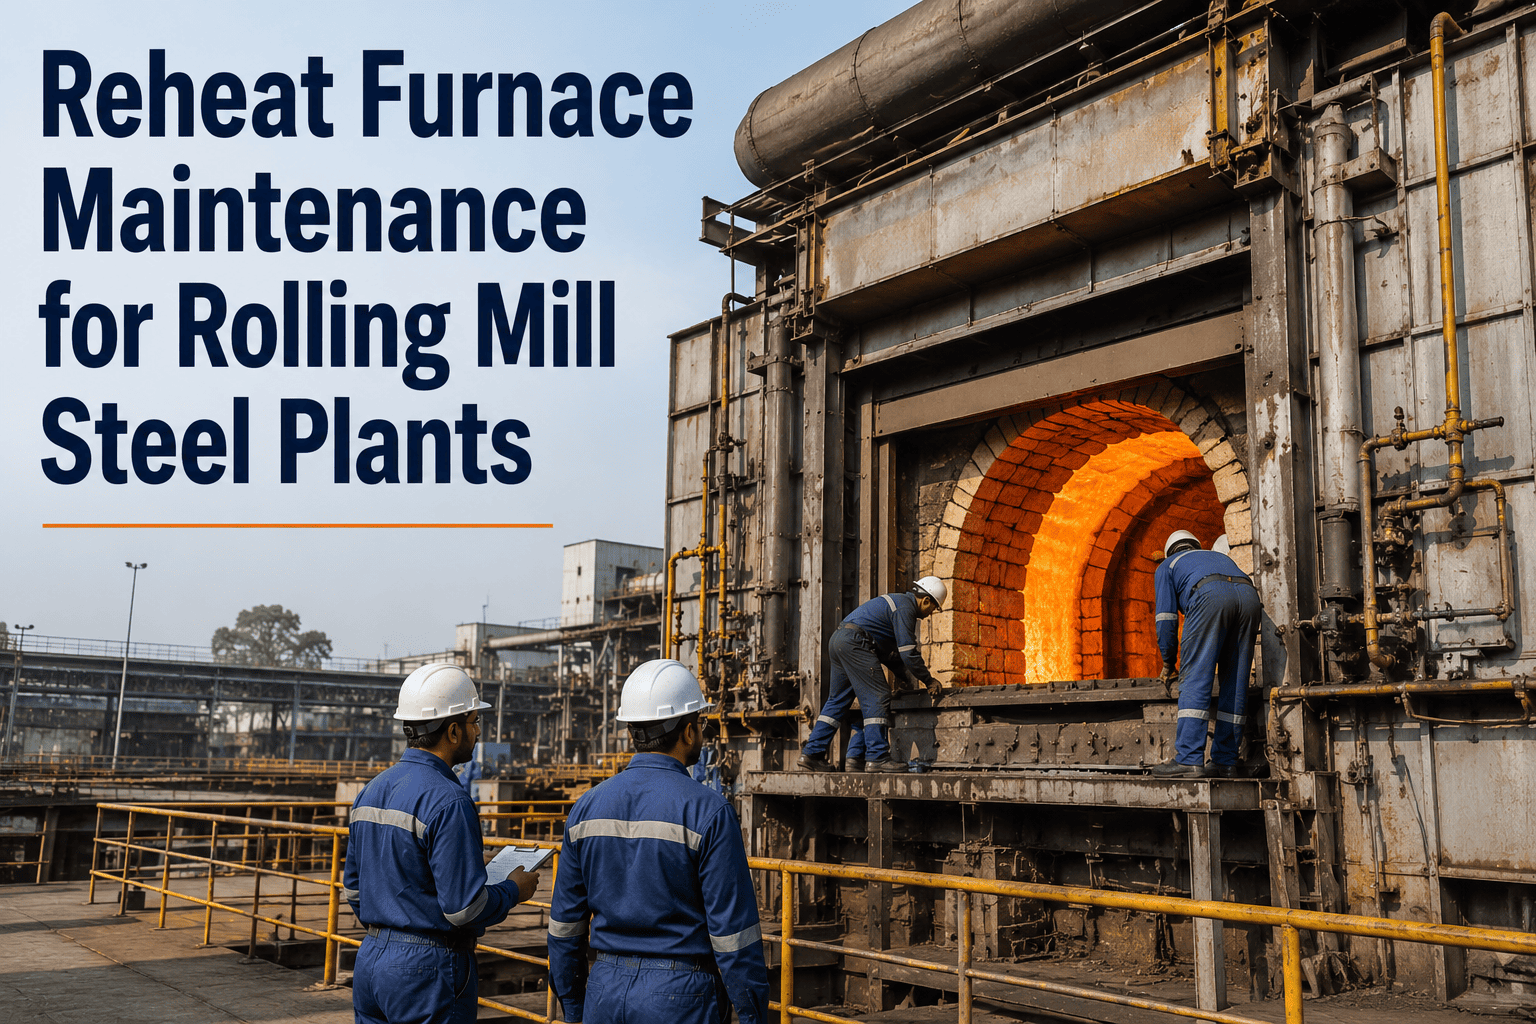
Scheduled maintenance including relining is excluded from planned production time. However, if relining occurs earlier than scheduled due to premature wear, the lost production between scheduled and actual reline dates counts as availability loss, highlighting maintenance optimization opportunities.
Can OEE tracking work without full automation?
Yes, though accuracy and timeliness suffer. Start with manual operator logging supplemented by available automated data (scale systems, lab results). Hybrid approaches using low-cost sensors for equipment state and manual entry for causes work well during early phases before full automation investment.
How do we attribute quality defects found downstream to source equipment?
Implement defect traceability linking each coil/billet to production timestamp and operating conditions. When defects appear in finishing, trace back to originating heat/cast and charge quality loss to that process. Advanced systems use statistical correlation to predict quality from upstream sensor data.
What's the typical implementation timeline for a full steel plant?
Pilot line implementation takes 10-16 weeks. Plant-wide rollout adds 12-20 weeks depending on number of lines and existing infrastructure. Total program from kickoff to full deployment typically spans 6-9 months, with measurable OEE improvements visible within first 8-12 weeks on pilot equipment.
Transform Your Steel Operation's Performance
Stop losing millions to hidden inefficiencies. Oxmaint's OEE tracking gives steel manufacturers the visibility and insights to maximize equipment effectiveness and profitability.