Your OEE score tells you 65%—but 65% of what? Where did the other 35% go? Without a systematic way to decompose that loss, you're guessing at improvements. The OEE Loss Tree provides a structured framework for breaking down total production loss into increasingly specific categories, revealing exactly where time and output disappear. Modern OEE tracking systems automate this analysis, turning raw data into actionable improvement priorities.
The Loss Tree—rooted in Total Productive Maintenance (TPM) and the Six Big Losses framework—transforms OEE from a single number into a diagnostic tool. This guide explains how to build and use a Loss Tree to identify, prioritize, and systematically eliminate the losses that drain your manufacturing productivity.
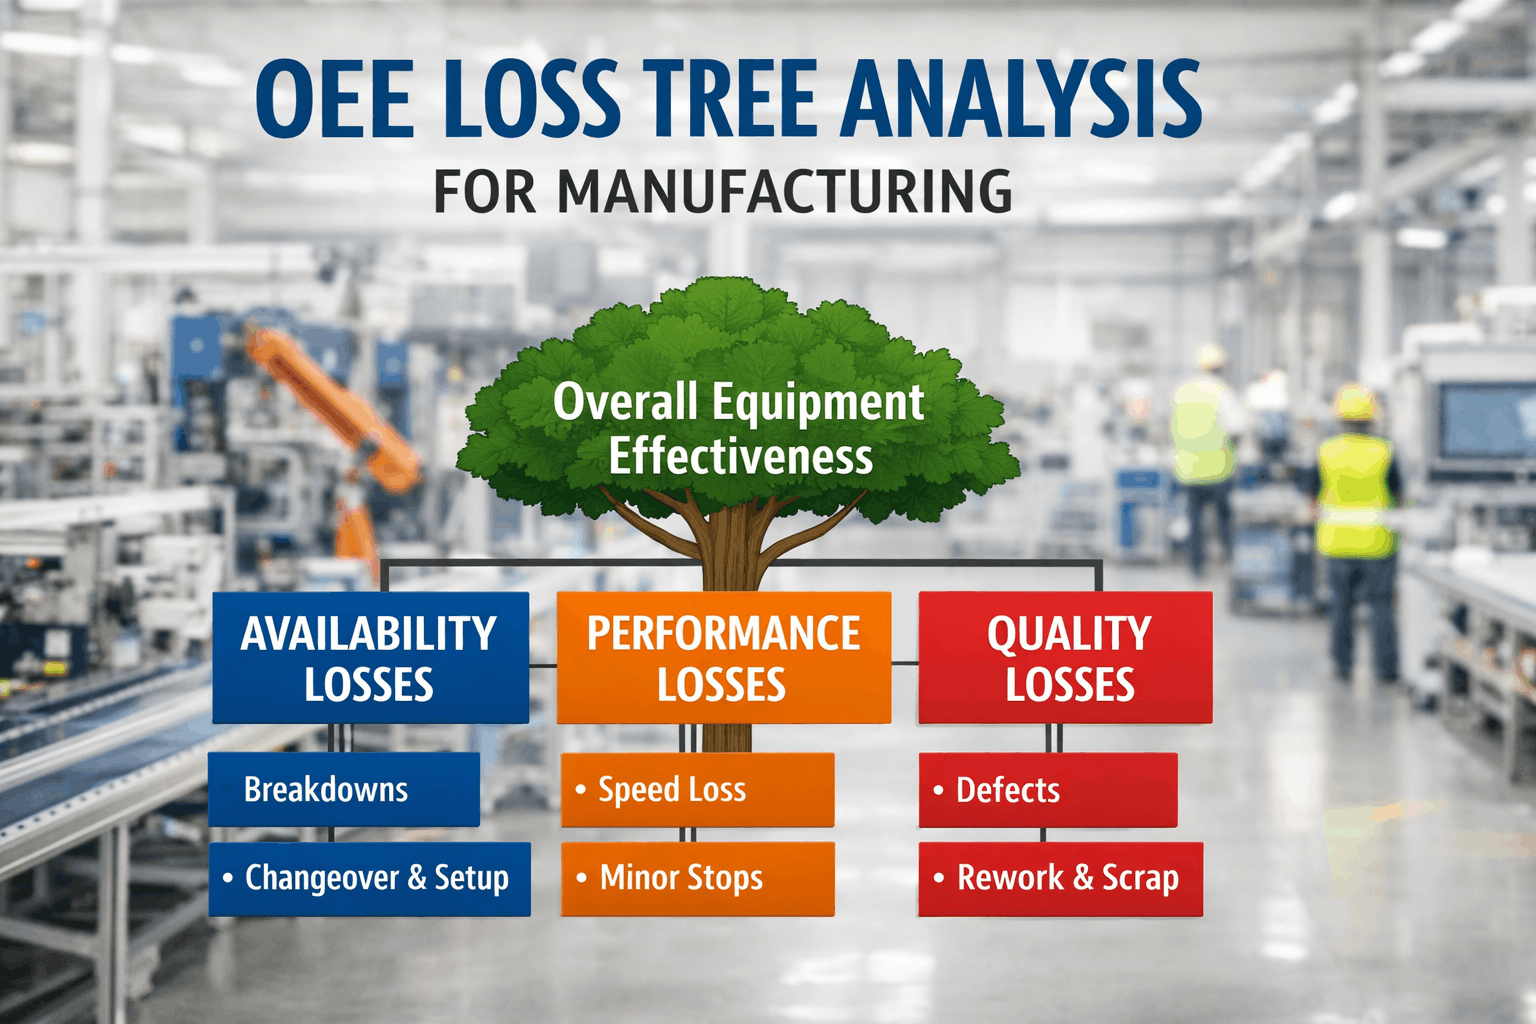
The OEE Loss Tree Structure
The Six Big Losses Explained
The Six Big Losses framework categorizes all equipment-based productivity losses into six distinct types, each aligned with one of the three OEE factors. Understanding these categories is the foundation of effective loss analysis. Talk to our OEE experts about implementing loss tracking in your operation.
Availability Losses
Equipment not running when scheduledUnplanned Stops (Breakdowns)
Equipment scheduled to run but not running due to unexpected events—equipment failures, tool breakage, unplanned maintenance, lack of operators or materials.
Planned Stops (Changeovers/Setup)
Equipment not running due to planned events during scheduled production time—changeovers, tooling adjustments, cleaning, planned maintenance, quality inspections.
Performance Losses
Equipment running but not at maximum speedSmall Stops (Minor Stoppages)
Brief stoppages—typically under 5 minutes—that interrupt production but often aren't tracked. They accumulate silently into significant lost time.
Slow Cycles (Reduced Speed)
Equipment running continuously but at less than maximum designed speed. Cycle time is longer than ideal without actual stops occurring.
Quality Losses
Equipment running but producing defectsProduction Rejects (Defects)
Defective parts produced during stable, steady-state production. Includes parts requiring rework since OEE measures first-pass yield.
Startup Rejects (Reduced Yield)
Defective parts produced from startup until stable production is reached. Most common after changeovers or equipment restarts.
Automate Your Loss Analysis
Oxmaint automatically categorizes losses into the Six Big Losses framework, generating Loss Trees and Pareto charts that show exactly where to focus improvement efforts.
The Waterfall Chart: Visualizing Losses
A waterfall chart (also called a bridge chart) is the most effective way to visualize how losses accumulate to reduce OEE. It shows the flow from planned production time down to fully productive time.
Building Your Loss Tree: Step by Step
A complete Loss Tree drills down from high-level categories to specific, actionable causes. Here's how to build one for your operation. Oxmaint's platform generates these automatically from your production data.
Start with OEE Factors
Begin with the three OEE factors: Availability, Performance, Quality. Calculate how much each contributes to your total OEE loss.
Availability loss = 12%, Performance loss = 11%, Quality loss = 6%
Break Down to Six Big Losses
Split each OEE factor into its two constituent losses. This reveals whether you're losing more to breakdowns vs. changeovers, small stops vs. slow cycles, etc.
Performance loss (11%) = Small stops (6%) + Slow cycles (5%)
Categorize by Cause Type
Within each loss, create categories relevant to your operation. For breakdowns: mechanical, electrical, pneumatic. For changeovers: product change, tool change, material change.
Identify Specific Items
At the deepest level, identify specific equipment, components, or situations. This is where action happens—you can't fix "mechanical failures" but you can fix "bearing failures on Line 3."
Complete Loss Tree Example
Here's a fully developed Loss Tree for a packaging line, showing how high-level OEE losses decompose to specific, actionable items.
Pareto Analysis: Prioritizing Losses
Once you've built your Loss Tree, Pareto analysis identifies which losses to attack first. The 80/20 rule typically applies: 80% of losses come from 20% of causes. Schedule a consultation to learn how to prioritize your improvement efforts.
Pareto Insight
The top 3 losses (filler jams, filler speed, bottle misfeeds) account for 31% of total loss—nearly one-third of all OEE loss from just three causes. Solving these delivers maximum impact with focused effort.
Using PDCA to Address Losses
Once you've identified priority losses, the PDCA (Plan-Do-Check-Act) cycle provides a structured approach to elimination.
Plan
Analyze the loss, identify root causes, and develop improvement hypothesis. Use 5-Why analysis, fishbone diagrams, and historical data to understand the problem fully before acting.
Do
Implement the improvement on a small scale first (pilot). Make changes, train operators, and execute the plan while documenting what actually happens.
Check
Measure results against baseline. Did the loss decrease? By how much? Were there unintended consequences? Use OEE data to validate improvement objectively.
Act
If successful, standardize the improvement and expand to other lines/shifts. If not successful, analyze why and start a new PDCA cycle with revised approach.
Turn Loss Data into Action
Oxmaint's OEE platform automatically generates Loss Trees, Pareto charts, and improvement tracking—transforming data into systematic productivity gains.
Common Loss Tree Mistakes
Avoid these pitfalls when implementing loss analysis to ensure your efforts drive real improvement.
Too Many Categories
Creating dozens of loss categories makes analysis overwhelming and dilutes focus. Keep your Loss Tree to 3-4 levels with 5-8 items at each level.
Vague Categories
"Other" or "Miscellaneous" categories that grow over time hide real problems. If "Other" exceeds 10%, break it down into specific causes.
Inconsistent Tracking
Different operators or shifts categorizing losses differently corrupts your data. Establish clear definitions and train everyone consistently.
Analysis Without Action
Beautiful Loss Trees mean nothing without improvement projects. Every analysis cycle should result in at least one focused improvement initiative.
Ignoring Small Losses
Focusing only on big losses while ignoring frequent small ones misses cumulative impact. Twenty 2-minute stops equal one 40-minute breakdown.
Static Analysis
Building a Loss Tree once and never updating it misses how losses shift over time. Review and refresh your analysis monthly or quarterly.
Frequently Asked Questions
How deep should my Loss Tree go?
Most effective Loss Trees have 3-4 levels: OEE factors → Six Big Losses → Category (e.g., mechanical vs. electrical) → Specific cause (e.g., bearing failures). Go deep enough that the bottom level is directly actionable—you should be able to assign someone to fix a specific item. If your categories are still too broad to act on, go one level deeper.
How do I track small stops that last only seconds?
Manual logging can't capture brief stops reliably. Use automatic cycle time monitoring—when individual cycles exceed ideal time, you're detecting small stops indirectly. Many OEE systems also use sensors to detect when equipment isn't cycling, even for a few seconds. The key is automated data collection; once captured, aggregate small stops into meaningful categories.
Should we use the same Loss Tree categories for all equipment?
Use consistent top levels (OEE factors and Six Big Losses) across all equipment for comparability. However, the lower levels should be equipment-specific—a packaging line has different failure modes than a CNC machine. Create templates by equipment type, and allow customization at the detail level while maintaining standard categories for roll-up reporting.
How often should I review and update the Loss Tree?
Review your Loss Tree monthly for tactical decisions (which improvement projects to prioritize) and quarterly for structural changes (do categories still make sense, has the loss pattern shifted). After major changes—new equipment, new products, significant improvements—update immediately. An outdated Loss Tree misguides improvement efforts.
What's the relationship between Loss Tree analysis and TPM?
The Six Big Losses and Loss Tree framework originated from Total Productive Maintenance (TPM). TPM provides the organizational structure (autonomous maintenance, focused improvement, etc.) while the Loss Tree provides the analytical framework to direct those efforts. They work together: Loss Tree analysis identifies what to improve; TPM pillars provide the methodology to improve it. Focused Improvement (Kobetsu Kaizen) specifically uses Loss Tree analysis to select and prioritize improvement projects.