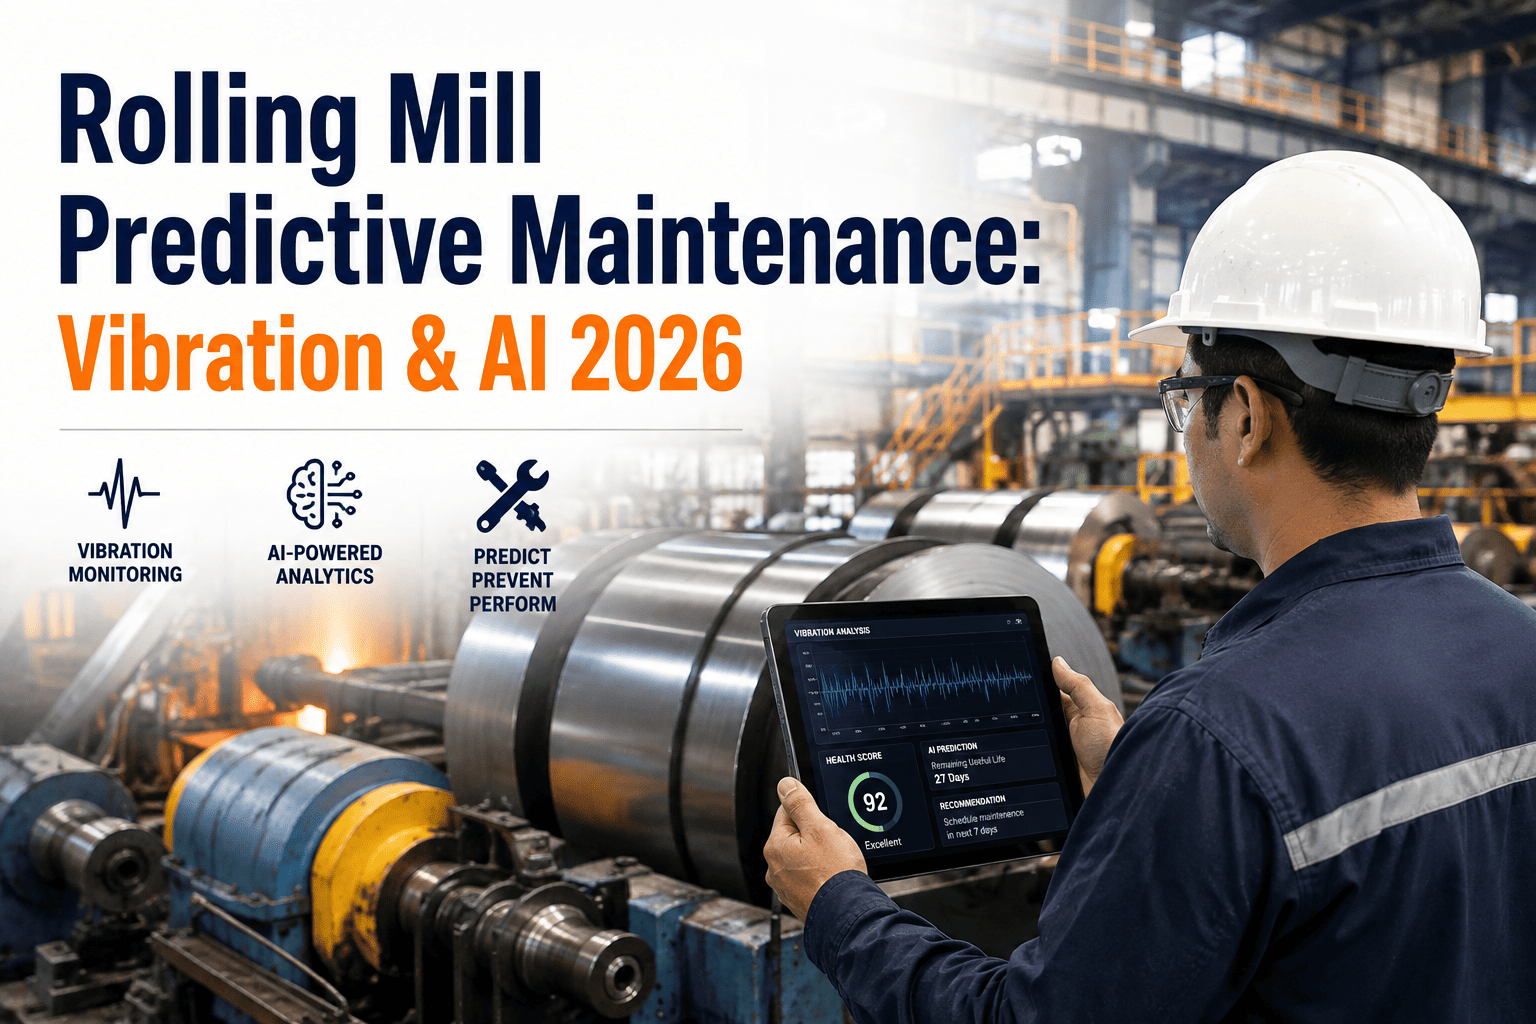
Rolling Mill Predictive Maintenance: Vibration & AI 2026

By Corin Hale on August 5, 2026

rolling-mill-predictive-maintenance-vibration-ai-2026

A tandem cold mill running six stands at 1,500 metres a minute relied on quarterly vibration surveys and a maintenance team that trusted the numbers on the HMI screen. For weeks strip gauge held within spec and no alarms fired, while a servo valve on the fifth stand quietly lost nearly half its response speed. By the time gauge deviation showed up on the finishing line, the mill had already scrapped two coils and stopped the line for an emergency valve change — a fault that had been sitting in the vibration and pressure data for over a month before anyone looked. See how Oxmaint turns that same data into an early warning instead of a post-mortem.

Rolling Mill Predictive Maintenance / Vibration & AI / 2026 Guide

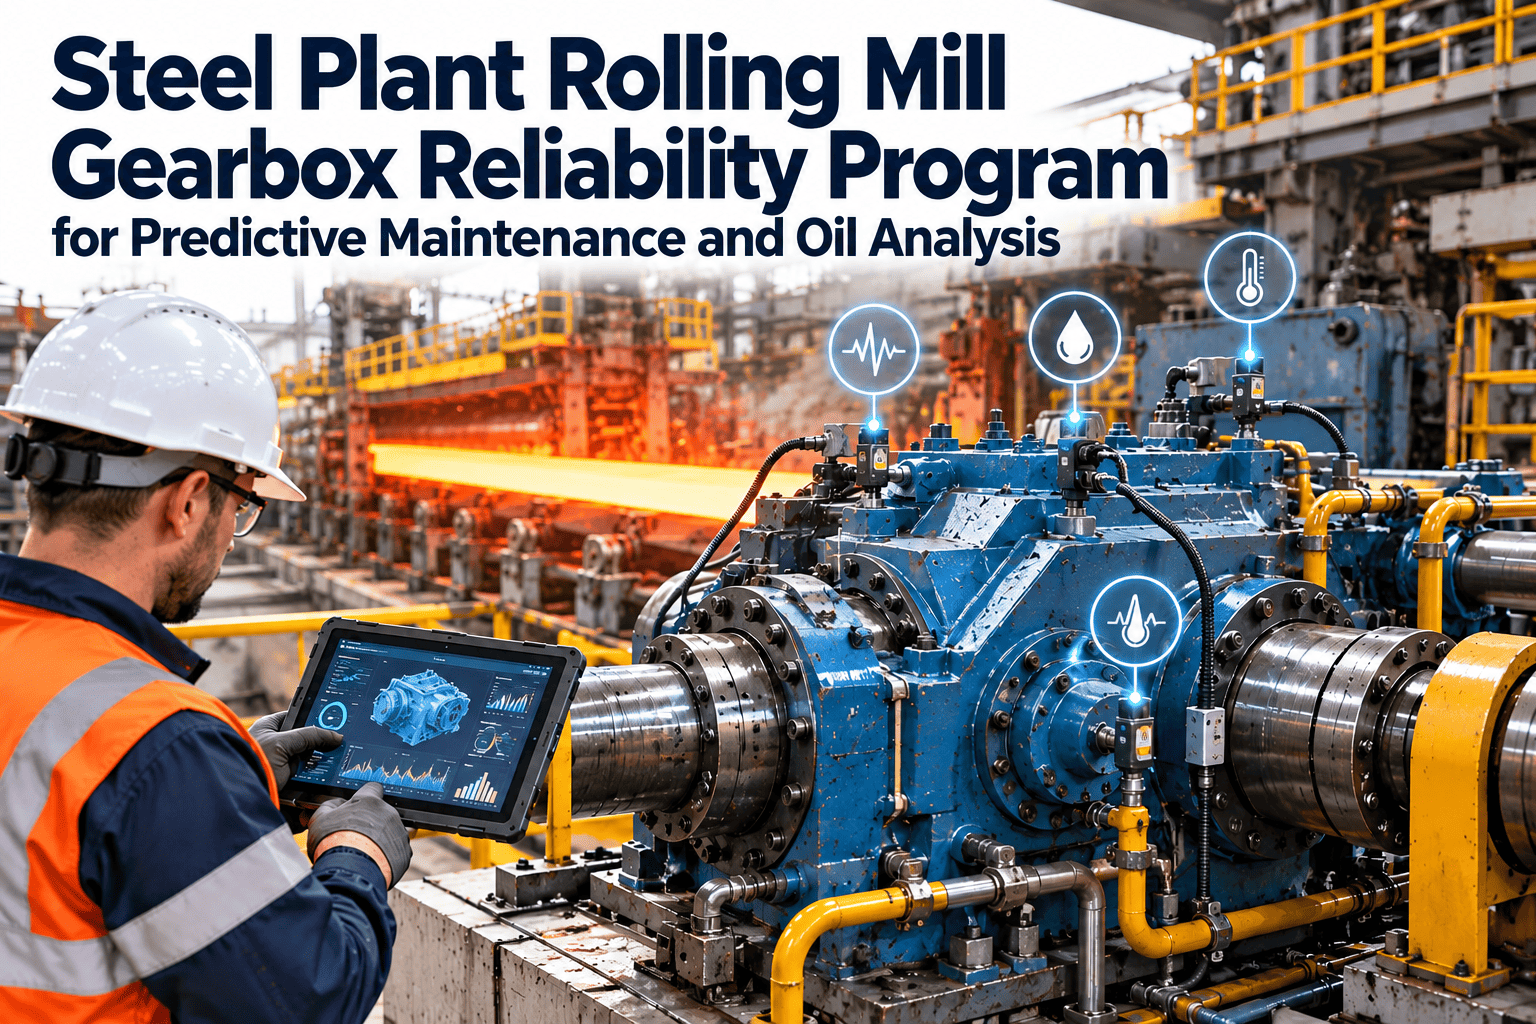
Predictive Maintenance for Steel Rolling Mills — Vibration, Chatter, and AI Working Together

Bearing spalling, third-octave chatter, gauge drift, and strip breakage all leave a signature in the data weeks before they stop the mill. Here is how vibration analysis and AI models turn that signature into a scheduled repair instead of an unplanned stop.

4–8 wks
Typical advance warning window for bearing and gear failures
55%
Fewer emergency roll changes on mills running predictive vibration programs
60–70%
Drop in false-positive alerts once baselines are load-normalized
$6K–$12K
Lost production per hour during an unplanned stand stoppage
Rolling Mill Predictive Maintenance

Stop Reacting to Alarms That Already Missed the Warning Window

Oxmaint reads bearing vibration, chatter frequency, and gauge trend data together, then turns a developing fault into a scheduled work order before it turns into a mill stop.

Why Bearings and Gearboxes Still Fail Without Warning

Most calendar-based inspection programs measure overall vibration level, and a bearing can look perfectly healthy on that number right up until it fails. The actual failure signature shows up earlier, but only inside a narrow frequency band tied to the bearing's geometry — the outer race defect frequency. A bearing entering the early stages of spalling can show a normal overall reading while the amplitude at that specific defect frequency climbs several hundred percent over a few weeks. Reading the full spectrum, not just the headline number, is what separates a predictive program from a monitoring routine that only confirms damage after the fact.

Four Signals a Rolling Mill Predictive Program Has to Track

Bearing Vibration Analysis
Catching Spalling Before the Overall Reading Moves
Envelope analysis at the bearing defect frequency picks up outer race and gear tooth damage roughly five to seven weeks before it reaches functional failure — well before a handheld overall-level check would notice anything.
Chatter Detection
Separating Harmless Rumble From Self-Exciting Resonance
Third-octave and fifth-octave chatter build from normal to destructive amplitude in under a second. Accelerometer monitoring in the 100–150 Hz band catches the developing peak and cuts speed before it prints stripes or breaks the strip.
Gauge Deviation Trending
Watching the AGC Work Harder Before Spec Is Missed
A servo valve losing response time makes the AGC system compensate with larger corrections — gauge still holds on the HMI while the valve quietly degrades toward the point where compensation can no longer keep up.
AI Strip Breakage Prediction
Correlating Tension, Vibration, and Temperature Together
A single sensor reading rarely predicts a break on its own. AI models that combine tension, chatter amplitude, and roll temperature flag the combinations that historically preceded a cobble, not just one parameter drifting.

Reactive Checks vs Scheduled Surveys vs an AI Predictive Program

The table below shows why a quarterly vibration survey still leaves a mill exposed even after it moves past purely reactive maintenance.

Metric Reactive Maintenance Scheduled Vibration Surveys Continuous AI Monitoring
Fault detection window None — found at failure Gaps of weeks between checks 4–8 weeks continuous coverage
False alarm rate Not applicable High on fixed thresholds Low with load-normalized baselines
Unplanned stand stoppages Frequent Occasional between surveys Rare, mostly scheduled instead
Roll change planning Emergency, no lead time Partial, based on last survey Planned around estimated time-to-failure
Cost exposure per event Full stoppage plus scrap Reduced but still reactive gaps Repair cost only, at a planned window
From Sensor Data to Work Order

See the Full Path From a Vibration Spike to a Scheduled Repair

Oxmaint pre-populates the work order with asset ID, failure mode, recommended procedure, and the exact spare part number the moment a threshold is crossed — no manual triage required.

How Sensor Data Becomes a Scheduled Repair

01
Sensor Placement on Every Critical Point
Accelerometers go on bearing housings, gearboxes, and drive couplings across every stand, with pressure and temperature sensors added on AGC hydraulics and roll cooling circuits.
02
Spectrum Analysis Against a Learned Baseline
Each asset gets a normal vibration signature learned at every production load, so a heavy-gauge pass is never confused with a developing fault.
03
ML Model Tuning to the Mill's Own History
Models are tuned against the mill's actual failure history, correlating vibration, oil analysis, and temperature so a diagnosis carries a confidence score instead of a guess.
04
Alarm Workflow That Skips the Inbox
A threshold crossing does not just send a notification — it opens a structured alert with the diagnosed component, severity stage, and estimated time to functional failure.
05
Scheduled Intervention, Not a Fire Drill
The planner reviews and approves a work order that already has the part number checked against stock and a suggested window tied to the next planned shutdown.

What Changes Once the AI Layer Sits on Top of the Sensors

Outcome Vibration Data Alone Vibration Data + AI
Bearing fault lead time Often missed until overall level moves 5–7 weeks via defect-frequency envelope analysis
Chatter response Operator reacts after amplitude spikes Automatic speed reduction before break threshold
Gauge deviation cause Shows up as a symptom on the HMI Traced to the specific degrading component
False positive work orders Frequent on fixed thresholds Cut 60–70% with load-normalized baselines
Maintenance planning Reactive, driven by alarms Scheduled around estimated time-to-failure

Why Catching the Signal Early Pays for the Programme

$6K–$12K
Lost production per hour of an unplanned stand stoppage
A single event running 8 to 72 hours can outweigh a full year of monitoring cost
~$191K
Average total cost of a cobble event traced to a missed gauge deviation
Versus a few thousand dollars for the part and downtime of a planned swap
5x+
Typical cost multiple of a catastrophic gearbox failure over a planned repair
The same fault, caught weeks earlier, becomes a scheduled line item instead
16–24 wks
Typical rollout time from first sensor to full AI model coverage
A phased programme on a hot strip mill reaches full coverage inside two quarters

Frequently Asked Questions

How early can vibration analysis actually catch a bearing fault?+
Envelope analysis at the bearing defect frequency typically shows a developing fault five to seven weeks before functional failure, well before the overall vibration reading changes. See how this works inside Oxmaint.
What is the difference between third-octave and fifth-octave chatter?+
Third-octave chatter is a self-exciting resonance that produces gauge variation, while fifth-octave chatter prints visible stripes on the strip. Both build to destructive amplitude in under a second, which is why automatic detection matters more than operator response time.
Why does gauge deviation still show up if the AGC pressure looks normal?+
A degrading servo valve makes the AGC system compensate with larger corrections, which hides the problem on the HMI until compensation capacity runs out. Trending the valve response time directly is what surfaces it early.
How does AI reduce false alarms compared to fixed vibration thresholds?+
Fixed thresholds treat a heavy-gauge pass the same as a developing fault. Load-normalized baselines learn what is normal at each production condition, which is what cuts false-positive work orders by 60 to 70 percent.
How long does it take to roll out a predictive programme across a mill?+
A phased programme on a hot strip mill typically reaches full sensor and AI model coverage in sixteen to twenty-four weeks. Book a demo to see a rollout plan sized to your stands.
Rolling Mill Predictive Maintenance — Oxmaint
Every Bearing Tracked. Every Chatter Signal Caught. Every Gauge Drift Explained.

Vibration analysis, chatter detection, gauge trending, and AI-based strip breakage prediction, connected directly to work orders your planners can act on before the mill stops.

4–8 wks
Advance warning on bearing and gear faults
55%
Fewer emergency roll changes
60–70%
Fewer false-positive alerts
16–24 wks
To full programme coverage

Share This Story, Choose Your Platform!