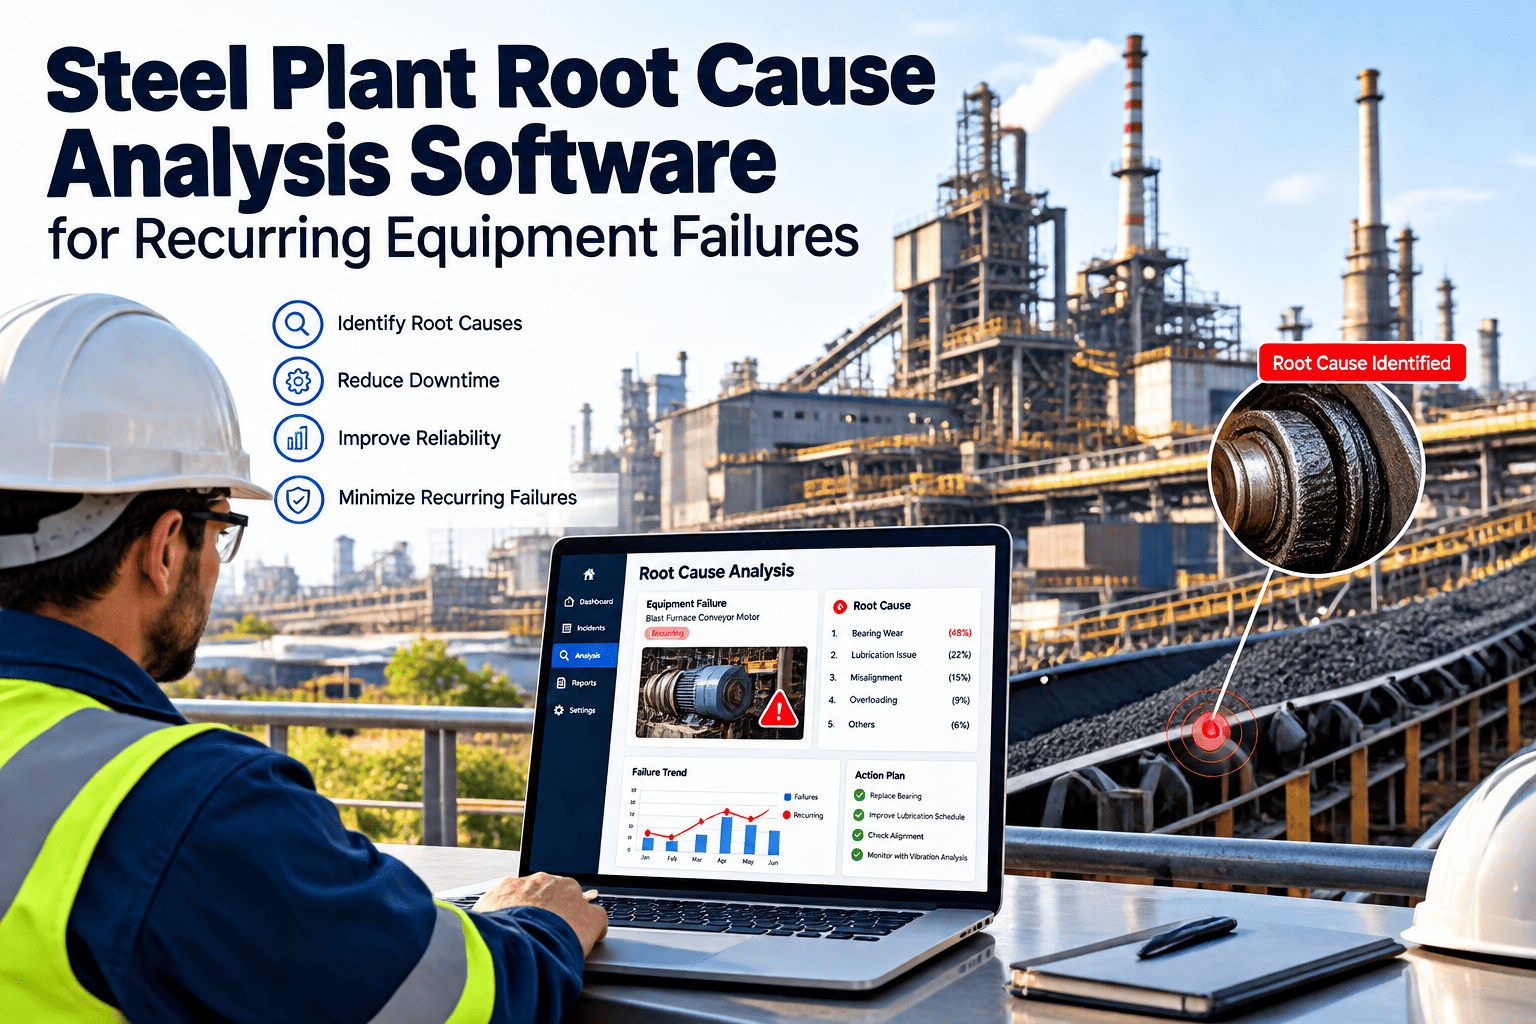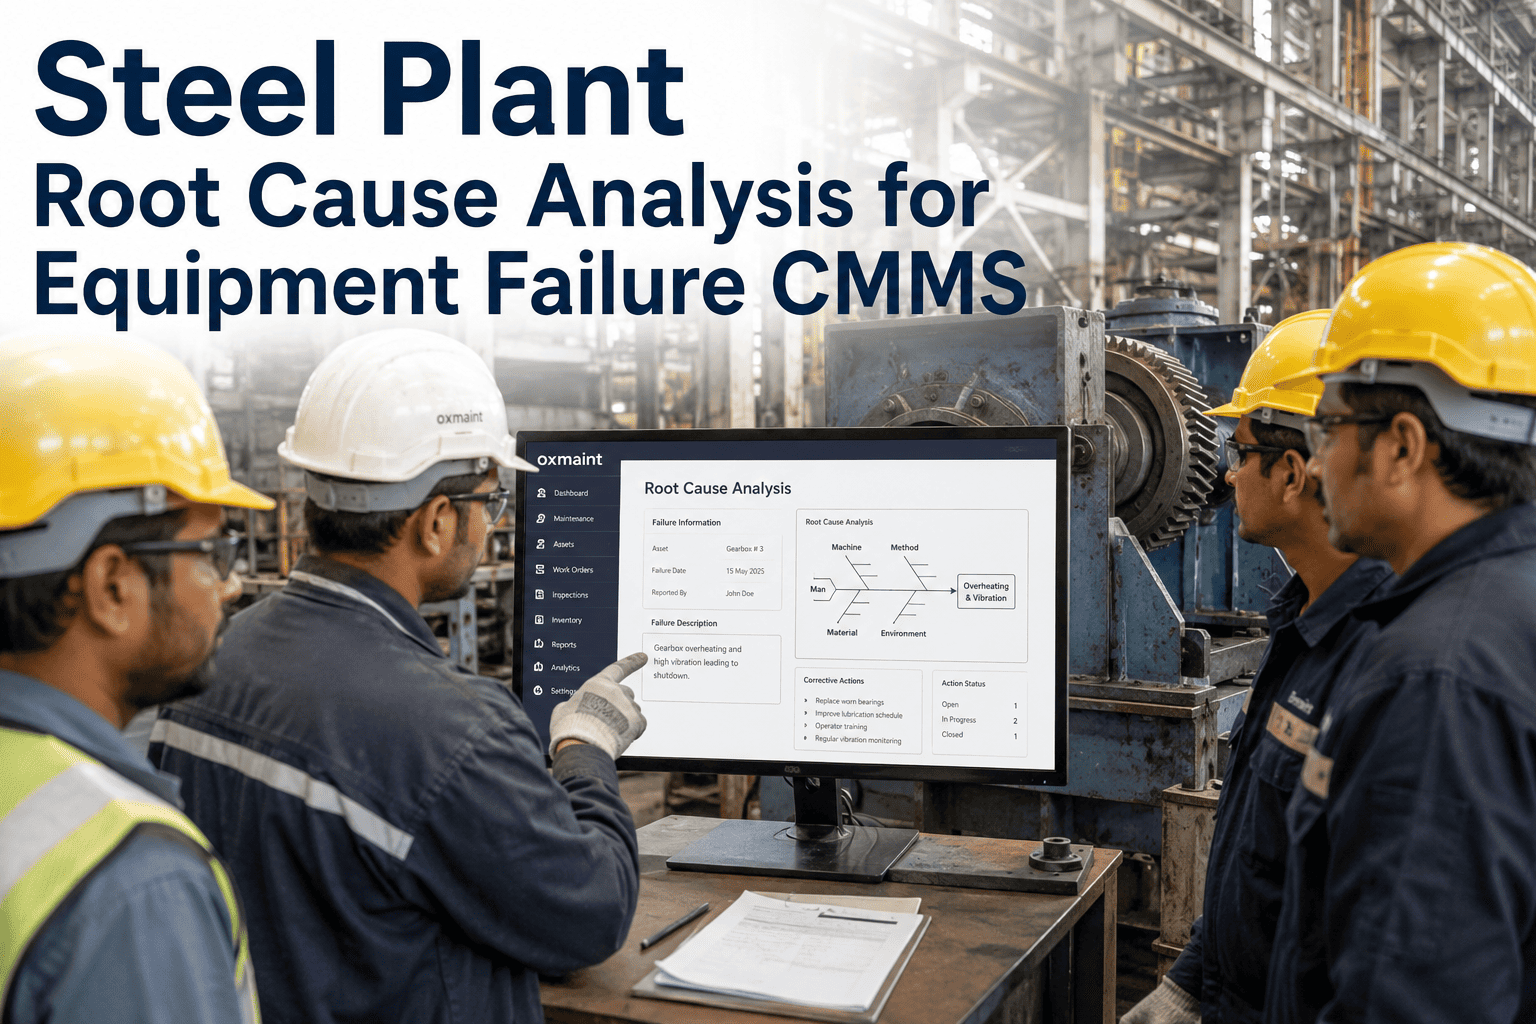
Traditional root cause analysis at a steel plant runs on human pattern recognition — a reliability engineer pulls three or four related failure reports, notices a shared symptom, and traces it back to a probable cause. That process works well for obvious, single-asset problems, but it breaks down when the real pattern spans a rolling mill's vibration data, a furnace's energy consumption curve, and a caster's quality rejects three shifts later. No engineer can hold that many variables in working memory across that many data streams. Machine learning models built on downtime, quality, and energy data can, because they test every candidate correlation systematically rather than relying on which connection happens to occur to the investigator first. This is why AI-assisted root cause analysis is becoming the layer that finds the patterns conventional RCA teams structurally cannot see, and it is the gap OxMaint's AI root cause module is designed to close for steel operations.
Find the Patterns Human RCA Teams Miss
OxMaint's machine learning models cross-reference downtime, quality rejects, and energy data across every line, surfacing correlated failure patterns that would take a reliability team weeks to find manually — if they found them at all.
Why Human RCA Hits a Ceiling in Steel Plants
Manual root cause analysis is limited by how much correlated data one investigator can reasonably hold in mind at once. A reliability engineer reviewing a repeat motor failure will typically check that motor's own maintenance history, maybe its immediate neighbors on the line, and stop there. What they rarely check — because it is not an obvious place to look — is whether energy consumption on an upstream furnace spiked in a pattern that precedes each failure by six to eight hours, or whether quality rejects on a downstream caster cluster around the same shift pattern as the motor trips. These cross-system correlations are exactly what machine learning models are built to detect, because they do not get tired, do not anchor on the most recent failure, and do not need the connection to be intuitive before they test it. A model does not care whether a furnace and a caster three lines away seem like plausible partners in a failure story — it simply checks whether the numbers move together with enough consistency to matter, and lets the reliability team decide what to do with that finding.
| Dimension | Manual RCA | AI-Assisted RCA |
|---|---|---|
| Data scope per investigation | 1-2 related assets, single system | All connected assets across downtime, quality, energy |
| Time to identify pattern | Days to weeks | Minutes to hours |
| Cross-shift correlation detection | Rare, relies on investigator memory | Standard, automatic across full history |
| Confidence basis | Investigator experience and intuition | Statistical correlation strength across data |
| Best suited for | Obvious single-asset failures | Recurring, cross-system, intermittent failures |
Where Pattern Detection Finds What RCA Teams Miss
The value of ML-based root cause analysis is concentrated in exactly the failure types manual investigation handles worst: intermittent problems that don't repeat on a clean schedule, failures with a long and variable lag between cause and effect, and failures whose root cause sits on an asset nobody would think to check because it sits upstream in a completely different part of the process flow than where the symptom eventually shows up. A furnace refractory wearing thin does not announce itself with an alarm — it shows up as a slow energy consumption drift that, months later, correlates with an increase in downstream caster quality rejects that looks, on its own, like a completely unrelated casting problem. By the time someone on the caster side investigates the reject spike, the furnace-side trend that actually started it has long since scrolled off the top of anyone's attention.
A model trained across these three data streams for a full production year can detect that a specific pattern — a two-percent energy draw increase on a reheat furnace, sustained for five consecutive shifts — precedes a spike in surface defect rejects on the downstream mill by an average of eleven days, with enough statistical consistency to flag it as a probable cause rather than a coincidence. No manual review process checks energy trends against quality rejects eleven days later as a matter of routine, because the two events look completely unconnected without the model surfacing the correlation first. This is the category of pattern that AI-assisted RCA is genuinely suited for — not replacing the judgment call on an obvious single-asset breakdown, but catching the slow, cross-system drift that hides in plain sight across data nobody thinks to compare side by side.
What Undetected Failure Patterns Cost a Steel Plant
The cost of missed pattern detection compounds because the same root cause keeps generating new symptoms on different assets, and each new symptom gets investigated and closed as an isolated event rather than recognized as a repeat occurrence of the same underlying problem. Every time that happens, the plant pays the full investigation cost again, replaces a part that was never really the problem, and leaves the actual upstream cause free to trigger the next failure somewhere else in the line. The waterfall below shows how one undetected upstream cause can generate a cascade of seemingly unrelated repair costs before the pattern is finally traced back to its source.
How AI Pattern Detection Fits Into the RCA Workflow
AI root cause tools work best as an addition to the investigation process, not a replacement for the engineer's judgment. The model's role is to narrow a wide field of possible causes down to a small, statistically ranked shortlist, so the human investigator spends their time validating a strong hypothesis rather than generating one from scratch across months of disconnected records. That division of labor — the model surfacing candidates, the engineer confirming and acting — is what makes AI RCA practical to run continuously rather than as an occasional special project reserved for the plant's most stubborn recurring problems.
Building a Steel Plant's Failure Pattern Library Over Time
A single model run against one quarter of data will find the loudest, most obvious correlations and stop there. The real value compounds as the model accumulates failure history across multiple production years, because rarer patterns — the ones that occur only two or three times but cost tens of thousands of dollars each time they repeat — need enough historical instances before the correlation is statistically distinguishable from coincidence. Plants that treat AI RCA as a one-time diagnostic exercise capture a fraction of the value available compared to plants that let the model run continuously and build a growing library of confirmed failure patterns specific to their own equipment and process conditions, rather than generic industry benchmarks.
This pattern library becomes especially valuable during new-hire onboarding and shift handovers, where institutional knowledge about "that one time the furnace did this and it caused problems downstream two weeks later" traditionally lived only in the memory of a handful of senior engineers. When that knowledge is captured as a documented, data-backed pattern instead, it survives staff turnover and becomes searchable the next time a similar symptom appears on a different shift or a different crew, closing a knowledge gap that has historically cost steel plants real money every time an experienced engineer retires or moves on without a formal handover of the patterns they had learned to recognize by instinct. The plant stops depending on any single person's tenure to preserve the lessons its own equipment has already taught it, which matters most exactly when that person is no longer around to be asked.
We had replaced the same gearbox three times in fourteen months on three different lines and treated each one as a one-off. The pattern model connected all three to a shared upstream cooling water temperature drift nobody had thought to check. One fix, and the repeat failures stopped across all three lines at once.
Let the Model Find What Manual RCA Can't
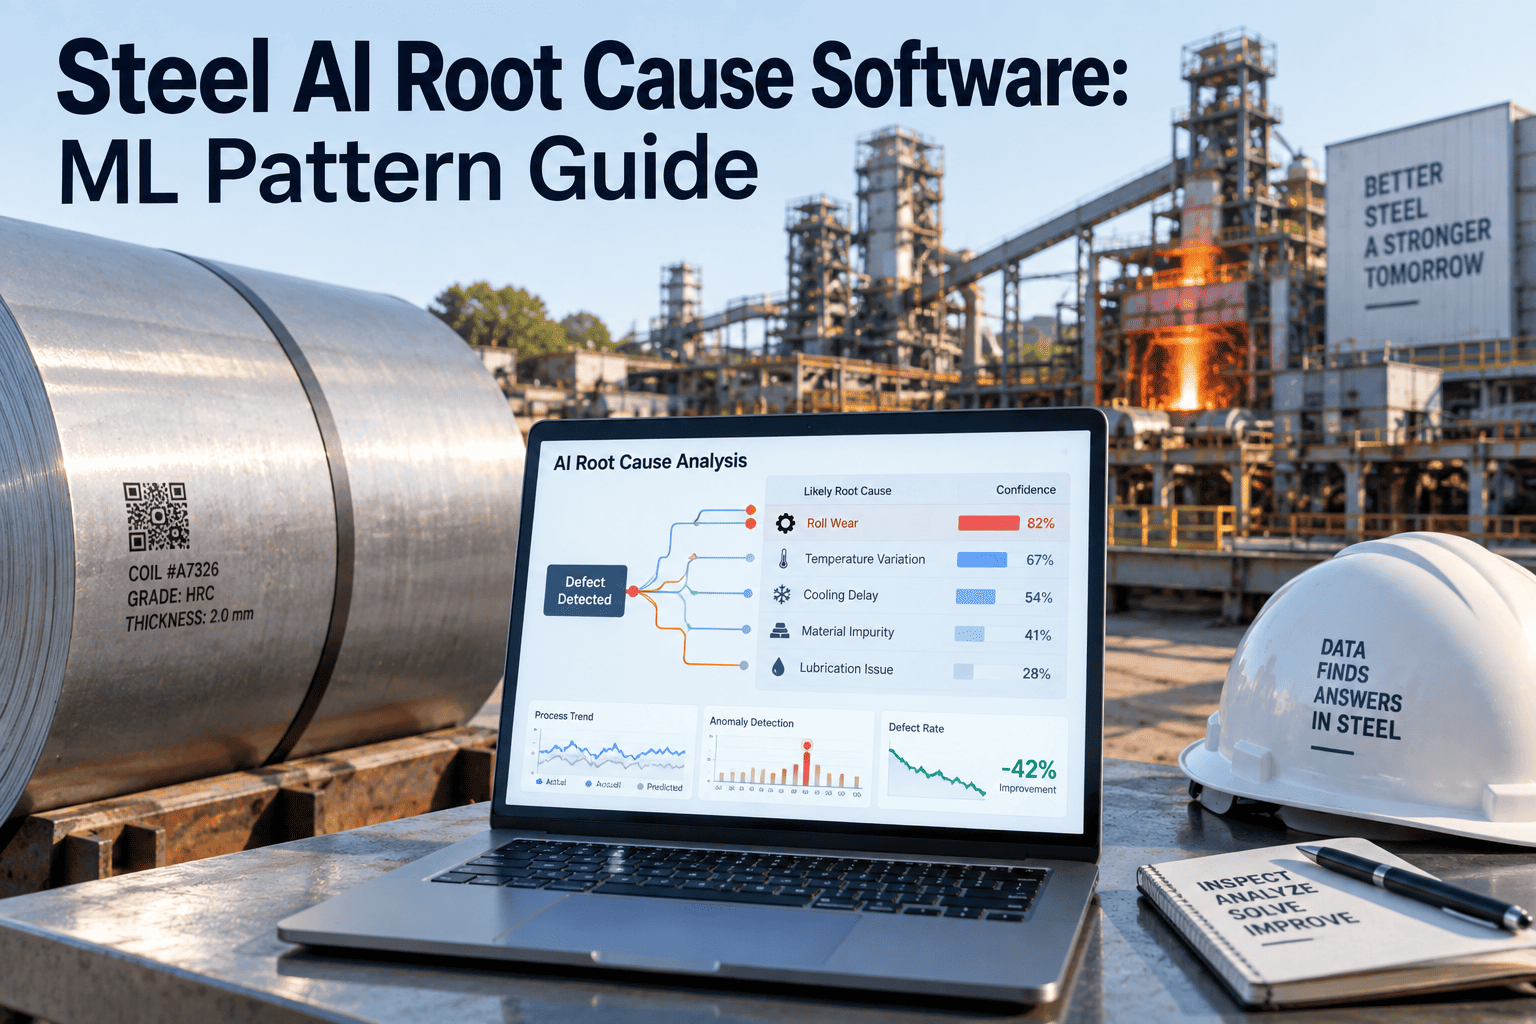
OxMaint cross-references downtime, quality, and energy data across every line to rank probable root causes by correlation strength, with the underlying data shown for every flagged pattern.
Common Challenges in AI-Assisted Root Cause Analysis
Data Living in Separate, Disconnected Systems
Downtime logs, quality data, and energy readings are frequently owned by different systems that were never designed to be cross-referenced. A model can only find a cross-system pattern if the underlying data is actually connected, which makes system integration the real prerequisite for AI RCA.
Insufficient Failure History to Train On
Pattern detection needs enough historical failure events to learn a reliable correlation rather than mistaking coincidence for causation. Newer lines or recently commissioned equipment often lack the depth of history needed for high-confidence output in the first year.
Trusting an Unexplained Correlation
A ranked list of probable causes without visible supporting data invites the same skepticism any black-box recommendation earns from experienced engineers. Explainable output showing the actual correlated data points is what turns a flagged pattern into an actionable investigation.
Treating Every Flag as Equally Urgent
Not every statistical correlation the model surfaces warrants an immediate work order, and treating a low-confidence flag with the same urgency as a strong one trains the team to start ignoring the alerts altogether. Ranking flagged patterns by both correlation strength and potential cost impact keeps the reliability team focused on the patterns worth acting on first.
Frequently Asked Questions
What data does AI root cause analysis need to work in a steel plant?
At minimum, downtime logs with cause codes, quality reject records tied to batch and shift, and energy consumption data per asset. OxMaint's AI RCA module cross-references all three to detect patterns a single data source would miss.
How is AI root cause analysis different from a predictive maintenance alert?
Predictive maintenance flags that a specific asset is likely to fail soon. AI root cause analysis explains why failures are recurring across multiple assets by finding the shared upstream cause connecting them — a different, complementary question.
Can AI pattern detection replace a reliability engineering team?
No. The model narrows a wide field of possible causes to a ranked, statistically supported shortlist. The engineer still validates the hypothesis and decides the corrective action — the model changes how fast a strong hypothesis is found, not who makes the final call.
How much failure history is needed before the model is reliable?
Most plants see meaningful pattern detection after twelve to eighteen months of connected downtime, quality, and energy history, though obvious high-frequency patterns can surface sooner. Confidence improves steadily as more failure history accumulates.
What is the first step to set up AI-assisted RCA at our plant?
Start by confirming downtime, quality, and energy data are captured in systems that can be connected, since fragmented data is the most common blocker. Book a demo to review your current data setup against what the model needs.
Stop Re-Investigating the Same Root Cause
OxMaint's AI pattern detection connects downtime, quality, and energy data across every line, so recurring failures get traced to their real cause instead of being closed as isolated events.