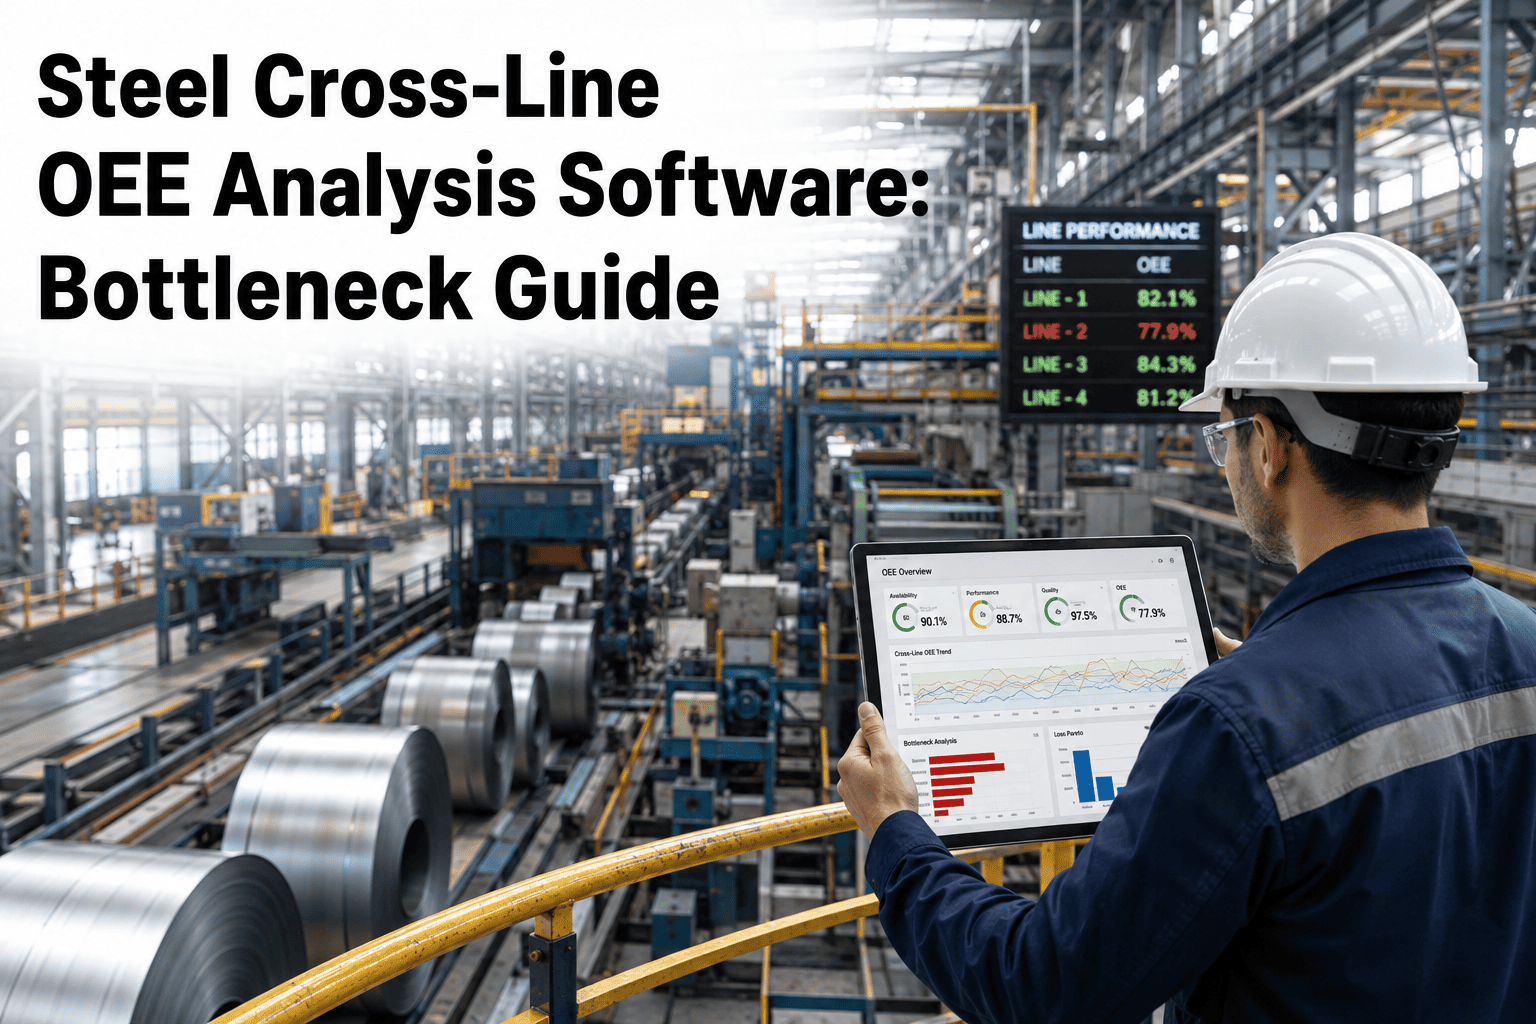
The hot strip mill reports 64% OEE and everyone assumes it's the problem line — so that's where the improvement budget goes, for the third year running, with barely a dent in plant output. Meanwhile the real constraint is sitting two steps upstream at the caster, starving the mill of slabs on a schedule nobody's tracking, and every dollar spent fixing the mill was spent fixing a symptom. This is the trap of measuring OEE one line at a time: each area looks self-contained on its own dashboard, but a steel plant is a chain, and downtime on one line cascades forward and backward through every line connected to it. OxMaint tracks OEE across every line at once, so the constraint that's actually capping plant output gets found before another improvement budget gets spent on the wrong machine.
Your Bottleneck Moves. Your Dashboard Should Too.
Cross-line OEE analysis that follows cascading downtime from melt shop to finishing, so the constraint capping your plant gets fixed instead of guessed at.
68%
industry-median steel plant OEE — top-quartile plants run above 80%, a gap worth seven figures a year.
10–25 pts
lower a full production line's OEE typically runs than its best individual machine, because the slowest station sets the pace for everyone.
Shifts weekly
the actual constraint can move between lines depending on product mix, maintenance events, and staffing — single-line tracking misses this entirely.
Why the Line With the Worst OEE Isn't Always the Bottleneck
It's tempting to point improvement budget at whichever line has the lowest OEE number on the dashboard. But a line can post poor OEE simply because it's starved of material by a constraint upstream, or blocked because a downstream line can't take its output fast enough. Fixing the low-OEE line in that case changes nothing — the real constraint is somewhere else entirely, quietly setting the ceiling for the whole plant.
Melt Shop
OEE 78%
Running well, but downstream caster delays force scheduled holds
→
Continuous Caster
OEE 61%
The real constraint — mold changeovers and breakout stops set the pace for everything downstream
→
Hot Strip Mill
OEE 64%
Looks like the problem — actually starved of slabs by the caster upstream
→
Cold Mill & Finishing
OEE 74%
Running under-capacity, waiting on hot mill output that's already delayed twice
Cross-Line OEE — OxMaint
Stop Fixing the Line That Just Looks Broken
OxMaint tracks utilization, stop frequency, and upstream/downstream queue depth together, so the line quietly capping your output gets identified instead of the one that just has the worst-looking dashboard.
Three Signals That Actually Confirm a Bottleneck
A low OEE number alone isn't proof of a bottleneck — it could be a symptom of a constraint elsewhere. These three signals, checked together, are what separates the real constraint from the line that just looks the worst.
Utilization Rank
The true constraint is typically running closest to full capacity, with the least idle time between jobs. A line sitting idle waiting on material is not the bottleneck — it's a victim of one.
Stop Frequency Per Shift
Frequent short stops compound faster than a few long ones. A line stopping often, even briefly, can drag down system throughput more than a line with occasional long downtime.
Upstream/Downstream Queue Depth
Inventory piling up before a line and starving after it is the clearest tell. A full buffer upstream and an empty one downstream points straight at the actual constraint.
OEE Benchmarks by Process Area — Where the Losses Actually Sit
Every process area in a steel plant has different loss drivers and a different realistic benchmark. Comparing your caster's OEE against your finishing line's target is comparing two different jobs — the table below breaks out what's typical for each.
Building a Cross-Line RCA Discipline — Five Steps
Root cause analysis done line-by-line finds local fixes. Root cause analysis done across the plant finds the fix that actually moves total output. Here's the sequence that gets a plant there.
1
Standardize Downtime Categories Across Every Line
Mechanical, electrical, process, planned, and external stops need the same definitions everywhere, or cross-line comparisons are meaningless from the start.
2
Track Queue Depth Between Every Line
Buffer and starvation data between stages is what turns isolated OEE numbers into a picture of which line is actually constraining the others.
3
Run a Weekly Cross-Functional OEE Review
Operations and maintenance reviewing loss data together, across lines, catches cascading patterns that a single-department report never surfaces.
4
Re-Validate the Bottleneck Monthly
The constraint shifts with product mix and maintenance schedules. A bottleneck identified in January may have moved by March — assuming it hasn't is how budgets get wasted.
5
Size Every Improvement Project Against System Output
A 10% OEE gain on a non-constraint line barely moves plant throughput. The same effort on the true bottleneck can be worth millions — size the investment to match.
What Chasing the Wrong Line Actually Costs
The two scenarios below use the same improvement budget and the same plant — the only difference is whether the constraint was correctly identified first.
Fixed the Real Constraint
Improvement budget spent$420,000
Plant-wide throughput gain+9.5%
Annual recovered revenue$3.1M+
Time to measurable result8–10 weeks
Fixed the Wrong Line
Improvement budget spent$420,000
Plant-wide throughput gain+0.8%
Annual recovered revenueUnder $150,000
Time before the mistake is found6–12 months
We spent two capital cycles upgrading our hot strip mill because it always had the worst OEE number on the report. Plant output barely moved either time. When we finally tracked queue depth between the caster and the mill, it was obvious — the mill was starved half the time, waiting on the caster. We shifted focus to caster changeover time instead, and saw more throughput gain in one quarter than we did in two years of mill upgrades.
— Plant Operations Director, Integrated Steel Producer
What to Look For in Cross-Line OEE Software
A dashboard that shows OEE per line side by side isn't the same as software that helps you find the actual constraint. These four capabilities make the difference.
Queue Depth Between Lines
Buffer and starvation tracking between every stage is what reveals whether a low-OEE line is the cause or the victim of a constraint elsewhere.
Standardized Loss Categories Plant-Wide
Every line needs to classify downtime the same way, or cross-line Pareto analysis compares numbers that were never comparable to begin with.
Automatic Timestamped Downtime Capture
Manual logs miss micro-stops and introduce hours of delay. Automated capture from CMMS and line controls is what makes cross-line comparison trustworthy.
Constraint Re-Validation Over Time
The software should make it easy to re-check which line is the bottleneck monthly, since product mix and maintenance events shift the constraint regularly.
Frequently Asked Questions — Cross-Line OEE & Bottleneck Analysis
How do I know if a low-OEE line is the bottleneck or just starved?
Check inventory before and after the line. If material is piling up before it and running dry after it, that line is likely the actual constraint rather than a victim of one upstream.
See how cross-line tracking confirms this automatically.
Why does the bottleneck move between lines over time?
Product mix, maintenance events, and staffing all shift which line runs closest to full capacity at any given time. A constraint identified last quarter may not be the constraint today.
What's the difference between line-level OEE and plant-level OEE?
Line-level OEE shows exactly which machine is dragging a specific line down. Plant-level OEE, tracked across all lines together, shows which line is actually capping total output for the whole operation.
How long does it take to set up cross-line OEE tracking?
Most plants get reliable OEE data on one pilot area within about a month, then expand to plant-wide, connected tracking with queue depth data over the following two to three months.
Can cross-line OEE data justify capital investment decisions?
Yes — sizing a capital project against the true system constraint, rather than the line with the worst-looking number, is what makes the investment case defensible.
Book a demo to see it modeled against your own lines.
Cross-Line OEE — OxMaint
Find the Line That's Actually Capping Your Output
10–25 ptsgap between line OEE and its best individual machine
$3M+typical annual value of fixing the true constraint
Monthlyre-validation keeps improvement spend on target