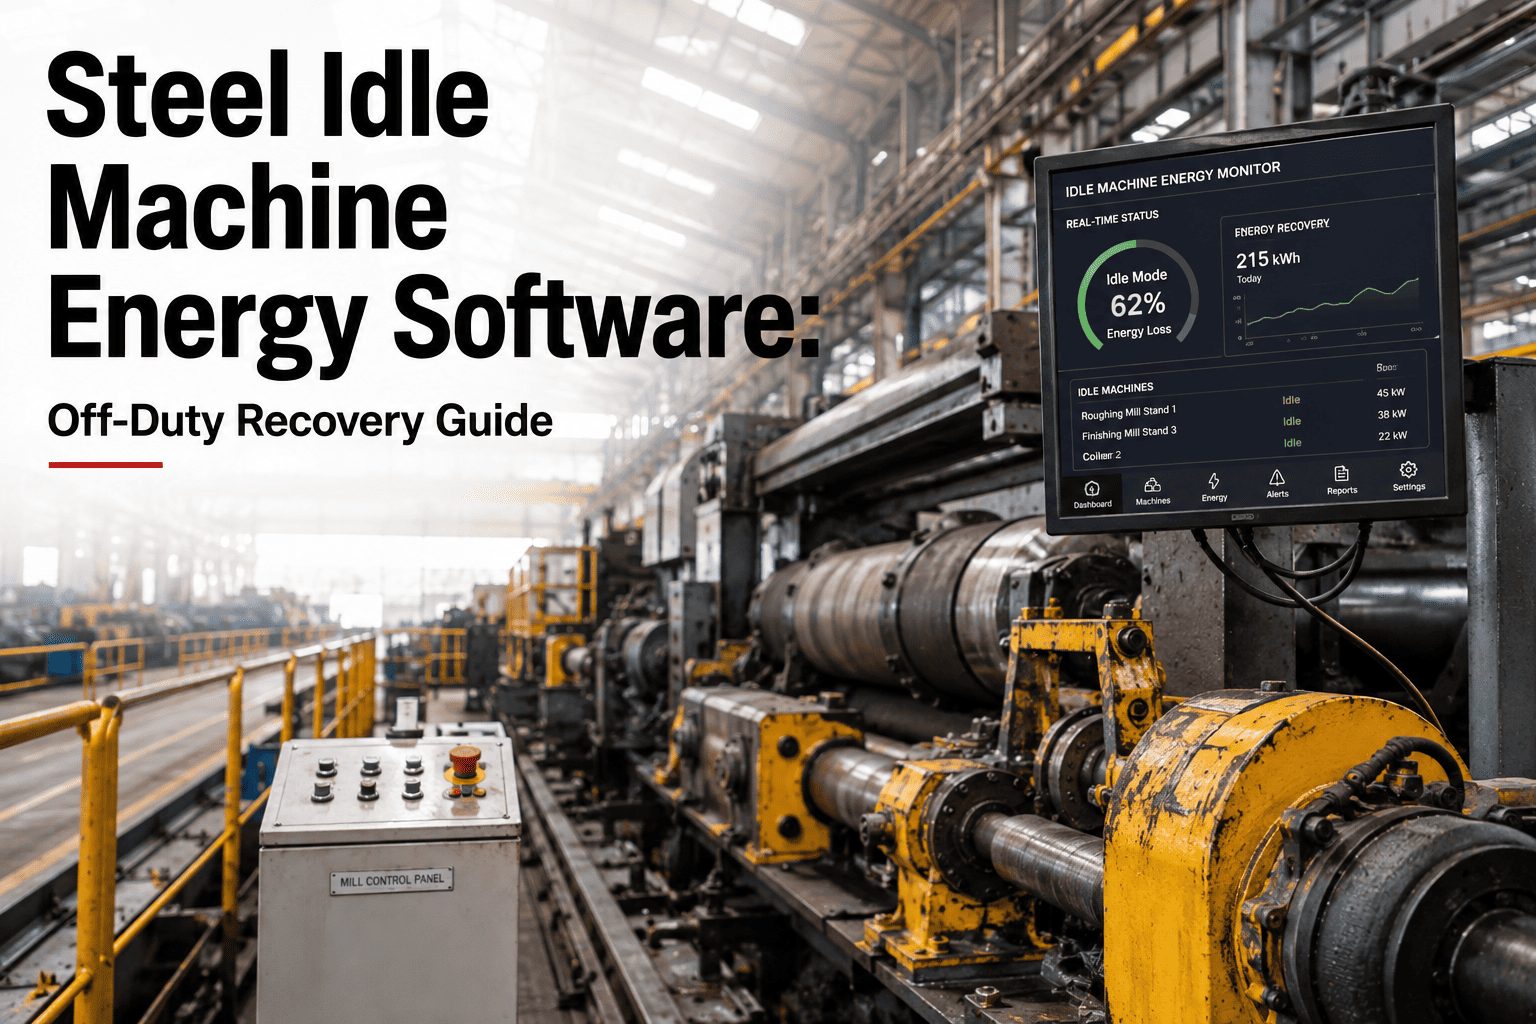
A rolling mill stands idle for forty minutes during a roll change, yet the run-out tables, cooling pumps, and drive motors keep pulling current the entire time. A walking beam furnace goes into "banking" mode between heats, burners still lit, still consuming gas and electricity while nothing moves through it. A gantry crane sits parked in the yard for six hours between lifts with its control cabinet and hoist brake energized the whole shift. None of this shows up as downtime on a production report, and none of it shows up as a fault on a maintenance log — it shows up only as a bigger number on next month's electricity invoice. Steel plants routinely lose 2 to 5 percent of total plant electricity to equipment that is neither producing nor properly shut down.
Why Idle Machines Are the Least-Watched Energy Drain in a Steel Plant
Every steel plant tracks tap-to-tap time, furnace throughput, and rolling mill utilization down to the minute. Almost none of them track what their equipment is drawing in electricity while it is not producing. A conveyor between the sinter plant and blast furnace keeps its drive motor energized through a two-hour maintenance hold on the downstream unit. A ladle preheating station stays hot between casts because relighting it takes longer than the gap between heats, so operators leave it running "just in case." A compressed air system built to feed pneumatic actuators across a rolling mill keeps compressing air at full pressure through a weekend shutdown because nobody scheduled a controlled ramp-down. Individually, each of these looks like a reasonable operating decision. Added together across hundreds of motors, drives, furnaces, cranes, and auxiliary systems, they become a silent second production cost that never appears on an OEE dashboard.
The reason this loss persists is structural, not careless. Energy metering in most steel plants happens at the substation or department level, not at the individual asset level, so a motor that draws 60 percent of its running current while idling is invisible inside an aggregate load reading. Maintenance software tracks whether an asset is broken or scheduled for service, not whether it is switched on but doing nothing. And production scheduling tracks heats, casts, and coils, not the electrical state of the equipment sitting between them. Book a demo to see how machine-state and energy data can be connected inside one CMMS. Without that connection, idle loss compounds quietly, heat after heat, shift after shift, invoice after invoice.
Every Idle Motor and Banked Furnace Is Billing You for Work It Never Did
Oxmaint links machine run-state to real electricity draw across your steel plant floor, flags idle loss the moment it exceeds a set threshold, and turns it into a work order — not a mystery on next month's bill.
Where Idle Load Hides Across a Steel Plant Floor
Idle energy loss does not sit in one department — it is spread across nearly every asset class in the plant, and each one hides it differently. A rolling mill drive idles between coils because restarting under load is harder on the motor than leaving it spinning unloaded. A reheating furnace stays partially fired between charges because full shutdown and relight costs more in refractory stress than the gas burned holding temperature. A baghouse fan keeps running at full speed during a partial line stoppage because nobody wants to risk a dust event by cycling it. None of these are wrong decisions in isolation — they are just decisions made without visibility into their cumulative electrical cost.
Idle Load by Asset Class
The table below breaks down where idle electrical loss typically concentrates across a steel mill, based on the asset classes that show up most often in energy audits of integrated and mini-mill operations.
| Asset Class | Typical Idle Trigger | Idle Draw vs Full Load | Common Root Cause |
|---|---|---|---|
| Conveyor Drive Motors | Upstream or downstream hold, material delay | 30-50% | No auto-stop interlock with feed source |
| Rolling Mill Drives | Coil change, roll change, threading delay | 40-60% | Restart-under-load avoidance habit |
| Reheating Furnace Burners | Banking between charges | 25-45% of full-fire gas rate | Relight time exceeds gap between heats |
| Overhead Cranes | Waiting between lifts, shift gaps | 15-30% | Control cabinet and brake left energized |
| Compressed Air Systems | Partial line stoppage, weekend hold | 35-55% | No scheduled ramp-down protocol |
| Cooling Water Pumps | Furnace or mill hold, non-production window | 50-70% | Circulation kept running "for safety margin" |
Your Idle Load Table Above Is a Real Cost. Ours Turns It Into a Recovery Plan.
Oxmaint maps every asset in your plant against its own idle threshold, not a generic industry number, so the work orders it generates match your actual equipment and schedule.
How the Detection-to-Recovery Loop Works
Recovering idle machine loss is not a one-time energy audit — it has to run continuously, because idle patterns shift with production schedules, crew habits, and seasonal maintenance holds. Oxmaint builds this as a closed loop rather than a static report.
Idle Recovery vs Generic Energy Monitoring
Most plants that try to solve this problem start with a standalone energy dashboard. The gap is always the same: a dashboard shows that consumption is high, but it cannot tell a shift supervisor which specific asset to act on or generate the work order to fix it.
Energy Reporting Standards This Maps To
Idle load recovery is not just an internal cost-saving exercise for most steel producers — it now feeds directly into external energy and sustainability reporting obligations. Oxmaint's asset-level idle data is structured to support the frameworks steel plants are already reporting against.
What Plants See After Deploying Idle Recovery
Getting Started: A Four-Week Path to Live Idle Data
Plants do not need a full energy management overhaul to start recovering idle loss. Oxmaint is designed to layer onto existing motor control centers, drives, and PLCs without new wiring in most cases.
Frequently Asked Questions
How is idle machine loss different from downtime loss?
Do we need new sensors on every machine to start?
How does the system tell the difference between a necessary hold and wasted idle time?
Can idle recovery data be used for ISO 50001 or ESG reporting?
How long before we see measurable savings?
Stop Paying Full Price for Machines That Are Doing Nothing
Connect your motor control data, set your idle thresholds, and let Oxmaint turn every overstayed hold into a work order instead of a line item on your electricity bill.