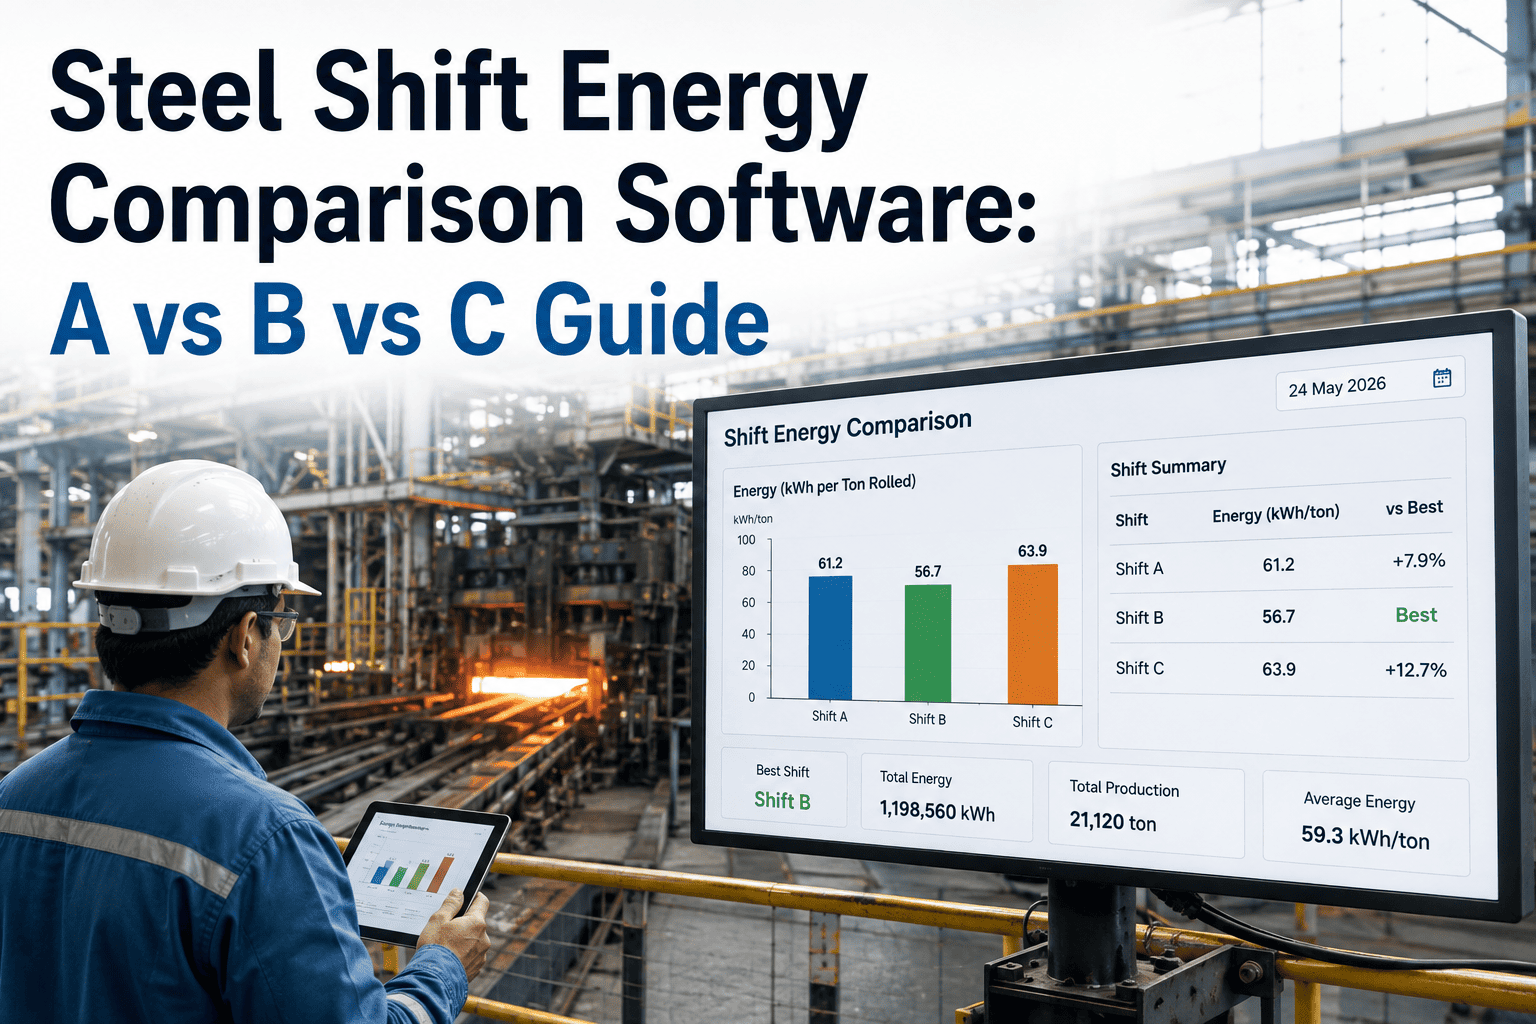
Same furnace, same product, same shift length — and three different energy numbers depending on who is running the floor. It shows up quietly at first: a slightly longer ramp-up on one rotation, a setpoint nudged and never reset, a hydraulic system left pressurized during a changeover. None of it looks like a problem on any single day. Compared shift over shift, month after month, it becomes a real and repeatable gap between A, B, and C crews doing the same job. Steel shift energy comparison software exists to turn that gap from a supervisor's hunch into a number everyone can see and coach against. See how shift-by-shift energy breaks down against the same asset inside OxMaint.
Steel Plant CMMS · Shift Energy Comparison
A vs B vs C: Turn Shift Energy Variance Into Data-Driven Coaching
The same equipment, run by three different crews, rarely produces the same kWh per ton. This guide shows how to compare shifts fairly, what actually drives the gap, and how to turn a variance number into a coaching conversation instead of a blame game.
9.8%
above baseline recorded on a night shift in one documented furnace case
1.2%
above baseline on the day shift running the exact same furnace
15–30%
efficiency loss typical of poorly tuned or poorly maintained combustion equipment
Per Shift
the resolution most energy dashboards never break data down to
The Real Problem
Why Monthly Energy Totals Hide the Gap Between Shifts
Most plants report energy at the level of a day, a week, or a month. That resolution is exactly wrong for catching shift variance, because three shifts of very different performance can average out into one unremarkable monthly number. In one documented case, a plant monitoring an arc furnace discovered within its first month of tracking that the night shift was running 9.8% above the furnace's baseline energy consumption, while the day shift on the exact same equipment ran only 1.2% above baseline. Averaged across the month, that difference would have disappeared into a single, forgettable total.
Broken out by shift, it became something a supervisor could actually act on. The gap was not random noise — it was a repeatable pattern tied to how that particular crew ran startup, held setpoints, and handled the changeover. That is the entire case for shift-level energy comparison: it turns an invisible average into a visible, coachable pattern.
The Scoreboard
What a Shift Comparison Actually Looks Like
Instead of one energy number for the day, three numbers — one per crew — sitting side by side against the same baseline.
Shift A · Day
Closest to baseline
Shift B · Evening
Typically sits between the other two
Shift C · Night
Furthest from baseline in most documented cases
This pattern is common but not universal — the point of comparing shifts is finding out whether your plant actually follows it, and by how much, rather than assuming it does.
What Actually Differs
Four Things That Genuinely Change Between Crews
Startup & Shutdown Timing
Whichever shift inherits a cold start carries a longer, higher-energy ramp-up before the process stabilizes.
Setpoint Discipline
A manual override made mid-shift and never reset to standard quietly carries into the next crew's numbers too.
Changeover Handling
Auxiliary drives and hydraulics left running during a handover add up across a full rotation, shift after shift.
Staffing & Experience Mix
A crew running lighter on experienced operators tends to hold tighter procedures less consistently, especially under time pressure.
See Your Own A vs B vs C Numbers, Not a Guess
Stop assuming which crew runs hottest. Connect your metering data to shift schedules and see the actual variance on your own furnaces, mills, and drives.
The Workflow
How a Fair Shift Comparison Actually Gets Built
01
Data Tagged by Shift
Every meter reading is time-stamped against the shift schedule, not just the calendar date.
02
Normalized by Volume
Consumption is compared as kWh per ton, not raw kWh, so a busier shift is not unfairly flagged.
03
Checked Against Baseline
Each shift's number is compared to the asset's own rolling baseline, built from its own recent history.
04
Flagged If Persistent
A single high day is noise. The same shift running above baseline for two or more weeks is a pattern worth a conversation.
Root Causes
Common Root Causes Behind a Persistent Shift Gap
| Root Cause | Where It Usually Shows Up | What to Check |
|---|---|---|
| Startup / Shutdown Timing | Whichever shift inherits a cold start | Ramp-up procedure adherence and warm-up duration |
| Equipment Left Idling | Overnight and changeover windows | Auxiliary drives and hydraulics running with no active load |
| Setpoint Drift | Whichever shift last adjusted a setpoint | Manual overrides never reset back to standard |
| Maintenance Backlog | Shifts running with fewer available technicians | Deferred repairs concentrating wear on one rotation |
Side by Side
Manual Shift Logs vs Shift Energy Comparison Software
| Capability | Manual Logs & Spreadsheets | Shift Energy Comparison Software |
|---|---|---|
| Variance visibility | Buried inside end-of-month totals | Broken out by shift automatically every day |
| Root cause | Reduced to "night shift is just worse" | Tied to a specific asset and behavior pattern |
| Coaching data | Anecdotal, hard to act on fairly | A specific number a supervisor can coach against |
| Consistency check | Rarely repeated month to month | Tracked continuously, so improvement is visible |
From the Field
What Supervisors Say Once Shifts Are Compared Fairly
5 / 5
We always assumed night shift ran hotter, but nobody had a number to back it up, so it stayed an argument instead of a fix. Once we could see the actual kWh per ton gap on our own furnace, it stopped being a blame conversation and became a specific procedure the night crew was skipping during changeover.
SS
Shift Supervisor
Integrated Steel Plant, Melt Shop
4 / 5
The part that made this useful was normalizing by tons produced. Without that, our busiest shift always looked like the worst one just because it made more steel. Once the comparison accounted for volume, the real pattern was completely different from what we assumed.
EM
Energy Manager
Mini-Mill, Rolling Division
Common Questions
Steel Shift Energy Comparison — Frequently Asked Questions
Is comparing shifts by energy meant to single out a crew?
No. Used well, it points at a specific behavior or procedure gap rather than a person, and it works best when supervisors treat it as a coaching tool. Start a free trial to see the comparison view.
Does the comparison account for shifts producing different volumes?
Yes. Consumption is normalized to kWh per ton before shifts are compared, so a busier shift is not unfairly flagged just for producing more.
How many weeks of data before a shift gap is considered real?
A single high shift is usually noise. Most plants treat two or more consecutive weeks of the same shift running above baseline as a genuine pattern worth investigating.
Can this data feed into existing energy or ISO reporting?
Yes. Shift-level energy performance data rolls up into the same asset-level totals used for broader energy performance and ESG reporting. Book a demo to see the rollup.
What is the first step to start comparing our own shifts?
Connect existing meter or sub-meter data to your shift schedule so readings are tagged by crew, then let a few weeks of data build a baseline before drawing conclusions.
Steel Plant CMMS · Shift Energy Comparison
Give Every Shift a Fair, Visible Number
Stop letting shift variance hide inside a monthly average. Compare A, B, and C against the same baseline, and turn the gap into a coaching conversation your supervisors can actually run.