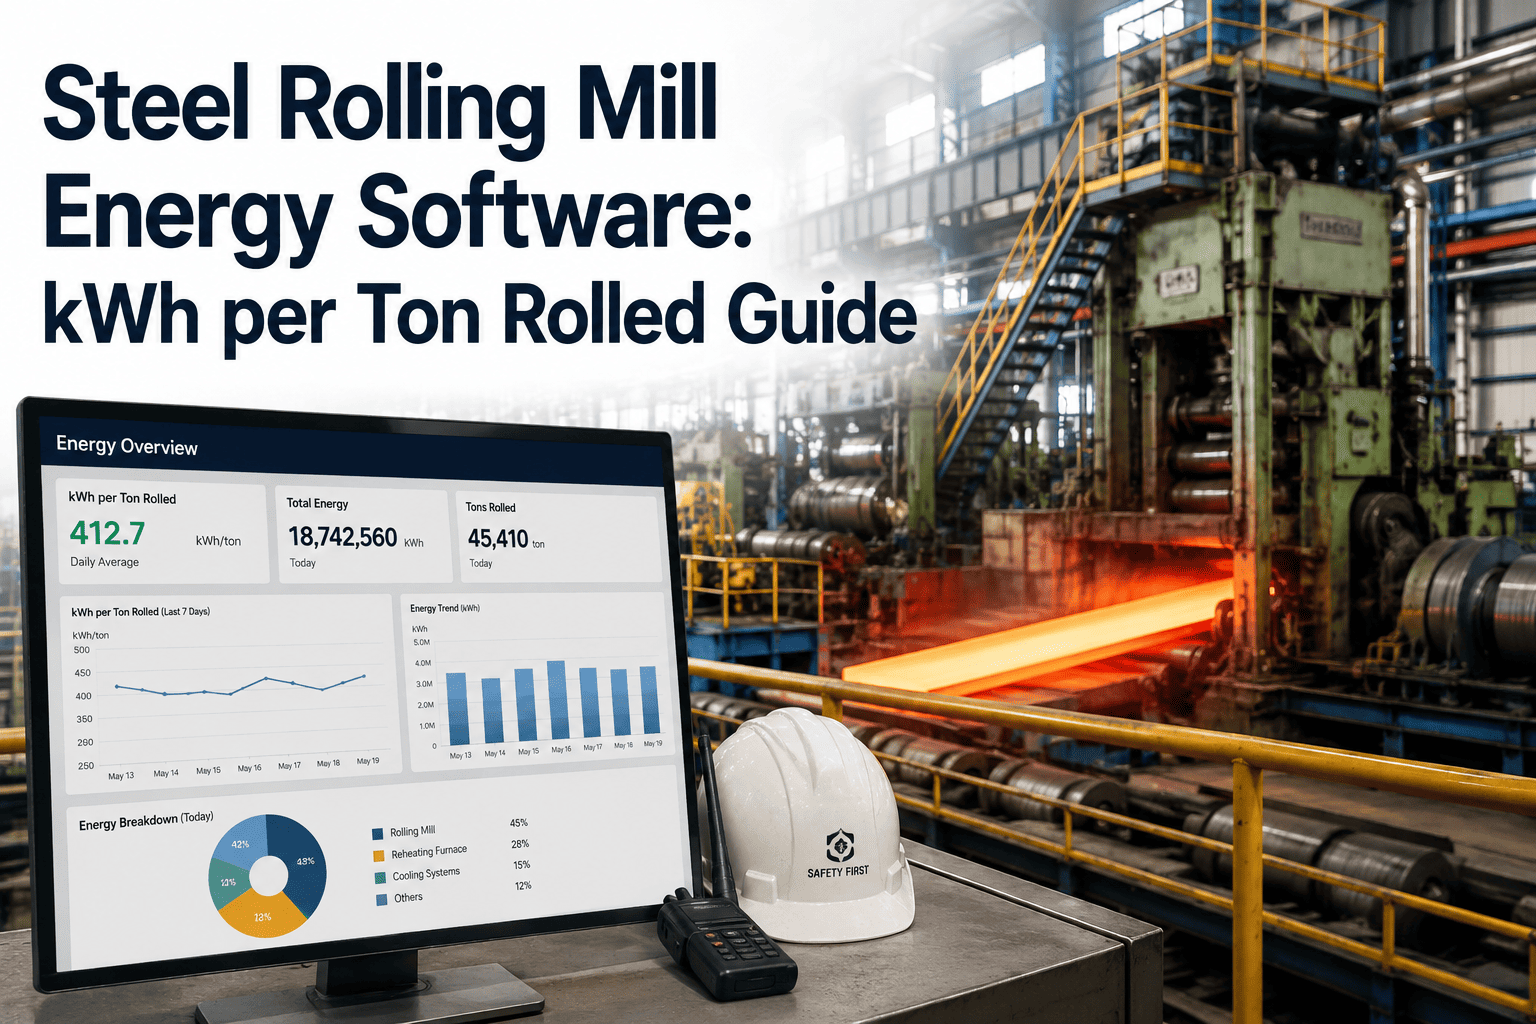
A rolling mill that used to run at 85 kWh per ton rolled and now runs at 98 kWh per ton is not announcing that change anywhere. No alarm fires. The bill just arrives a month later, larger than expected, with no line item explaining why. Somewhere between a main drive motor losing efficiency, a hydraulic screwdown cylinder working harder than it should, and a pass schedule that has quietly drifted from its optimized reduction ratios, the mill is spending more energy to make the same ton of steel. Rolling mill energy software exists to catch that drift the week it starts, not the month it shows up on an invoice. See how kWh per ton, motor loading, and hydraulic power draw connect to a live work order inside OxMaint.
Steel Plant CMMS · Rolling Mill Energy KPIs
Turn kWh per Ton Rolled Into a KPI You Can Actually Act On
Rolling mills are one of the most energy-intensive processes in a steel plant. This guide breaks down where that energy actually goes, the benchmarks to measure against, and how to catch a motor or hydraulic system quietly drifting off baseline before it shows up on next month's bill.
50–80
kWh per ton typical for an efficient hot rolling mill
15–25%
of total plant electricity typically consumed by rolling operations
60–70%
of a rolling mill's own energy use goes to reheating, not rolling itself
20–30%
downtime-related energy waste cut when predictive maintenance is added
The Real Problem
Why kWh per Ton Is the KPI Energy Managers Actually Trust
Total kilowatt-hours consumed tells you almost nothing on its own — a mill running more tons naturally uses more power. kWh per ton rolled strips production volume out of the equation and leaves the number that actually reflects efficiency. A mill that holds steady at 70 kWh per ton across a busy month and a slow month is running well. A mill that creeps from 70 to 78 kWh per ton regardless of volume has a problem hiding somewhere in its drives, its hydraulics, or its pass schedule.
The trouble is that this drift almost never shows up as a single dramatic event. A motor bearing degrading over weeks pulls a little more current for the same load every day. A hydraulic seal wearing down makes a screwdown cylinder work slightly harder to hold the same pressure. Individually, each change is too small to notice on a control room screen. Added together across a full production run, they can move a mill's kWh per ton by 10 to 15 percent — the difference between a competitive operating cost and a quiet, ongoing loss.
Energy Breakdown
Where a Rolling Mill's Energy Actually Goes
Most of what a rolling mill spends power on is not the rolling itself. Reheating the steel to rolling temperature dominates the energy bill, with the mechanical deformation and auxiliary systems splitting the rest.
Reheating furnaces and associated heat loss through walls, flue gas, and radiation
Main drive motors performing the actual deformation pass by pass
Hydraulic screwdown, gauge control, cooling, and other auxiliary systems
Benchmarks
kWh per Ton Benchmarks by Mill Type
| Mill Type | Typical Energy Use | What Moves the Number |
|---|---|---|
| Hot Rolling Mills | 50–80 kWh per ton | Pass design, automation level, and reheating stability |
| Cold Rolling Mills | 150–300 kWh per ton | Higher deformation forces and tighter precision tolerances |
| High-Speed Wire Rod Mills | Above the hot rolling baseline | Finishing block speed and cooling system load |
| Integrated Mill, Total Electricity | 400–600 kWh per ton of crude steel | Full plant figure spanning melting, casting, and rolling combined |
Energy Intensity Scale
Where Does Your Mill Sit on the Scale?
For full integrated plants measured in GJ per tonne of crude steel, the spread between best-in-class and poorly maintained operations is wide enough to represent tens of dollars per ton in fuel cost alone.
The gap between the world-class end of this scale and the industry average end typically represents a fuel cost difference of $40 to $80 per tonne of steel at current energy prices — and maintenance-driven degradation nobody has linked to the energy meter is a recurring reason plants sit on the wrong end of it.
The Three KPIs
The Three Numbers Energy Managers Actually Track Daily
01
kWh per Ton Rolled
Normalizes total rolling energy against actual output, so the number reflects efficiency and not just how busy the mill was that shift.
02
Motor Loading Percent
Shows whether main drive motors are running near their efficient operating band or drifting toward a derated, higher-loss zone.
03
Hydraulic Power Draw
Flags pressure and flow anomalies in screwdown and gauge control systems — often the earliest sign of a leaking cylinder or worn seal.
Stop Finding Out About Energy Drift a Month Later
Connect your motor, hydraulic, and metering data to one baseline, and let a deviation open a work order the same day it happens — not after the bill arrives.
Root Causes
What Actually Makes kWh per Ton Drift Without Anyone Noticing
Bearing & Motor Degradation
A motor drawing more current than its baseline for the same load is usually losing efficiency mechanically, not electrically.
Hydraulic Leaks & Worn Seals
A screwdown or gauge control cylinder working harder to hold pressure quietly adds kWh with no visible change in output.
Pass Schedule Drift
A rolling schedule that has wandered from its optimized reduction ratios spends more energy per ton without anyone changing a setting on purpose.
Idle & Standby Losses
Auxiliary drives and hydraulics left running during changeovers and delays add up across a full shift.
The Workflow
From Meter Reading to Work Order
01
Baseline Set
Thirty days of metering data establish a normal kWh-per-ton range for each asset, accounting for production volume and mode.
02
Live Reading Compared
Every new meter or sensor reading is checked against that asset's own baseline in near real time.
03
Deviation Flagged
A reading outside the configured threshold is flagged and linked to the specific motor, cylinder, or drive responsible.
04
Work Order Opened
A diagnostic work order is created automatically against that asset, instead of a number sitting in a monthly report.
Case Snapshot
What Closing the Gap Is Typically Worth
120 → 85
kWh per ton achievable modernizing an underperforming mill's drives and controls
5–8
kWh per ton reduction from main motor efficiency improvements alone
2–3 yrs
typical payback when energy optimization drives a modernization project
Side by Side
Monthly Energy Reports vs Real-Time CMMS Energy Monitoring
| Capability | Manual Monthly Reports | Real-Time CMMS Monitoring |
|---|---|---|
| Detection speed | Deviation surfaces in next month's report | Flagged same day against a live baseline |
| Root cause link | Energy and maintenance teams work separately | Deviation tied directly to the asset's work order history |
| Action taken | A number added to a spreadsheet | An automatic diagnostic work order |
| Audit documentation | Compiled manually before every audit cycle | Generated continuously from maintenance records |
From the Field
What Energy Managers Say Once Motor and Hydraulic Data Are Connected
5 / 5
Our energy team tracked monthly kWh totals and our maintenance team tracked equipment failures, and the two never talked to each other. Once we linked energy deviations to the actual asset record, we found bearing wear and hydraulic drift that had been quietly adding kWh per ton for months without a single alarm going off.
EM
Energy Manager
Integrated Steel Mill, Rolling Division
4 / 5
The number that changed how we ran the mill was motor loading, not the electricity bill itself. Watching that percentage drift over a few weeks let us schedule a bearing swap during a planned stop instead of finding out mid-run.
RE
Reliability Engineer
Hot Strip Mill Operations
Common Questions
Rolling Mill Energy Software — Frequently Asked Questions
Do we need new sensors to start tracking kWh per ton rolled?
Often not. Existing sub-meters and motor control center data can usually feed a baseline directly. Start a free trial to connect your first metering point.
How is motor loading different from just watching kWh consumed?
kWh consumed changes with production volume alone. Motor loading percent shows whether the motor is working efficiently for the load it is actually carrying, regardless of how busy the mill is.
What happens when a reading crosses the configured threshold?
A diagnostic work order opens automatically against the specific motor, cylinder, or drive responsible, instead of the deviation waiting for a monthly report. Book a demo to see the alert routing.
Can this data also support ISO 50001 or carbon reporting?
Yes. Energy performance indicators like kWh per ton rolled are a standard input for ISO 50001 energy performance tracking and Scope 1 emissions reporting once the data is captured continuously.
How long before a baseline is reliable enough to trust?
Roughly 30 days of consistent readings is typically enough to establish a dependable baseline, accounting for normal swings in production volume and operating mode.
Steel Plant CMMS · Rolling Mill Energy KPIs
Give kWh per Ton Rolled a Home Next to Your Work Orders
Stop treating energy drift and mechanical wear as two separate problems. Connect motor loading, hydraulic power draw, and kWh per ton to the same asset record maintenance already runs on.