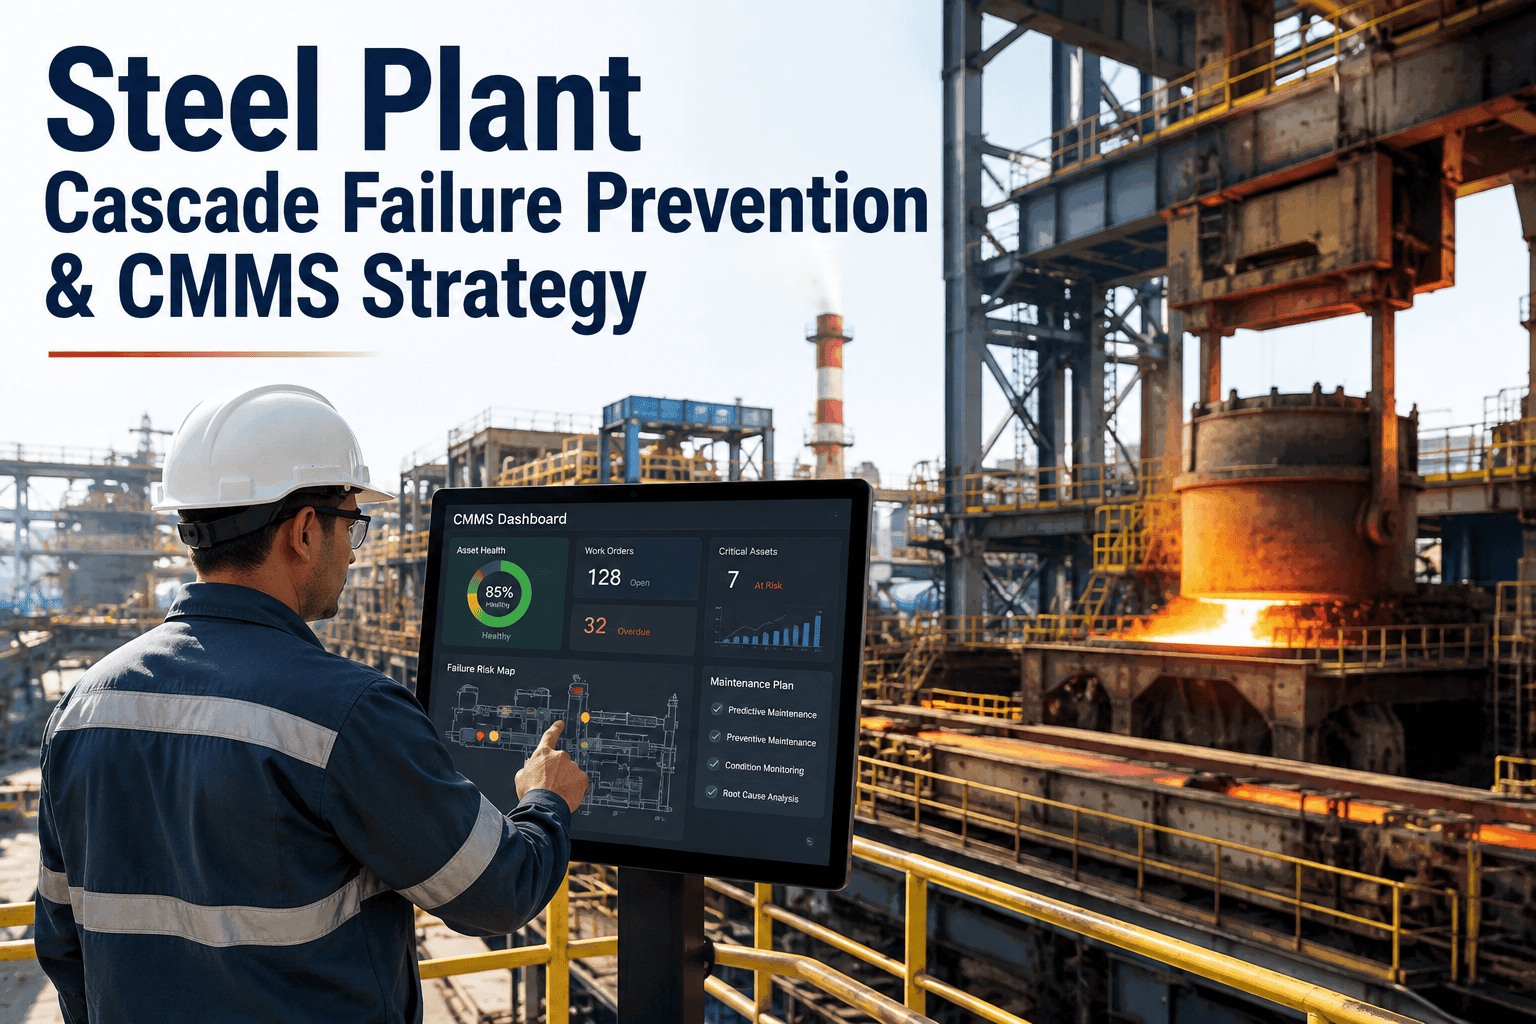
In an integrated steel plant, no piece of equipment fails alone. A blast furnace cooling leak halts ironmaking, the BOF runs out of hot metal, the caster breaks sequence, and the rolling mill idles within the hour — one stoppage, four departments, a single production day gone. This is a cascade failure, and it behaves nothing like an isolated breakdown. Preventing it starts with dependency mapping, criticality tiering, and a CMMS that scores every asset by how far its failure travels, not just how likely it is to fail. Ready to map your plant's cascade risk? Start Free Trial and see your dependency chain live in days.
One bearing fails at 6 AM. By noon, four departments are idle. Why?
Steel production has almost no buffer between process stages. A single 53-minute stoppage at one transfer point can generate 8+ hours of cascading delay across the plant. Cascade failure prevention is about mapping that chain before it triggers, not chasing the fire after it starts.
A single stoppage, multiplied across every downstream stage
Steel moves through 8 to 12 transfer points between raw material and finished coil — torpedo car, ladle crane, transfer car, roller table, slab transporter, finishing stand. Most of those points carry zero buffer, so a delay at one becomes a delay at all of them, compounding as it travels downstream.
Follow the chain — from tap hole to finished coil
Cascade prevention begins with treating the plant as a logistics chain, not a set of independent process stages. Each stage below depends on the one before it being on time, on spec, and in position.
Blast Furnace
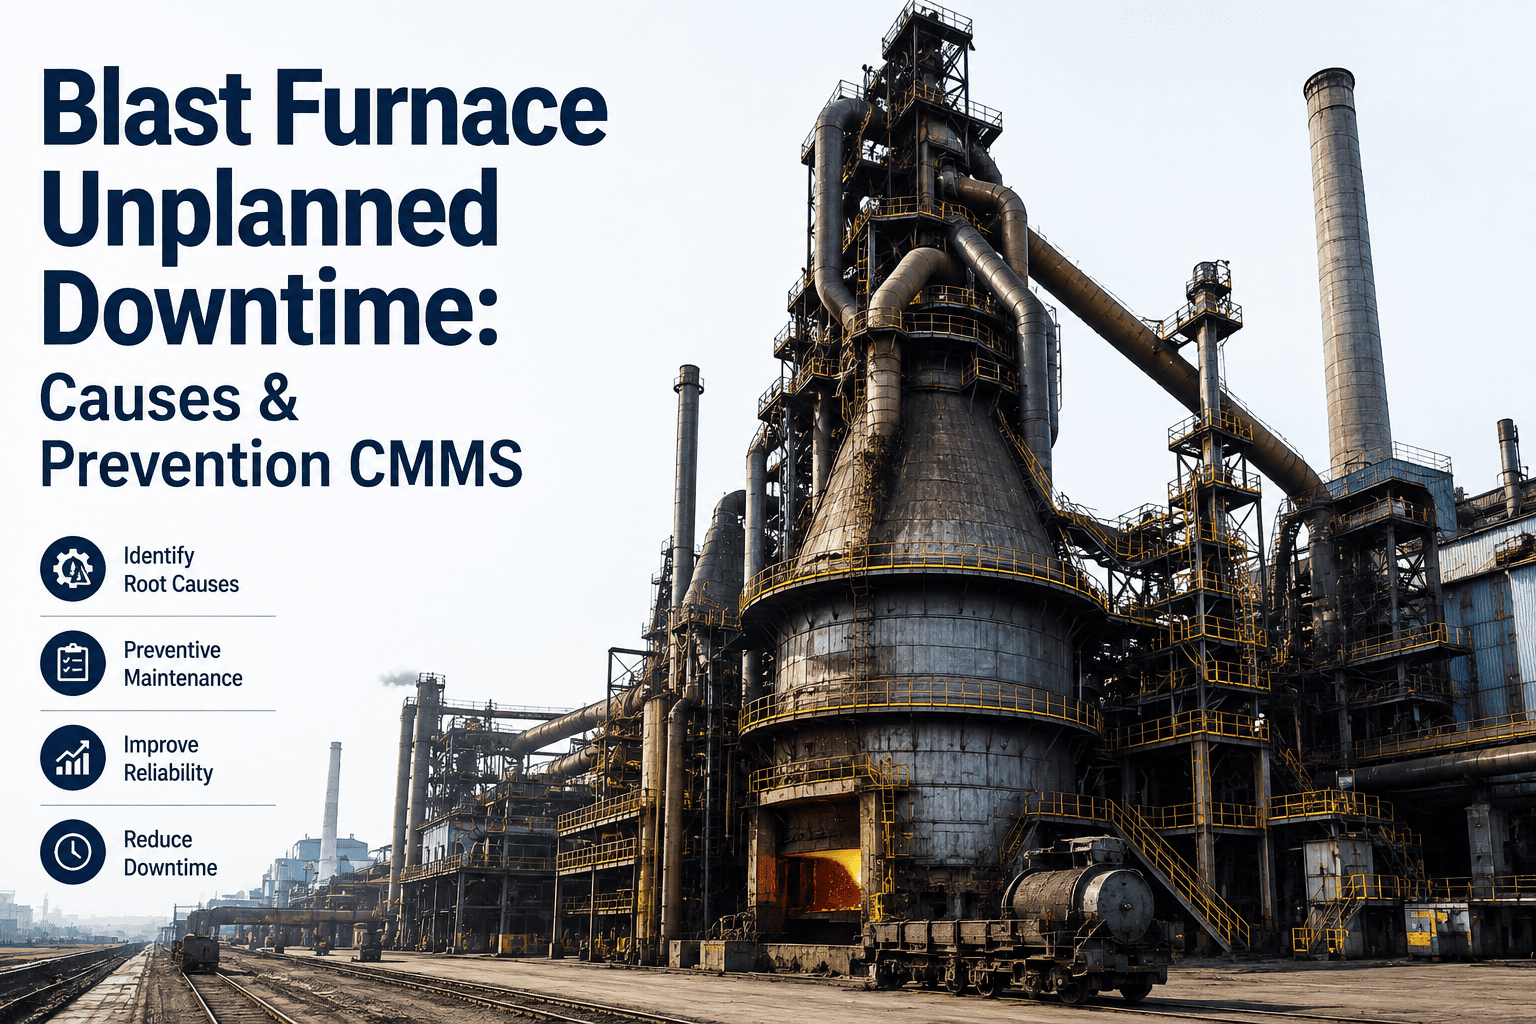
Taps hot metal on a fixed schedule. A cooling or blower failure forces an uncontrolled shutdown, not a pause.
Torpedo & BOF
Waits on hot metal delivery. A stalled torpedo car pushes back the entire blowing schedule immediately.
Caster
Needs ladle delivery on a tight window. A late ladle causes a sequence break — one of the costliest events in steelmaking.
Hot Rolling & Finishing
Strands slabs in the reheat furnace when upstream slows, and idles finishing stands when it stalls entirely.
Not every asset carries the same cascade weight
Standard criticality scoring ranks assets by failure probability and repair cost alone. Cascade-weighted tiering adds a third factor: how many downstream stages stop when this asset does, and how fast.
Blast furnace cooling systems, BOF vessels, casters. Failure here stops production plant-wide within the hour. These assets get the tightest PM windows and redundant monitoring.
Torpedo cars, ladle cranes, transfer cars. Failure here doesn't stop the plant directly, but breaks the timing sequence that every downstream stage depends on.
Individual finishing stands, coilers, auxiliary equipment with in-line redundancy. Failure here is contained and rarely propagates beyond its own station.
The formulas behind a defensible cascade risk score
A CMMS that only tracks failure history misses the propagation risk. These two calculations turn dependency mapping into a number you can act on and prioritize against.
Higher weight means less slack in the system before a local failure becomes a plant-wide event. Assets with zero buffer capacity carry the maximum weight regardless of how reliable they otherwise are.
This score, not raw downtime hours, should drive PM frequency and spares stocking decisions for Tier 1 and Tier 2 assets.
A 4,500-cubic-meter blast furnace develops a minor cooling stave leak, a 2 to 3 millimeter gallery blockage invisible to weekly pressure checks. Left undetected, refractory erosion spreads to 8 to 12 adjacent staves within 48 to 72 hours, and a full shell hotspot can force an unplanned shutdown inside three weeks. Continuous thermocouple trending catches this leak in its first 24 hours — before it becomes a cascade at all.
What a cascade risk score actually looks like per asset
Below is a representative scoring table across common cascade-prone assets. Response window is the time available to intervene before the failure propagates downstream.
| Asset | Tier | Cascade Weight | Response Window | Downstream Stages Hit | Typical Loss |
|---|---|---|---|---|---|
| BF Cooling Stave | Tier 1 | High | 24-48 hrs | 4-5 | $18M-$45M |
| Torpedo Car | Tier 2 | Medium-High | Minutes | 3-4 | $36,500 avg event |
| Ladle Crane | Tier 2 | Medium | Under 1 hr | 2-3 | Sequence break risk |
| Finishing Stand | Tier 3 | Low | Hours | 0-1 | Localized only |
Tier 1 and Tier 2 assets account for a small fraction of total asset count but drive nearly all cascade-related production loss — which is exactly where cascade-weighted PM budgets should concentrate.
See your plant's dependency chain, scored and ranked
Oxmaint maps every downstream dependency, applies cascade-weighted criticality scoring, and flags Tier 1 and Tier 2 risk before it turns into a plant-wide event.
Four questions that surface cascade risk before it triggers
Which assets have zero buffer capacity between them and the next process stage — no spare car, no standby pump, no second line?
Are Tier 1 and Tier 2 assets on condition-based monitoring, or still on the same calendar PM schedule as low-impact equipment?
Does the work order for a Tier 1 asset automatically flag every downstream stage it can stall, or does that only happen after the call?
Is spares stocking weighted by cascade risk score, or by historical failure count alone?
We used to rank assets purely by failure history. Once we added cascade weighting — how many downstream stages an asset could stall, not just how often it broke — our torpedo car fleet moved from a mid-tier PM schedule to our tightest one. A single sequence break used to cost us most of a shift. We haven't had one in over a year.
Cascade failure prevention, answered
What exactly makes a failure a "cascade" instead of a normal breakdown?
A cascade failure is one where the original stoppage triggers a chain of dependent failures or delays downstream, because there's no buffer to absorb it. A bearing seizure that only stops one machine isn't a cascade — the same seizure on a torpedo car that backs up the BOF and breaks the caster sequence is.
How is cascade-weighted criticality different from standard asset criticality?
Standard criticality scores an asset by its own failure probability and repair cost. Cascade weighting adds how many downstream stages depend on it and how fast the impact travels — which is why a relatively cheap torpedo car can outrank equipment worth ten times more. You can Start Free Trial to see this scoring applied to your own asset list.
How much warning does a mill typically get before a cascade failure hits?
It depends on the asset. A cooling stave leak can give 24 to 48 hours of warning through thermocouple trending. A torpedo car or crane failure often gives minutes, which is why Tier 1 and Tier 2 assets need condition monitoring rather than periodic manual checks alone.
Can a small plant with fewer redundant lines still apply cascade scoring?
Yes — smaller plants with less redundancy actually benefit more, since every Tier 1 or Tier 2 asset carries a higher cascade weight when there's no standby equipment to absorb a failure. Scoring simply helps prioritize the limited PM hours available.
How often should cascade risk scores be recalculated?
Quarterly at minimum, and immediately after any change to buffer capacity, redundancy, or production sequencing. A newly added spare car or a decommissioned buffer tank changes the cascade weight of everything connected to it. Book a demo to see how Oxmaint recalculates scores as your plant configuration changes.
Stop the cascade before it starts
Dependency mapping, cascade-weighted criticality tiering, and condition monitoring on the assets that can take down the whole plant — all in one CMMS.
Free 14-day trial · No credit card