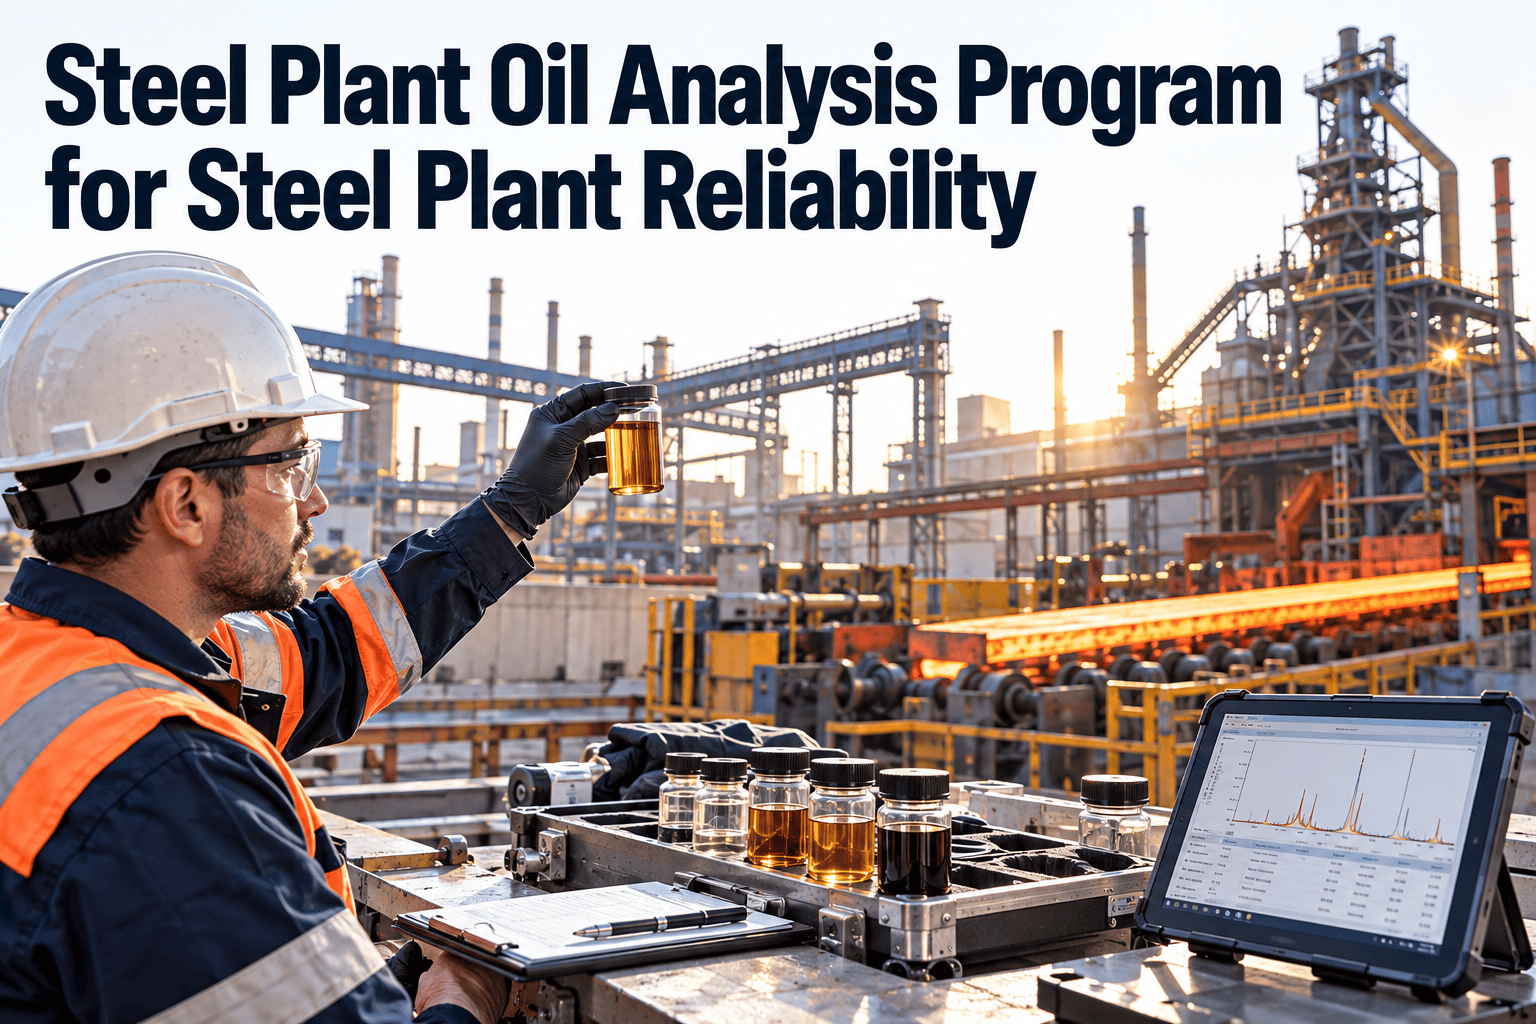
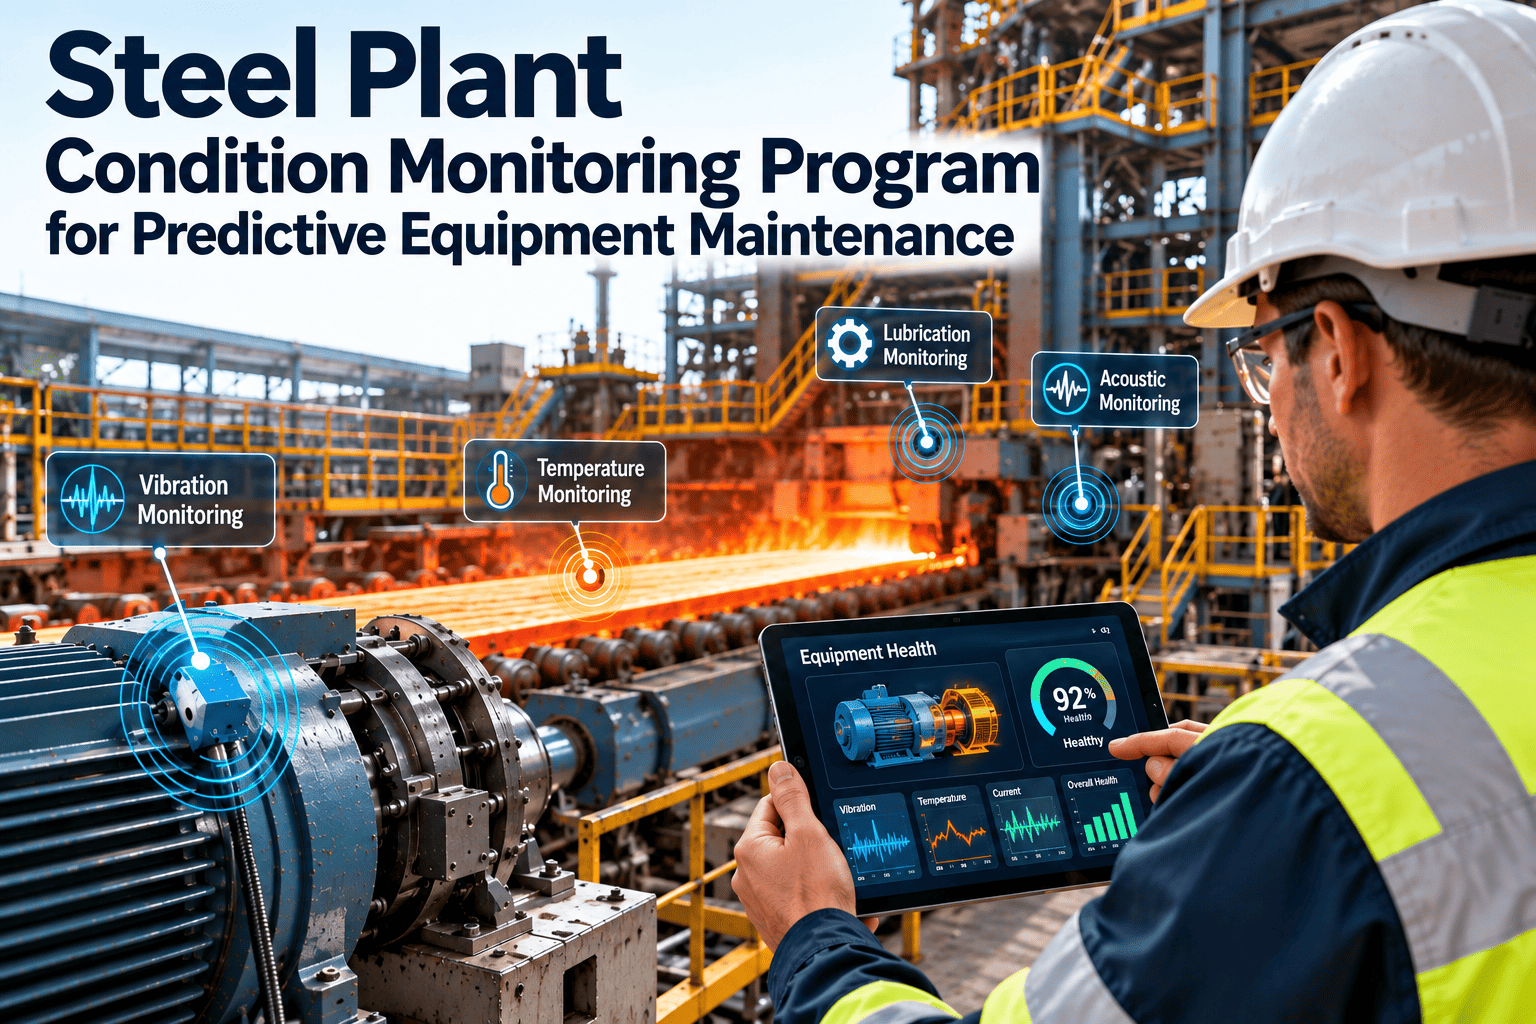
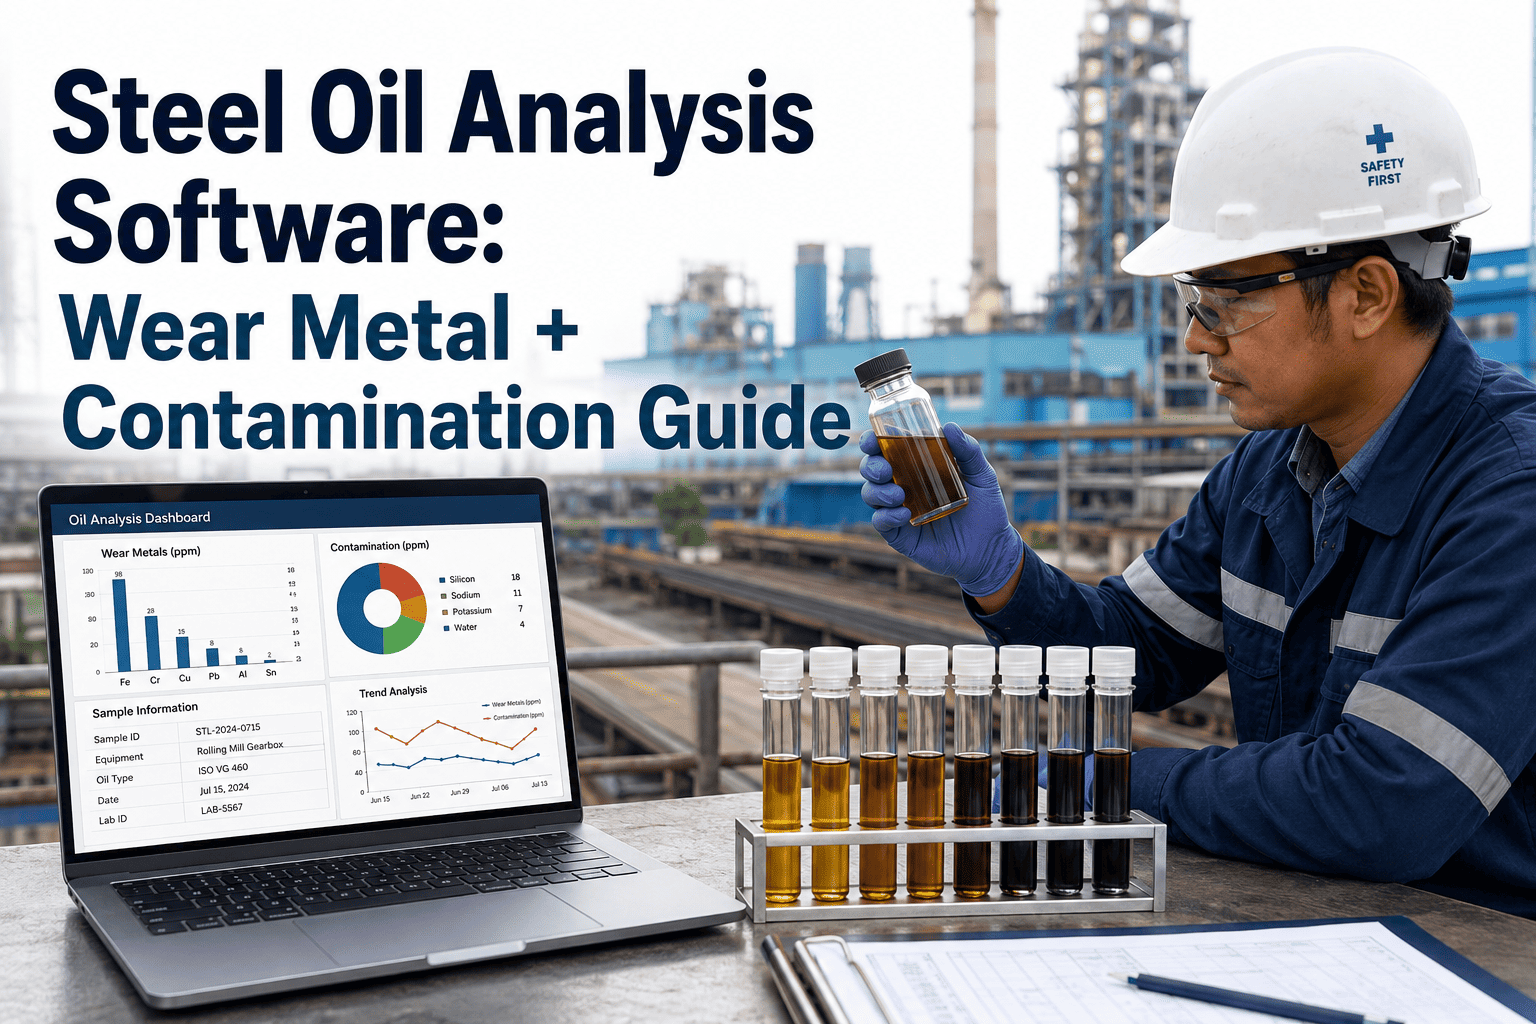
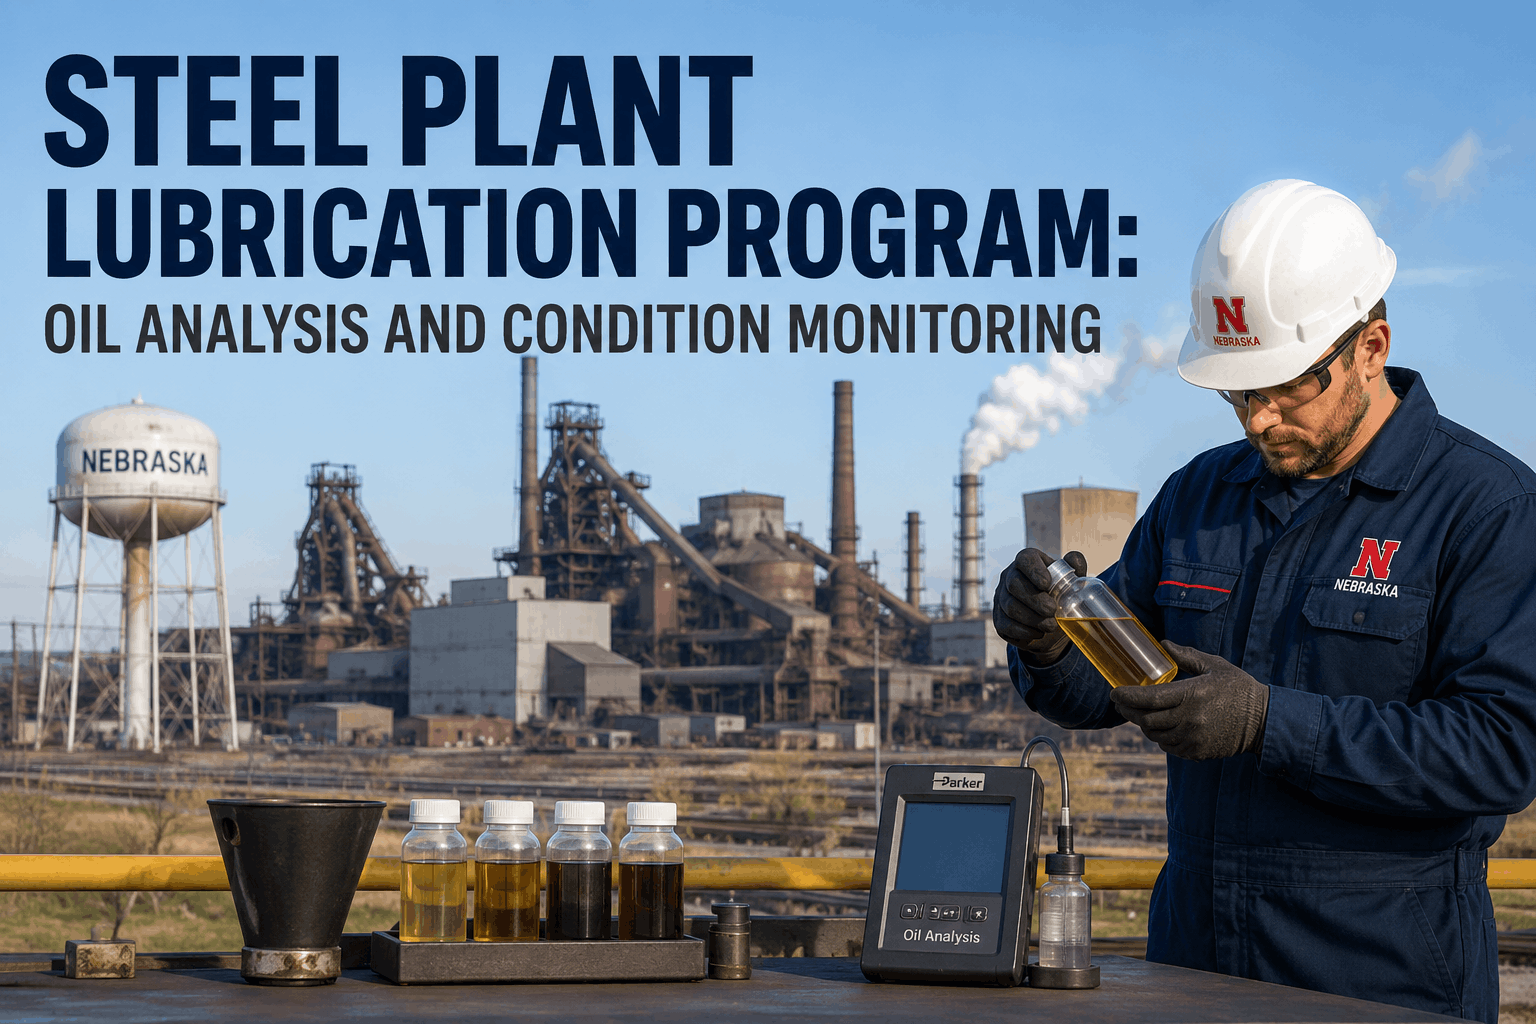
Oil analysis transforms maintenance from reactive crisis management into predictive intervention by monitoring lubricant health and wear particle signatures. Steel plant gearboxes, hydraulic systems, and circulating lube systems contain 500-5,000 gallons of lubricant operating at 40-100°C—conditions that constantly degrade fluid properties and generate wear particles. Technicians who examine oil only when equipment fails discover catastrophic damage: gear teeth already fractured, bearing raceways already spalled, sump already contaminated with secondary damage debris. Teams that monitor oil condition monthly or quarterly detect emerging degradation weeks before component failure occurs, enabling strategic maintenance intervention during planned downtime windows.
Detect Equipment Wear 6-12 Weeks Before Failure Occurs
OxMaint oil analysis module consolidates fluid sampling, lab reports, and particle count trending—showing maintenance teams when wear accelerates and component failure risk escalates before cascading secondary damage occurs.
The Hidden Failure Timeline: Why Oil Analysis Detects Wear Earlier Than Any Other Modality
Bearing degradation follows a predictable timeline. Microscopic spalling begins on a bearing raceway when material fatigue accumulation reaches critical threshold—but no vibration frequency change occurs yet. The spall grows over days and weeks, shedding 5-15 iron particles per sampling interval. At week 3-4 of spall development, vibration amplitude begins rising measurably; at week 6-8, vibration reaches ISO alarm thresholds triggering maintenance action. But oil analysis already detected wear escalation at week 2-3 when particle count first exceeded baseline trends. Steel plants that monitor oil but ignore vibration miss failures; teams that monitor vibration but skip oil analysis miss even more failures. Integration of both modalities—with oil analysis functioning as early warning and vibration analysis confirming failure mode diagnosis—delivers maximum failure detection window.
Gearbox degradation shows the same pattern. Tooth micropitting begins generating 20-50 ferrous particles per 100 mL of oil per day. Oil analysis particle count rises 30-50% over baseline within 2 weeks. Vibration spectra may show no measurable change for 4-6 more weeks. Technicians monitoring only vibration miss the intervention opportunity entirely. Gearbox teeth typically fail catastrophically within 8-12 weeks of detectable micropitting—leaving a narrow response window that oil trending captures but vibration alone misses.
Iron particles in oil directly indicate bearing and gear wear rates. Trending ferrous particle counts over 6-12 month periods shows degradation acceleration that predicts failure timing. A bearing shedding 5-10 particles/100mL/month is stable; 50+ particles/month indicates failure risk within 6-8 weeks requiring immediate intervention.
Lubricant contamination (dirt, water, oxidation products) accelerates wear rates 5-10x over clean oil conditions. ISO 15/13/10 code baseline for most steel plant gearboxes; degradation to 17/15/12 indicates accelerated wear requiring urgent oil change. Trending cleanliness codes shows whether environmental contamination or equipment wear is primary degradation driver.
Lubricant viscosity decrease indicates oxidation and thermal breakdown. A 46-cSt gearbox oil dropping to 40 cSt viscosity shows oxidation acceleration requiring oil change within 4-8 weeks. Acid number (TAN) elevation above 0.5 mg KOH/g indicates corrosive oxidation products attacking metal surfaces—accelerating wear beyond normal rates.
Water in steel plant lubricants accelerates rust formation and wear particle generation. Water content above 500 ppm (0.05%) triggers corrosion in gearboxes and hydrostatic bearings. Monthly or quarterly Karl Fischer water analysis shows whether environmental sealing failures or condensation are introducing moisture—enabling preventive desiccant breather upgrade or system redesign.
Iron concentration trending shows whether wear is stable or accelerating. Normal bearing wear generates 50-150 ppm Fe; 250+ ppm indicates accelerated wear requiring intervention. Copper, tin, lead, and aluminum presence indicates bronze bushings, babbitt bearings, or aluminum components degrading—helping technicians identify which components are wearing.
Total Base Number (TBN) tracks detergent and anti-wear additive availability. TBN dropping from initial 8.0 to 4.0 mg KOH/g shows additive depletion reducing corrosion protection. When TBN falls below 2.0, oxidation and corrosion acceleration escalates—triggering oil change requirement even if particle count remains normal.
Steel Plant Oil Analysis Sampling and Interpretation Strategy
Establish Baseline Oil Condition from New Equipment Installation
Collect baseline oil samples within the first 100 hours of equipment operation to establish reference particle counts, viscosity, water content, and additive levels. Document baseline values for each asset in OxMaint. Baseline trending becomes reference point for all subsequent analyses—allowing interpretation of whether subsequent samples show improvement, stability, or degradation from known starting condition.
Develop Sampling Schedule Based on Equipment Criticality and Operating Conditions
High-consequence gearboxes and circulation systems warrant monthly sampling; medium-criticality equipment requires quarterly collection; low-risk systems may need only semi-annual monitoring. Accelerate sampling frequency during summer (higher oil temperatures accelerate oxidation) or after environmental contamination events. Create asset-specific sampling procedures document: sampling location, port identification, sample size, sample bottle type, and lab submission requirements—ensuring sampling consistency across technician shifts.
Select Oil Analysis Lab and Define Standard Test Panel
Choose lab capable of spectrometric particle analysis (ISO 4406 cleanliness code), Karl Fischer water analysis, viscosity at 40°C, acid number (TAN), and ferrous particle trending. Standard test panel for steel plant gearboxes and hydraulic systems should include particle count (ISO code), viscosity, water content (Karl Fischer), TAN/TBN, and wear metal spectrometry (Fe, Cu, Pb, Sn). Most ASTM-certified labs provide consistent results; select lab with rapid turnaround (2-4 day reporting) enabling prompt response to abnormal results.
Establish Severity Limits and Automated Alert Thresholds
Define alert thresholds for each asset based on OEM recommendations and facility failure history. Typical thresholds: ISO cleanliness code 18/16/13 (caution) / 19/17/14 (alert); ferrous particles 150 ppm (caution) / 250+ ppm (urgent); TAN 0.8 (caution) / 1.2+ (change oil); water content 500 ppm (caution) / 1000+ ppm (urgent). OxMaint monitors sample results against thresholds automatically and escalates alerts when values exceed limits—triggering work order generation for oil change or equipment inspection.
Develop Asset-Specific Maintenance Response Protocols
Document what maintenance action each alert triggers: ISO code 18/16/13 → schedule desiccant breather replacement within 2 weeks; ferrous particles 200+ ppm → schedule bearing/gear visual inspection and plan oil change within 4 weeks; TAN above 1.0 → plan oil change within 6 weeks. Clear protocols ensure consistent response and prevent "alert fatigue" where technicians ignore repeatedly-escalated alerts without clear action path.
Monitor Program Effectiveness and Adjust Sampling Based on Results
Track oil analysis ROI monthly: How many failures did oil analysis detect before catastrophic breakdown? How much unplanned downtime was prevented? Compare oil change cost and sample analysis cost against prevented failure cost. If specific equipment (blast furnace drive gearbox) shows 3+ successful early detections annually, justify increased sampling frequency. If low-criticality equipment shows stable oil condition for 12+ months, reduce sampling frequency to reduce cost. Continuous program tuning ensures cost-effectiveness.
Common Oil Analysis Pitfalls and Steel Plant Solutions
Collecting samples from dirty drain ports, using uncleaned bottles, or sampling immediately after equipment shutdown (while sediment is stirred up) produces contaminated samples showing falsely elevated particle counts. Teams interpret normal equipment condition as wear emergency, schedule unnecessary oil changes, and lose confidence in oil analysis program. Solution: Train technicians in sampling best practices—allow equipment to idle 10 minutes before sampling to allow settling, use clean ISO bottles, clean drain port area before sampling, collect from mid-stream rather than settling area. Implement quality control: duplicate samples from same drain should produce nearly identical results (within 5-10%). If duplicates vary >20%, repeat sampling to identify contamination vs. genuine particle increase.
Technician sees ISO code 16/14/11 sample result and notes "cleanliness is good per ANSI code" without examining whether cleanliness improved or degraded from prior samples. Over 6 months: samples progress 15/13/10 → 16/14/11 → 17/15/12 → 18/16/13, showing clear degradation trend toward alert threshold. Single-point interpretation misses this escalation; trending analysis catches it. Solution: OxMaint trending dashboard shows particle count and cleanliness code progression over time, highlighting acceleration or deceleration. Teach technicians to ask: "Is this parameter improving, stable, or degrading compared to the last 6 samples?" Degradation rate matters more than absolute value—stable 18/16/13 code may be acceptable if unchanged for 12 months; 16/14/11 code rising rapidly to 17/15/12 signals urgent attention even though code remains "acceptable."
Facility samples oil monthly but only performs basic ISO cleanliness code testing. Particle count increases from 15/13/10 to 18/16/13 over 3 months—but technician cannot determine whether elevation is from bearing wear, gear degradation, or external contamination ingress. Spectrometric analysis would show ferrous (Fe) concentration rising 50 ppm/month (bearing wear) versus stable copper levels (ruling out bearing cage degradation). Water analysis would reveal moisture ingress from broken breather (requiring desiccant replacement) versus normal operating moisture generation. Basic cleanliness code alone cannot distinguish failure modes. Solution: expand standard test panel to include spectrometric wear metals (Fe, Cu, Pb, Sn concentration), water content (Karl Fischer), viscosity at 40°C, acid number, and total base number. OxMaint interprets test results and recommends maintenance action: "Rising Fe with stable Cu indicates rolling element degradation, not cage damage; recommend bearing inspection within 3-4 weeks."
Maintenance team tracks oil analysis results in spreadsheets separate from CMMS work order history. Oil sample shows ferrous particle spike—but technician cannot cross-reference whether recent bearing replacement, gear overhaul, or maintenance activity explains the elevation. Without context, technician cannot distinguish "normal wear debris flushing after maintenance" (not concerning) from "accelerated wear indicating component failure" (urgent intervention required). Solution: integrate OxMaint with your CMMS to display oil analysis results alongside work order history for each asset. When particle count spikes, team immediately sees "bearing replaced 2 weeks ago—spike expected; normal flushing period is 3-4 weeks; monitor next sample." Context prevents false alarm and enables accurate interpretation.
Oil Analysis ROI and Failure Prevention Impact
| Equipment Type | Annual Sample Cost | Failure Cost (Unplanned) | Avg Failures Prevented Annually | ROI Year 1 |
|---|---|---|---|---|
| Rolling Mill Main Gearbox | $600-800 | $80,000-150,000 | 1-2 | 9,000%-18,000% |
| Blast Furnace Circulation System (Hydraulic) | $800-1,200 | $60,000-100,000 | 1-2 | 5,000%-12,000% |
| Material Handling Conveyor Drive | $400-500 | $30,000-50,000 | 0.5-1 | 6,000%-12,000% |
| Sintering Machine Motor/Gearbox | $700-900 | $50,000-80,000 | 0.5-1 | 5,500%-11,000% |
| Multi-Equipment Program (10+ assets) | $5,000-7,000 | Average $500,000-800,000 (prevented annually) | 5-8 prevented failures | 7,000%-15,000% |
Oil analysis ROI calculation is straightforward: average steel plant rolling mill gearbox failure costs $80,000-$150,000 in parts, emergency labor, and production downtime. Oil analysis program costs $600-800 annually to monitor that single asset. If program prevents just one major failure every 18 months, it delivers 20:1 ROI minimum. Most steel plants monitoring oil on 10-15 critical assets prevent 5-8 significant failures annually—translating to $400,000-$600,000 in prevented costs against $30,000-50,000 annual program investment. Multi-modal programs combining oil analysis with vibration and thermography prevent 70-85% of equipment failures, extending equipment life 3-5 years beyond reactive maintenance baseline.
How OxMaint Streamlines Oil Analysis Program Execution
Steel Plant Oil Analysis Best Practices
Successful oil analysis programs establish clear protocols that technicians follow consistently across shifts and years. Sampling location matters: gearbox sump samples should be taken from mid-depth (not surface where water accumulates, not bottom where heavy sediment settles), circulation systems should be sampled from the return line where flowing oil carries particles, and hydraulic systems should be sampled from the tank's low-point drain to catch accumulated debris.
Sample frequency requires discipline: monthly sampling on critical assets (rolling mill gearboxes, main circulation systems) shows degradation rate clearly; quarterly monitoring on medium-importance assets; semi-annual on low-risk equipment. Seasonal adjustments matter: summer months with higher ambient temperatures accelerate oxidation, warranting increased monitoring frequency. Post-maintenance sampling is essential: after bearing replacement or oil change, collect samples at 50, 200, and 500 operating hours to confirm normal flushing and detect whether newly-installed components are already showing abnormal wear.
Lab selection impacts program quality: ASTM-certified labs with rapid turnaround (2-4 days) enable prompt response to abnormal results. Avoid labs with 2-3 week turnaround—by the time results arrive, equipment may have failed. Establish direct communication channels with your lab: when unusual results appear (particle spike, water contamination, viscosity shift), contact lab immediately to verify sample integrity and discuss preliminary findings before taking corrective action.
Frequently Asked Questions
How often should oil samples be collected from steel plant equipment?
Critical equipment (rolling mill gearboxes, main circulation systems) requires monthly sampling; medium-importance equipment quarterly; low-risk assets semi-annually. Increase frequency during summer or after contamination events. Frequency should adjust based on results: stable equipment may reduce frequency; equipment showing degradation trends requires acceleration.
What is ISO cleanliness code and how do I interpret it for maintenance decisions?
ISO 4406 code (e.g., 16/14/11) represents particle count in three size ranges (≥4, ≥6, ≥14 micrometers). Code 15/13/10 is clean baseline; 18/16/13 indicates fouling acceleration; 19/17/14+ signals urgent intervention needed. Trending is critical: stable 18/16/13 for 12 months is acceptable; 16/14/11 rising to 17/15/12 within 3 months requires immediate action.
What ferrous particle concentration indicates bearing wear requiring intervention?
Normal bearing wear generates 50-150 ppm iron; 150-250 ppm indicates increased wear rate requiring close monitoring; 250+ ppm signals accelerated wear necessitating bearing inspection and probable replacement within 4-6 weeks. Trending matters: particles increasing 30+ ppm/month shows acceleration requiring faster response than stable 200 ppm level unchanged over 6 months.
How can contaminated samples be identified and prevented?
Contaminated samples show sudden particle spikes inconsistent with prior trends or abnormally high contamination compared to equipment condition. Prevention: train technicians in clean sampling technique, use new ISO-cleaned bottles, sample from mid-depth (not surface or bottom), allow settling before sampling, clean drain ports before collection. Quality control: duplicate samples from same drain should agree within 5-10%; if duplicates vary >20%, sample contamination is likely.
Should equipment be operated or shut down during oil sampling?
Equipment should operate normally until 5-10 minutes before sampling, then allowed to idle. Sampling immediately after shutdown captures sediment stirred up by flow; sampling without prior operation misses dissolved particles and fails to represent steady-state condition. Consistent procedure (always after 5-min idle) ensures comparable samples from same asset across weeks.
What is TAN and why does it matter for maintenance planning?
Total Acid Number (TAN) measures corrosive oxidation product accumulation in oil. New oil typically 0.1-0.2 mg KOH/g; rising above 0.8 indicates significant oxidation requiring attention; above 1.2 demands urgent oil change. Elevated TAN accelerates rust and wear rates 3-5x, so trending TAN prevents hidden wear acceleration and extends oil life accurately.
Can oil analysis detect bearing failures before vibration analysis does?
Yes. Bearing spalling begins shedding wear particles 2-4 weeks before vibration amplitude rises measurably. Oil analysis detects particle escalation during this window; vibration analysis detects the same failure only after spall size creates detectable frequency peaks. Multi-modal monitoring (oil + vibration) maximizes detection window; single-modality programs miss 15-30% of detectable failures.
How does water contamination accelerate equipment wear?
Water catalyzes rust formation on bearing raceways and gears, creating microscopic corrosion pits that initiate spalling. Water content above 500 ppm (0.05%) increases wear rates 2-3x; above 1000 ppm increases wear 5-8x. Water-contaminated oil requires immediate oil change and investigation of contamination source (broken desiccant breather, condensation, cooling water leakage) to prevent recurrence.
Customer Success: How One Steel Plant Reduced Gearbox Failures by 80% Through Oil Analysis
"Our mill was experiencing gearbox failures every 6-8 months across our rolling mills—catastrophic failures that cost $100,000+ each in parts, emergency labor, and production losses. We implemented OxMaint oil analysis program focused on our five main rolling mill gearboxes. First month of sampling showed that all five boxes had particle counts trending upward despite operating 'normally.' We contracted with OxMaint for spectrometric analysis showing ferrous wear escalation in three gearboxes—directly indicating gear tooth micropitting in early stages. We scheduled controlled oil changes and bearing inspections during planned downtime. In the following 18 months, we prevented six cascading gearbox failures that would have occurred under our historical pattern. Oil analysis program cost: $1,200/year. Prevented failure costs: $600,000+. More importantly, we shifted from reactive firefighting to planned maintenance—and our technicians gained confidence in condition data reliability. We've expanded oil monitoring to 15+ assets and trained our team in spectrometric interpretation and sampling best practices." — Plant Maintenance Director, Midwest Steel Mill
Detect Wear Before It Becomes Failure
OxMaint oil analysis module integrates sampling schedules, lab results, trending analysis, and work order generation—turning fluid condition data into early-warning failure prevention for your critical assets.