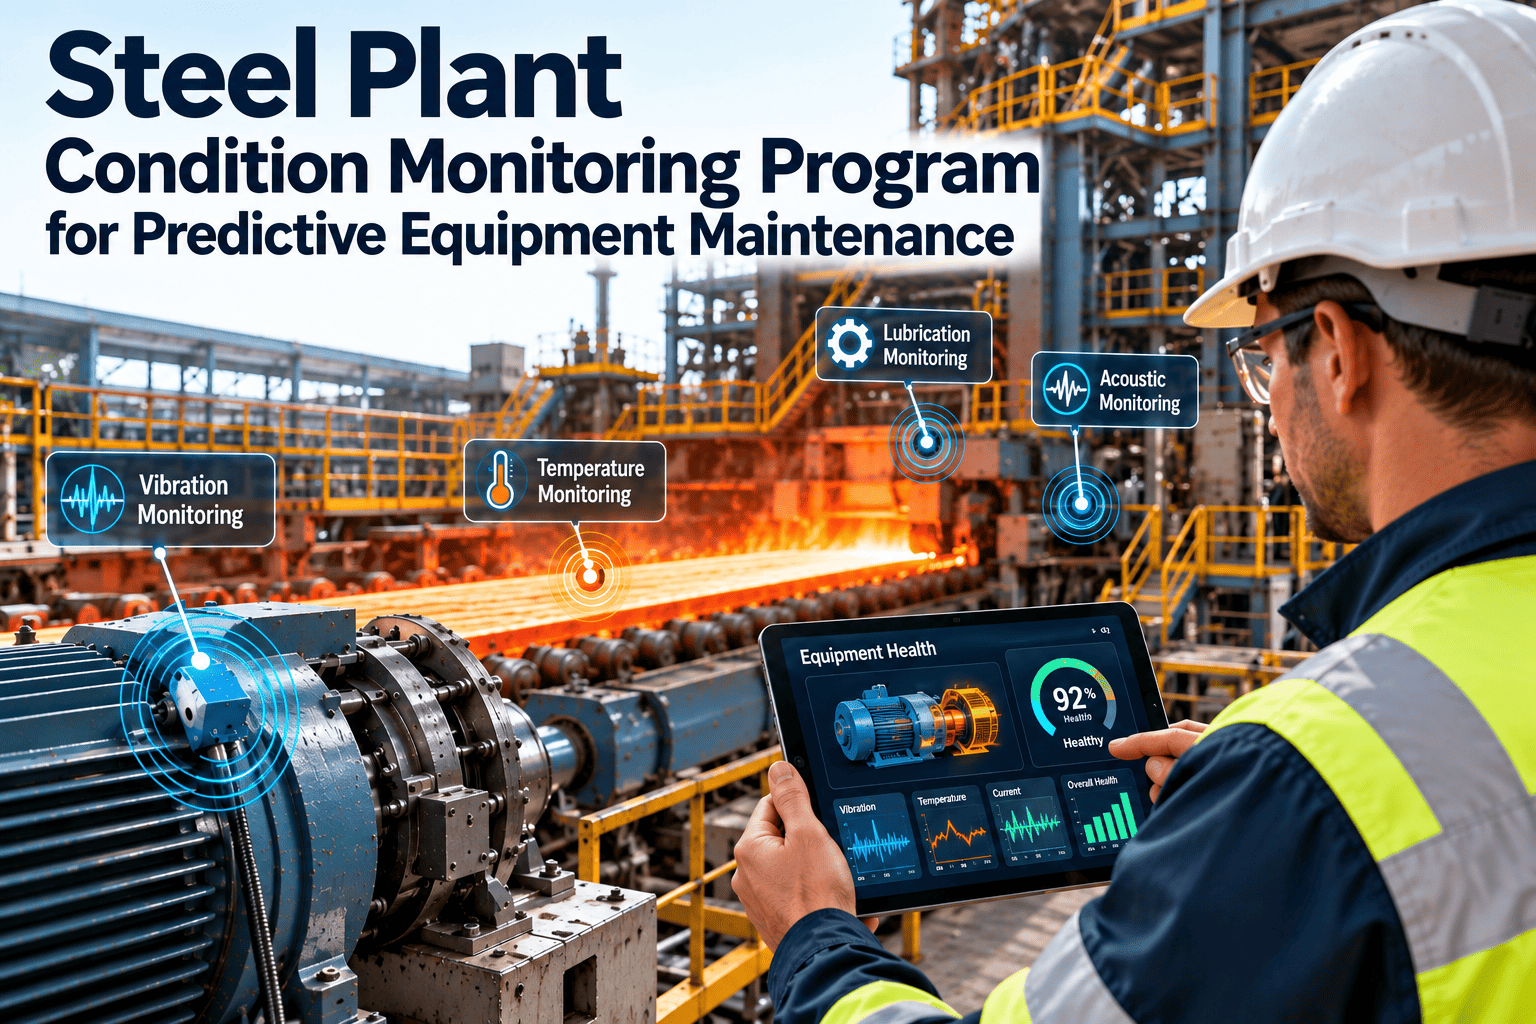
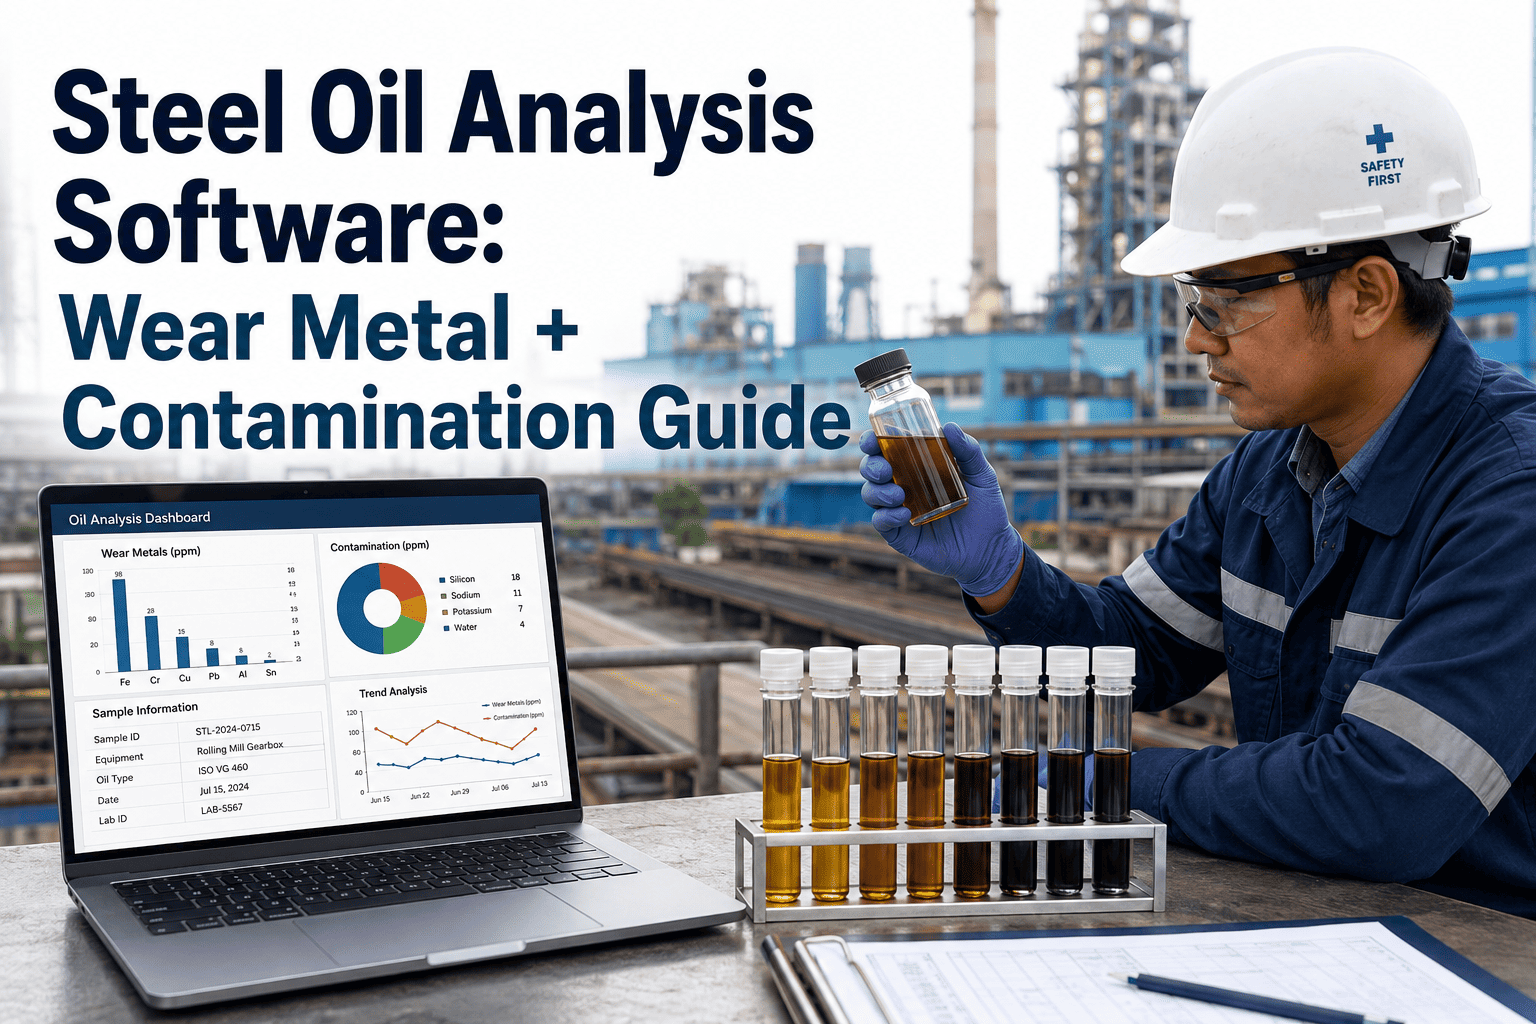
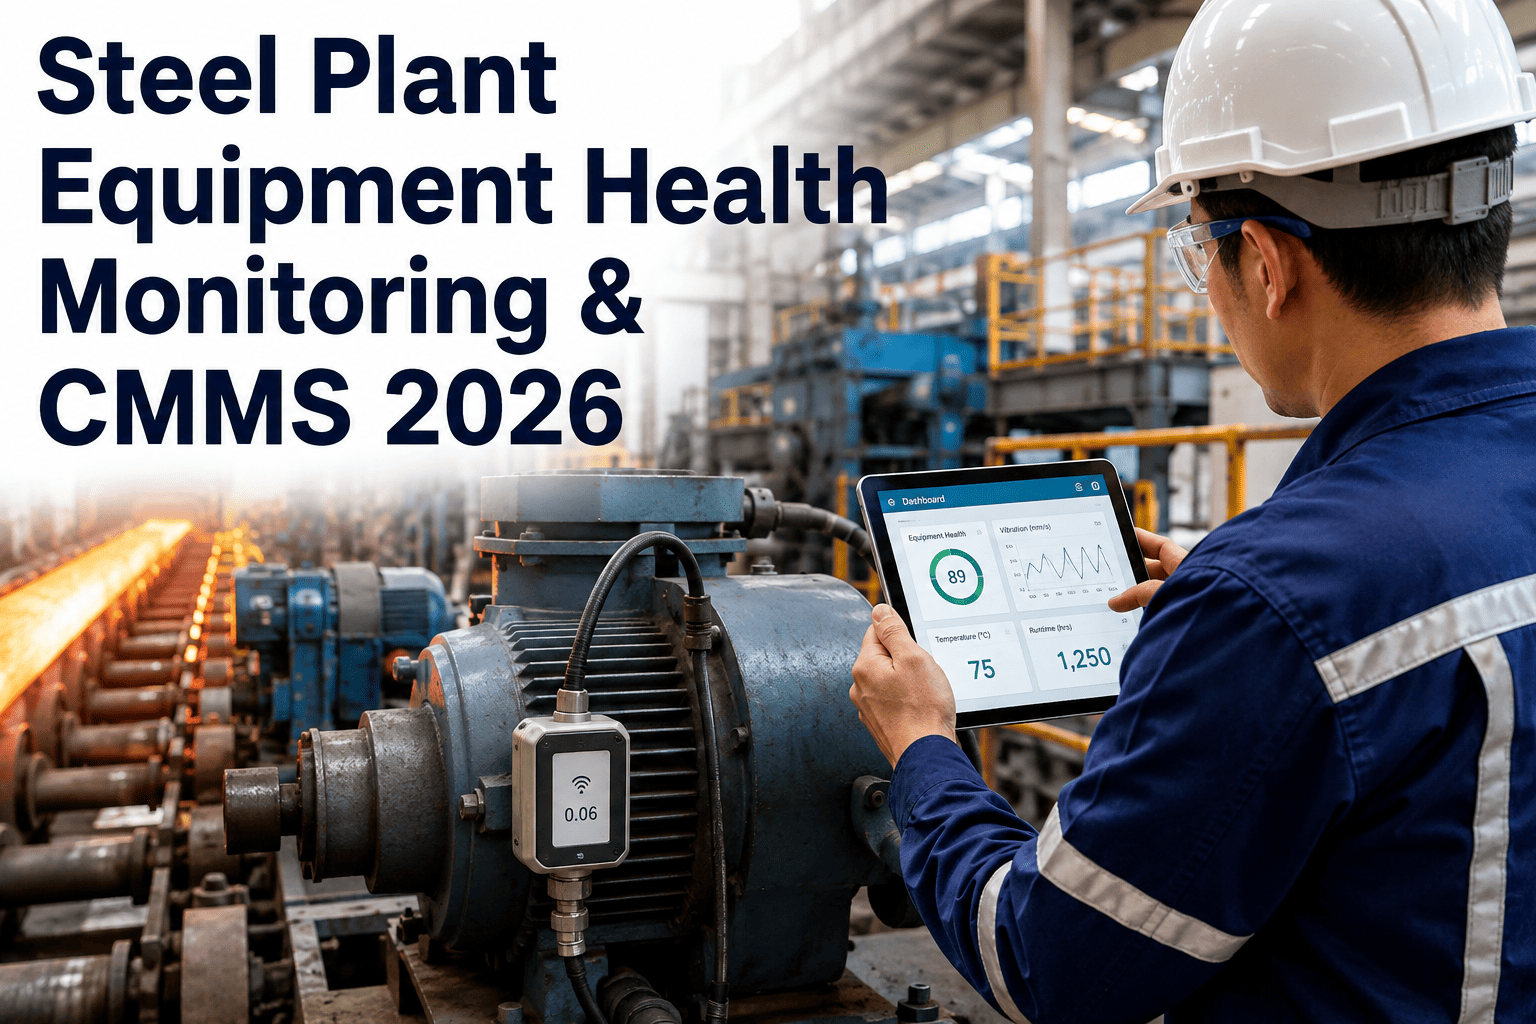
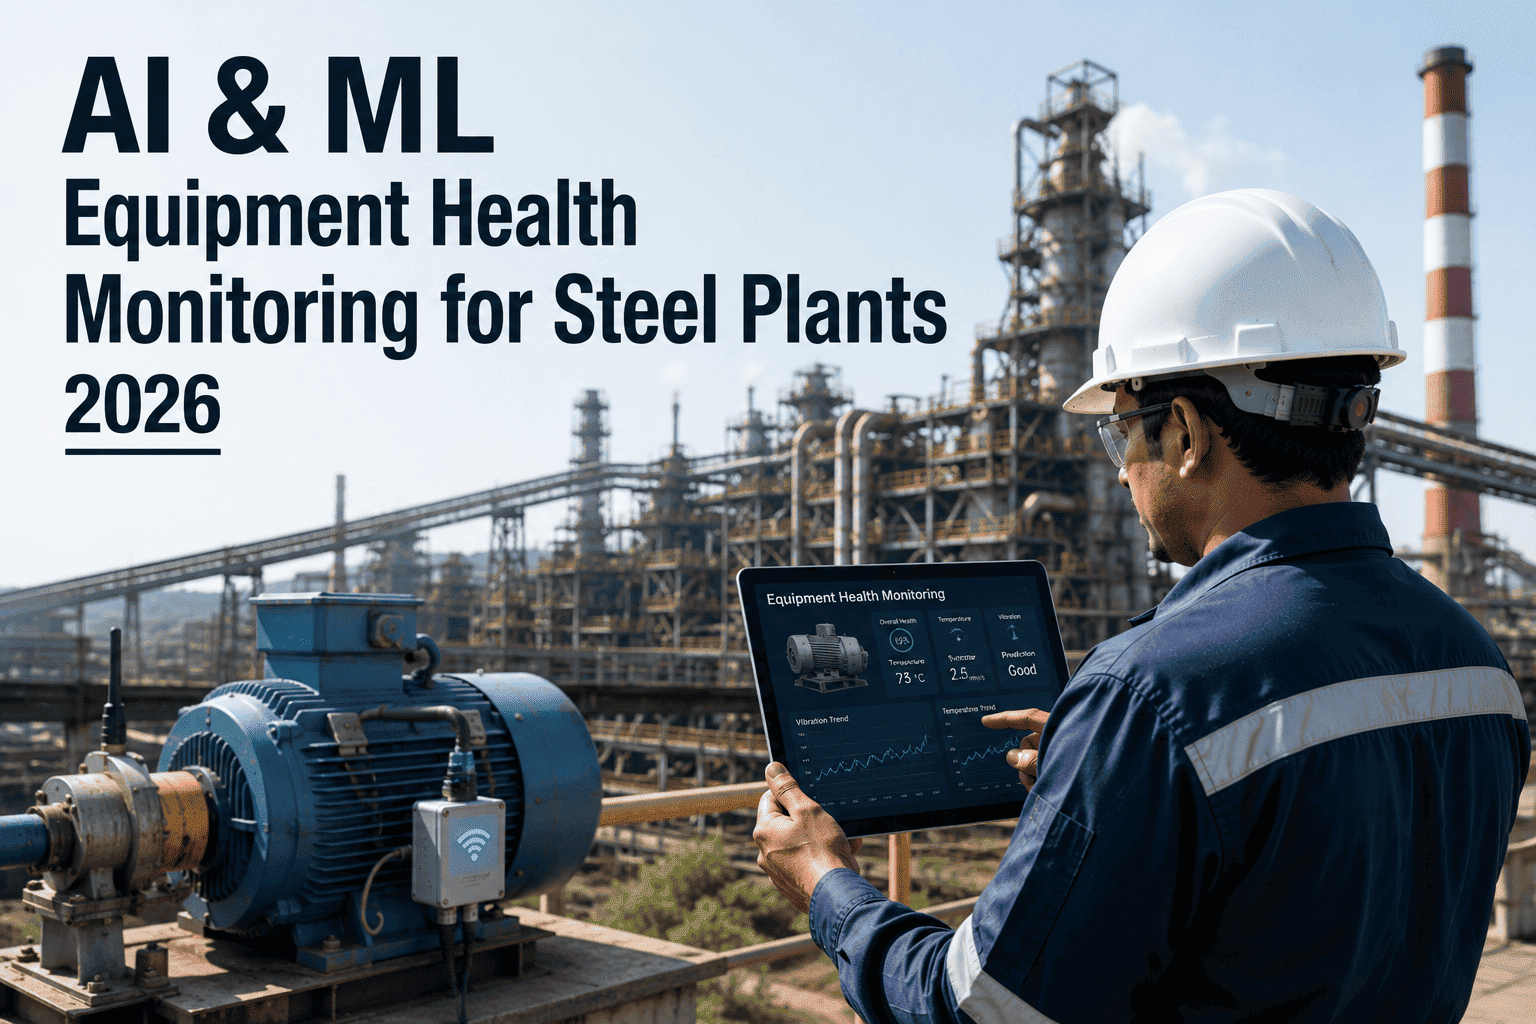
Steel plants with structured oil analysis detect 85% of lubrication failures before downtime, reduce lubricant consumption by 30-50%, and extend equipment life 3-5x versus time-based changes. Over 70% of equipment failures trace to contamination or degraded oil. A mid-size integrated mill saved $280,000 in lubricant costs in year one while catching critical failures months ahead. OxMaint’s CMMS‑integrated oil analysis platform turns sample data into predictive work orders — book a demo to see automated trending and alarm‑triggered actions.
Steel Plant Oil Analysis Program: Sampling, Testing & Equipment Health Assessment
Complete framework for effective oil analysis — sampling procedures, test parameters, wear trend analysis, contamination control, and CMMS‑integrated results management for hydraulic systems, gearboxes, and rotating equipment.
Why Oil Analysis Matters in Steel Plants
Oil analysis eliminates guesswork by providing objective data on lubricant condition, contamination, and wear metals. Steel plant equipment operates under extreme temperatures, shock loading, and contamination with scale, water, and fine particulates. Condition‑based decisions replace calendar‑based oil changes, avoiding both premature waste and catastrophic failures.
Proactive Contamination Control
Detects water, particles, wrong lubricant before damage begins.
Predictive Wear Monitoring
Identifies bearing, gear, pump wear months before vibration analysis.
Lubricant Life Optimization
Extends drain intervals based on data, not calendar.
Failure Documentation & Trending
Links oil results to asset history in CMMS.
Critical Sampling for Accurate Results
Automate Oil Analysis Workflows
OxMint generates sampling work orders, routes results to asset records, and triggers corrective actions on alarm.
Book a Demo Start Free TrialEssential Oil Analysis Tests
| Test | What It Measures | Alarm Condition |
|---|---|---|
| Viscosity at 40°C | Oil film thickness capability | ±10% from new oil baseline |
| ISO 4406 Particle Count | Solid contamination levels | Exceeds target by 2 ISO codes |
| Wear Metals (ICP) | Iron, copper, chromium etc. | Trending increase >50% over 3 samples |
| Water Content (KF) | Dissolved/free water | >500 ppm mineral oil, >200 ppm synthetic |
| Acid Number (TAN) | Oxidation & additive depletion | Increase >2.0 mg KOH/g |
| Ferrous Density (PQ) | Magnetic wear particles | >50 or doubling trend |
Trending vs Single‑Point Alarms
Individual snapshots matter less than trending. Gradual increases indicate progressive wear; sudden spikes signal acute events (e.g., component failure, contamination ingress). OxMaint automatically evaluates results against equipment‑specific thresholds, generates work orders for alarms, and tracks corrective actions. Integration eliminates manual data entry and closes the loop from sample to repair.
Auto Sample Registration
Scan asset QR code → work order completed, timestamp/hours logged.
Lab Results Upload
API push from LIMS → results populate asset history instantly.
Alarm Evaluation
CMMS checks thresholds & trends; flags deviations.
Auto Work Order
Alarm → prioritized work order with analyst recommendations.
Corrective Action Tracking
Technician logs repair; next sample verifies effectiveness.
ROI and Practitioner Success Factors
Best‑in‑class programs show 10:1 ROI. One integrated mill saved $280,000 in lubricant costs and avoided a $120,000 gearbox replacement. Critical success factors: start with critical assets, standardize sampling with photos, configure equipment‑specific alarm limits (not generic defaults), and always close the loop with corrective action verification.
“We eliminated 70% of scheduled oil changes as unnecessary while catching bearing failures months early. The key was CMMS integration — results auto‑populate asset records and generate work orders, so the program runs itself.”
Launch in 4 Phases
Identify critical assets; document current practices; select lab with CMMS integration.
Install sampling valves; configure CMMS asset records; train technicians.
Three sampling cycles to establish normal ranges and set meaningful alarm limits.
Auto‑scheduled sampling, real‑time result review, corrective action tracking, KPI monitoring.
Common Oil Analysis Questions
Turn Oil Reports Into Action
OxMaint eliminates the gap between lab results and maintenance execution — automatic trending, alarm‑triggered work orders, and corrective action tracking built into your equipment records.