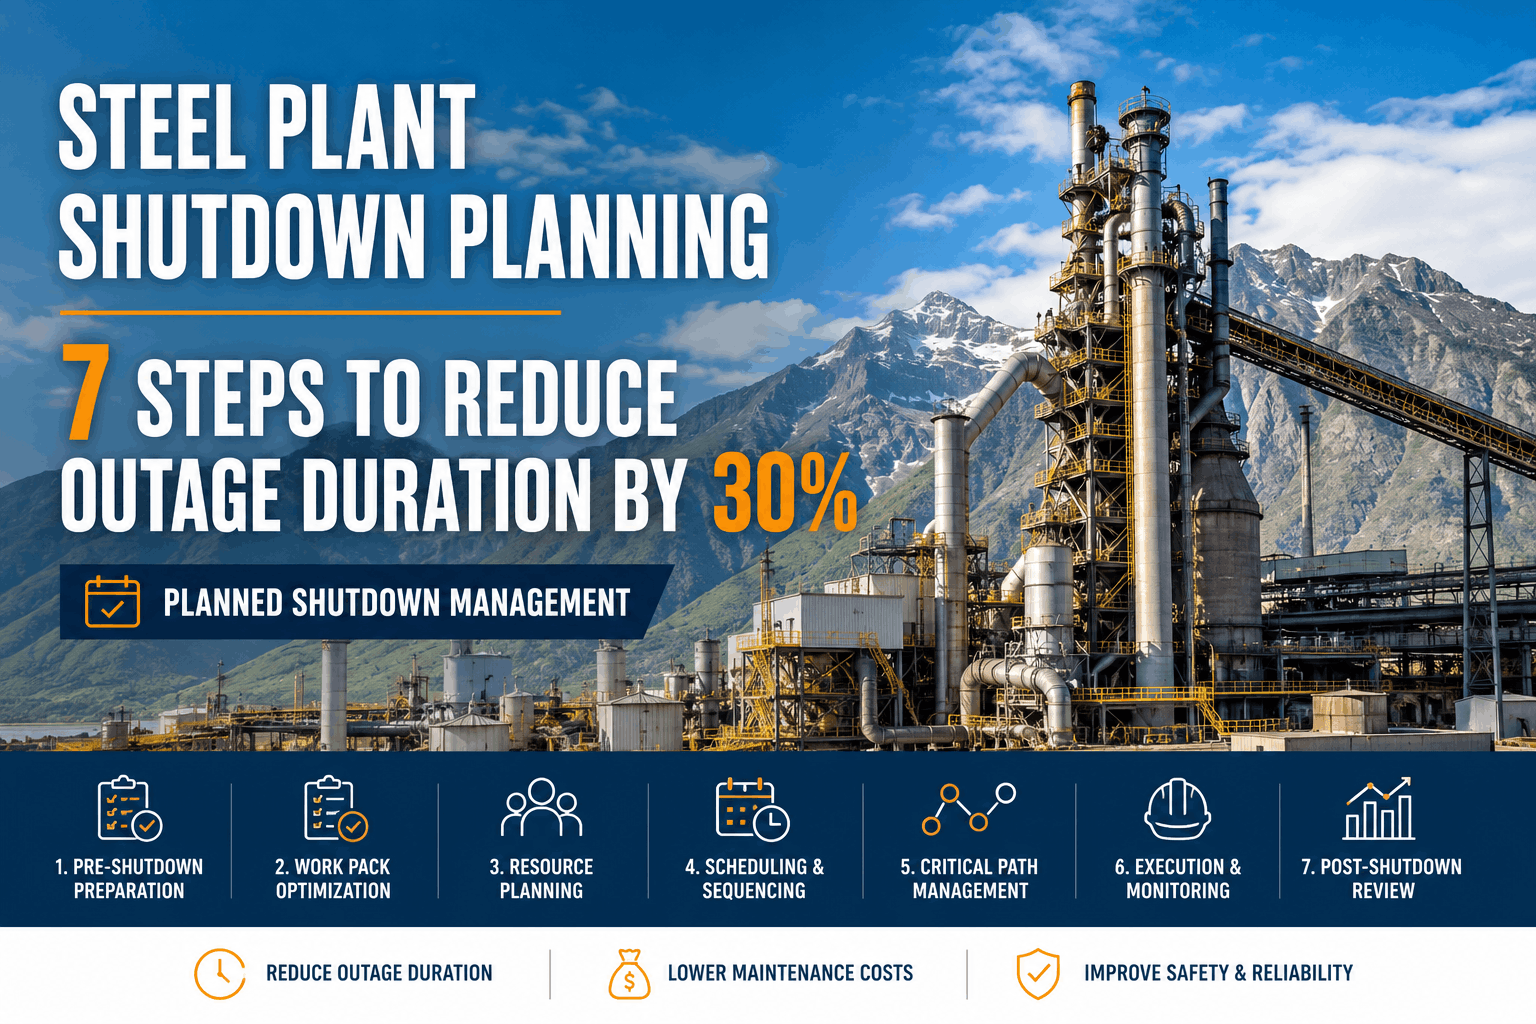
A rolling mill maintenance manager once proudly reported 312 completed work orders in a month. It looked like a productive team, until an insurance audit asked a different question — how many of those orders were planned in advance versus fought in the moment. The answer was 38%. The other 62% were breakdowns, emergency callouts, and repairs nobody saw coming, and every one of them cost roughly five times what a scheduled job would have. The number that mattered was never the work order count; it was the ratio, and fixing that ratio is what separates a plant in control from a plant that is only reacting.
Steel Plant CMMS Guide 2026
Planned Maintenance Ratio: The Single Number That Predicts Your Next Breakdown
Moving steel plant maintenance from 40:60 firefighting toward 80:20 control — schedule compliance, break-in discipline, and planner workflow.
Why the Ratio Beats Every Other Maintenance Metric
Work order counts, hours logged, and even uptime numbers can all look healthy while the underlying program is quietly reactive. Planned Maintenance Percentage cuts through that by asking one question only: was this work scheduled in advance, or did it schedule itself by breaking down?
4.8x
Higher average repair cost for reactive, breakdown-triggered work compared with the same job completed as planned maintenance — parts sourced calmly, labor scheduled, no rushed logistics.
See where your plant sits on the ratio before deciding what to fix. Sign up free and let work order data calculate it automatically.
The Four Levers That Actually Move the Ratio
Lever 1
Schedule Compliance
World-class plants complete 90%+ of scheduled PMs within their compliance window. Below 80%, the schedule stops being trusted and technicians default back to reactive habits.
Lever 2
Break-In Discipline
Every urgent job that jumps the schedule erodes planner credibility. Tracking break-in rate separately exposes how often "emergency" really means "someone skipped inspection."
Lever 3
Work Request Quality
Vague requests force planners to guess, which stalls planning and pushes work back into reactive mode. Structured request forms with asset, symptom, and priority cut planning time sharply.
Lever 4
Planner-to-Technician Ratio
A planner stretched across too many technicians cannot build quality job plans in advance, which is the single biggest predictor of PMP stalling below 60%.
Track Your Ratio Automatically, Every Week
Oxmaint tags every work order as planned or reactive at close-out and trends your PMP against the 80:20 world-class benchmark, no spreadsheet required.
From 38% to a Functioning Program: One Mill's Path
Month 1
Baseline Established
Every work order retroactively coded as planned or reactive. True PMP came out at 38%, far below what the raw work order count had suggested.
Month 3
Request Quality Fixed
Structured work request forms replaced free-text notes. Planners stopped chasing operators for details, cutting job-plan turnaround from days to hours.
Month 6
Schedule Compliance Enforced
PM compliance moved from 71% to 89% as parts kitting was aligned to the weekly schedule instead of pulled ad hoc.
Month 12
PMP Crossed 65%
Reactive work orders fell by more than a third year over year, freeing planner time to push toward the 80% world-class target.
Frequently Asked Questions
What is Planned Maintenance Percentage exactly?
PMP is the share of total maintenance hours spent on work scheduled in advance versus reactive breakdown repair. It is calculated as planned hours divided by total hours, times 100.
What PMP should a steel plant target?
World-class industrial operations sit between 80% and 90%. Below 60%, the maintenance function is functionally reactive regardless of how organized it looks day to day.
Book a demo to benchmark yours.
Does condition-based work count as planned?
Yes. Work triggered by vibration, temperature, or oil analysis monitoring counts as planned, since it was identified through monitoring rather than forced by an actual failure event.
How fast can a plant realistically improve PMP?
Moving from 30% to 50% within a year is a strong result for most plants. Chasing 90% overnight usually fails; steady schedule compliance gains compound faster than a single push ever does.
Can a CMMS calculate PMP automatically?
Yes, Oxmaint codes every work order at creation and close-out, then trends PMP weekly by site, area, and asset class.
Sign up to see your current ratio.
Know Your Ratio Before Your Next Breakdown Does
Stop guessing whether your maintenance program is proactive. See your real PMP this week and start closing the gap to 80:20.