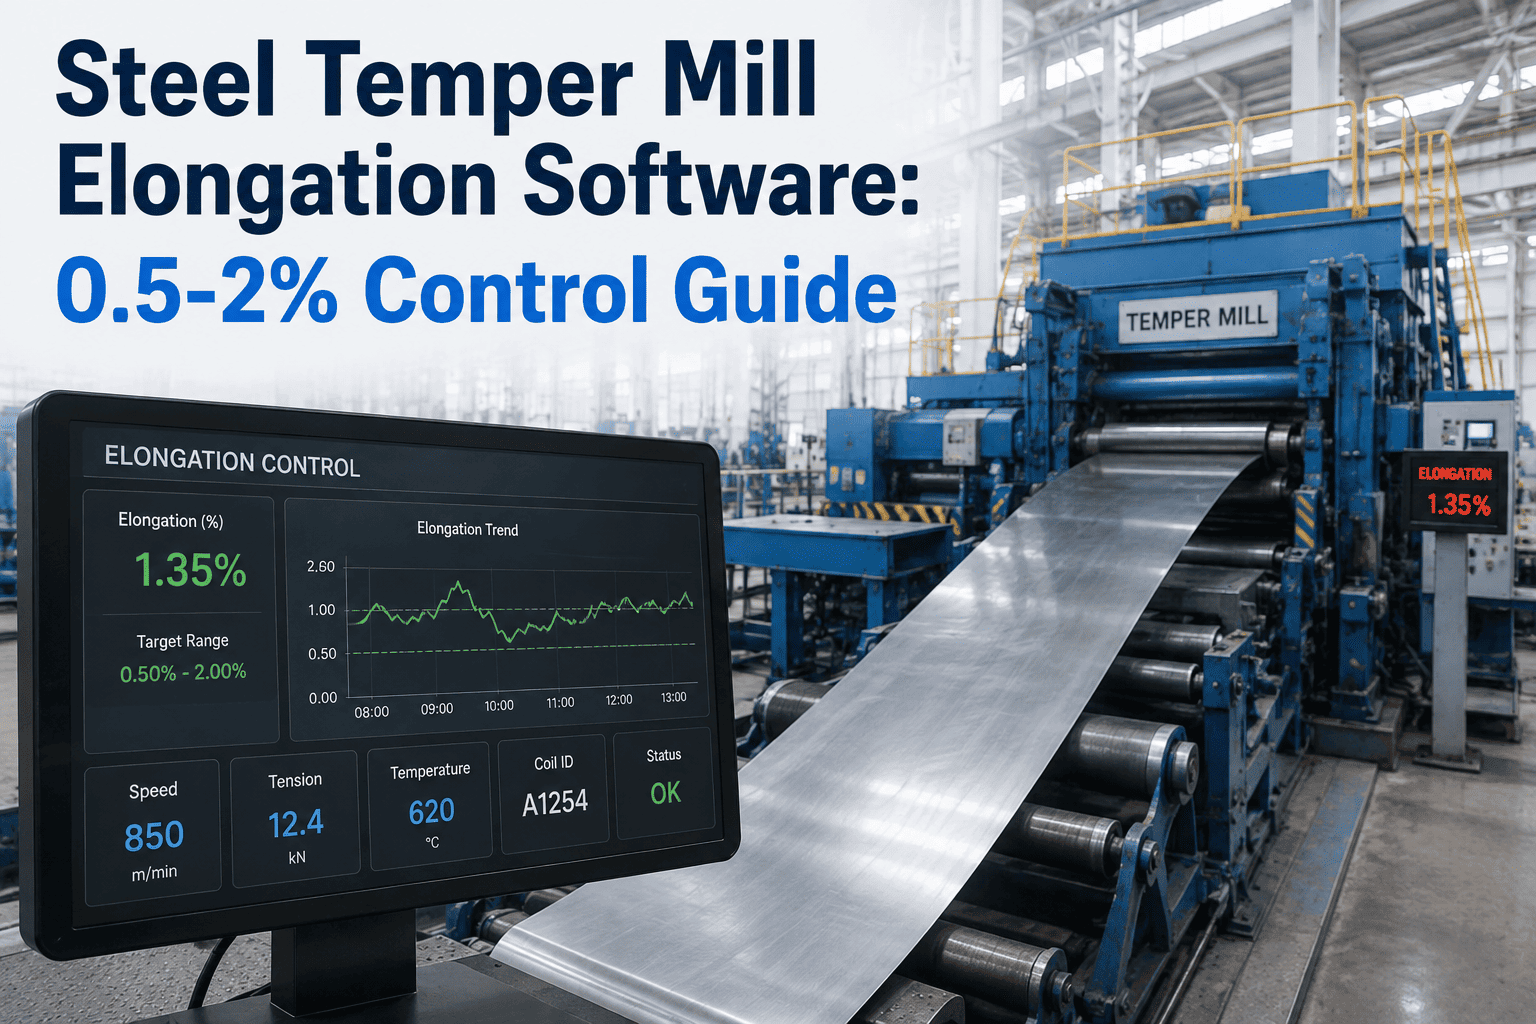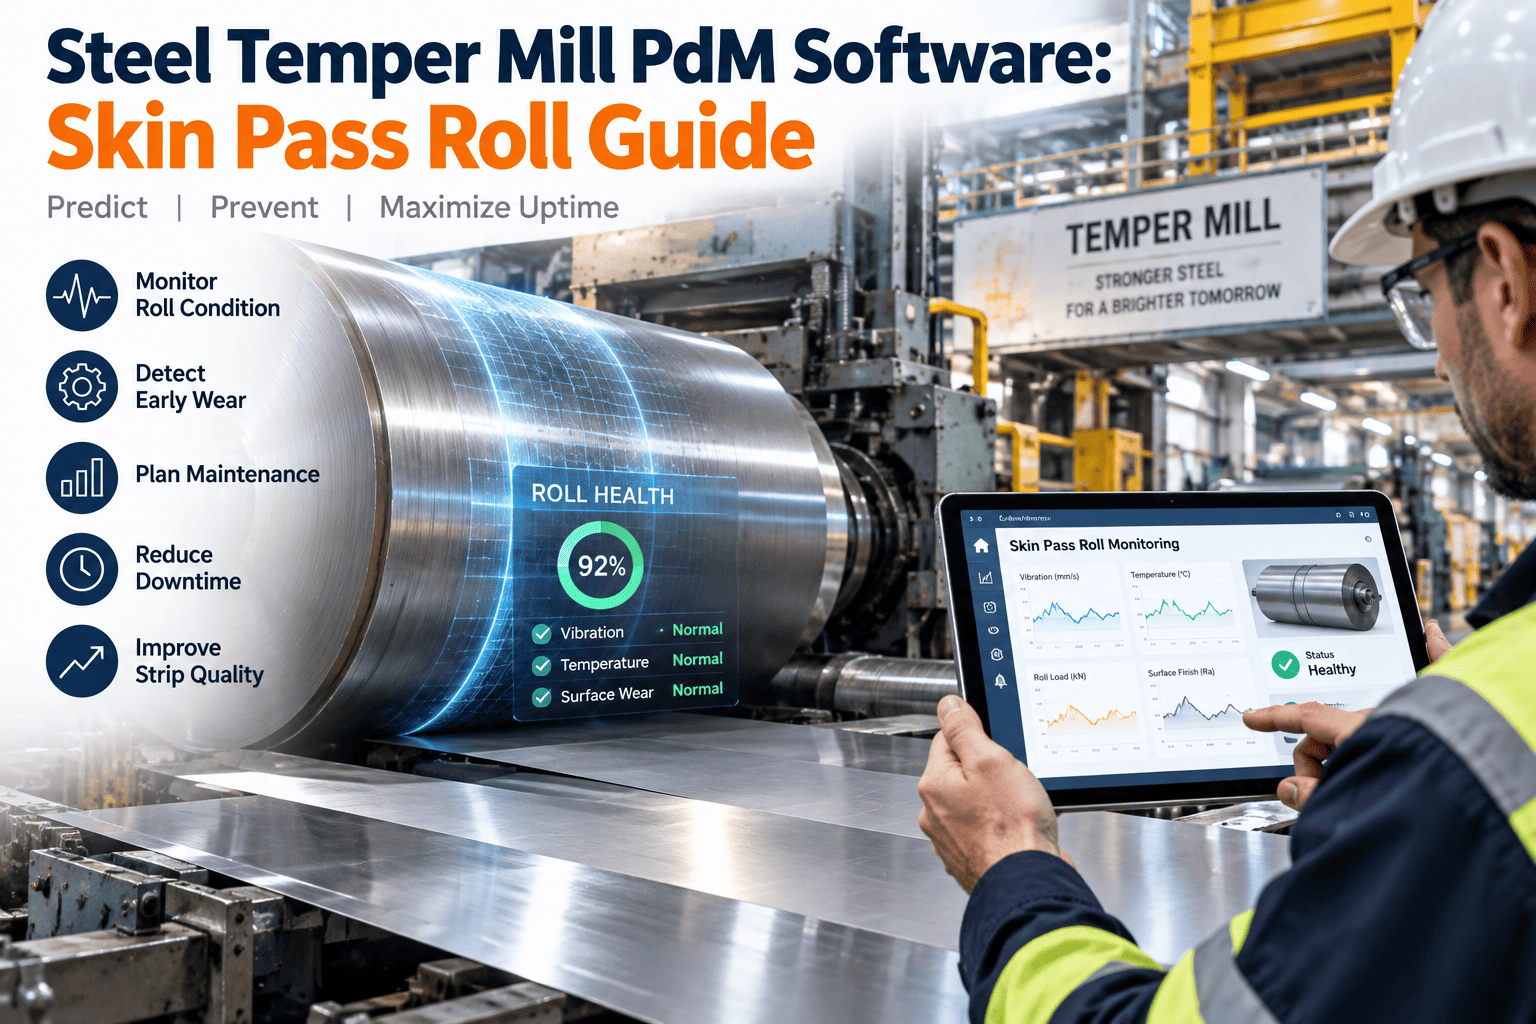
A temper mill's skin pass rarely reduces strip thickness by more than one or two percent, and that small pass carries an outsized job: eliminate yield point elongation before it shows up as Lüders lines on a body panel, correct flatness left over from the anneal, and transfer the work roll's surface texture onto the strip in a controlled, repeatable pattern. When the roll surface, the work roll bearing, or the bridle tension drifts even slightly out of condition, none of that shows up until a customer rejects a coil for surface defects or a stamping plant reports Lüders marks weeks later, far downstream of the mill that caused it.
The Job the Roll Surface Is Actually Doing
Skin-pass rolling does three things at once, and only one of them is dimensional. It suppresses yield point elongation so the strip forms cleanly at the customer's press. It corrects flatness carried over from continuous annealing. And it transfers a specific surface topography — roughness, peak count, and texture pattern — from the work roll onto the strip, which governs how well the strip later takes paint or lubricant in a stamping operation. That third job depends entirely on the physical condition of the work roll surface at the moment of contact. A roll that has lost its designed texture through wear transfers a degraded pattern onto every coil that passes through it, and because the degradation is gradual, it rarely produces a single rejected coil — it produces a slow drift across dozens of coils that only becomes obvious in aggregate.
Three Failure Points Behind Most Surface and Elongation Drift
Reactive Testing vs. Condition-Based Roll Monitoring
Roll Life Cycle: Where PdM Checkpoints Belong
Why a Single Sensor Type Is Not Enough
Vibration monitoring alone catches bearing degradation but says nothing about roll surface topography. Surface roughness measurement alone catches wear but misses tension-related elongation drift coming from the bridle. Coil-to-coil elongation consistency, on its own, tells you something is wrong without telling you which of the three mechanical systems is responsible. The mills that catch drift earliest correlate all three data streams against the same timeline, so a bearing vibration rise that coincides with a roughness change points clearly at a bearing-driven surface problem rather than pure roll wear. Start a free trial to build that correlated view for your own temper mill, or book a demo to walk through your current roll-change and inspection records.
PdM Data Points and What They Reveal
| Data Point | Collection Method | What Drift Indicates | Typical Check Interval |
|---|---|---|---|
| Roll surface roughness | Portable profilometer at roll change and mid-campaign | Roll wear affecting topography transfer to the strip | Every 800 operating hours |
| Work roll bearing vibration | Fixed or portable vibration sensor at bearing housing | Bearing clearance increase introducing gap instability | Continuous or weekly route |
| Bridle tension performance | Load cell reading against commanded setpoint | Bridle slip changing actual delivered elongation | Continuous, alarmed on deviation |
| Coil-to-coil elongation | Inline gauge or periodic tensile sample | Composite drift from any of the three mechanical sources | Inline continuous where available |
Wet vs. Dry Skin-Passing: Different Wear, Different Monitoring
Dry skin-passing produces higher friction at the roll-strip interface and tends to wear roll surface texture faster per ton processed, while wet skin-passing, using a lubricant film, extends roll life but can mask early roughness loss because the lubricant partially compensates for a degrading surface until the compensation runs out abruptly. Applying a single fixed inspection interval across both modes tends to either over-inspect the wet process, wasting technician time on checks that rarely find anything, or under-inspect the dry process, missing the faster wear curve until it has already affected several coils. Setting mode-specific thresholds and intervals, informed by each mill's own historical wear data rather than a generic industry figure, closes that gap.
Reading a Roll Surface Wear Curve
Roll surface wear on a well-behaved campaign follows a broadly predictable curve: a short bedding-in period with a slightly elevated wear rate, a long, nearly linear middle section, and an accelerating final section as the surface approaches the point where roughness transfer to the strip falls outside tolerance. Most unplanned quality escapes happen when a roll is left running into or past that accelerating final section because nobody was tracking where the current tonnage sat on the curve.
Connecting Roll Condition to Customer Complaints
When a downstream stamping plant reports Lüders lines or a paint-adhesion issue weeks after a coil shipped, the investigation usually starts cold: which coil, which roll, which shift, and what condition was the mill in at the time. Without a campaign record tying a coil identifier to the roll's condition history at that point in its campaign, that investigation can consume days chasing a root cause that a properly logged system would surface in minutes. Building that traceability does not require new sensors in most cases — it requires connecting data that mills often already collect but keep in separate, disconnected logs: coil identifiers from the mill's tracking system, roll campaign records from maintenance, and any inline gauge readings from process control. The value comes from the connection, not from any single new measurement.
How Oxmaint Supports Temper Mill PdM
Setting a Realistic PdM Rollout Sequence
Mills adding condition-based roll monitoring to an existing calendar-based program rarely need to instrument everything at once. Work roll bearing vibration is usually the easiest starting point, since portable or fixed vibration sensors are common industrial equipment and the failure mode they detect, bearing clearance increase, has a well-understood relationship to gap instability that operators already recognize by other symptoms. Roll surface roughness measurement is a natural second step, since it requires a portable profilometer used at roll change and at a small number of mid-campaign checkpoints rather than continuous instrumentation. Bridle tension monitoring, often already available from existing load cell instrumentation on the mill's drive system, can frequently be added last, since the data may already exist in the control system and simply needs to be logged and trended rather than newly captured.
Documenting Thresholds Instead of Rules of Thumb
A common gap in temper mill PdM programs is having sensors and data collection in place without a documented threshold for what counts as a problem. A vibration reading or a roughness measurement is only useful if there is a specific, written number that triggers action, agreed on ahead of time rather than debated in the moment a reading looks unusual. Setting that threshold from the mill's own historical data, rather than a generic industry figure pulled from a vendor manual, produces a number the operations team trusts because it reflects how this specific mill, with its specific roll grinding practice and bearing maintenance history, actually behaves. A threshold set too conservatively triggers unnecessary roll changes and erodes trust in the alerts; one set too loosely defeats the purpose of monitoring in the first place.
Training Operators to Trust the Trend
A PdM program only changes outcomes if operators and technicians act on the trend data rather than reverting to habit when a reading looks borderline. Mills that pair the rollout with a short review of a handful of past drift events, showing what the data would have shown before the coil was rejected, tend to see faster adoption than mills that introduce the new dashboards without connecting them back to a failure everyone already remembers.
Where This Fits Alongside Existing Quality Systems
Most cold mills already run some form of statistical process control on elongation and flatness at the quality lab level. Condition-based roll monitoring does not replace that system — it feeds it earlier information. A quality lab that only sees elongation data after the fact is working from the same symptom every reactive program relies on; a lab that also sees roll surface, bearing, and bridle trends in the same view can distinguish a genuine process shift from a mechanical drift before the next tensile sample even gets pulled.