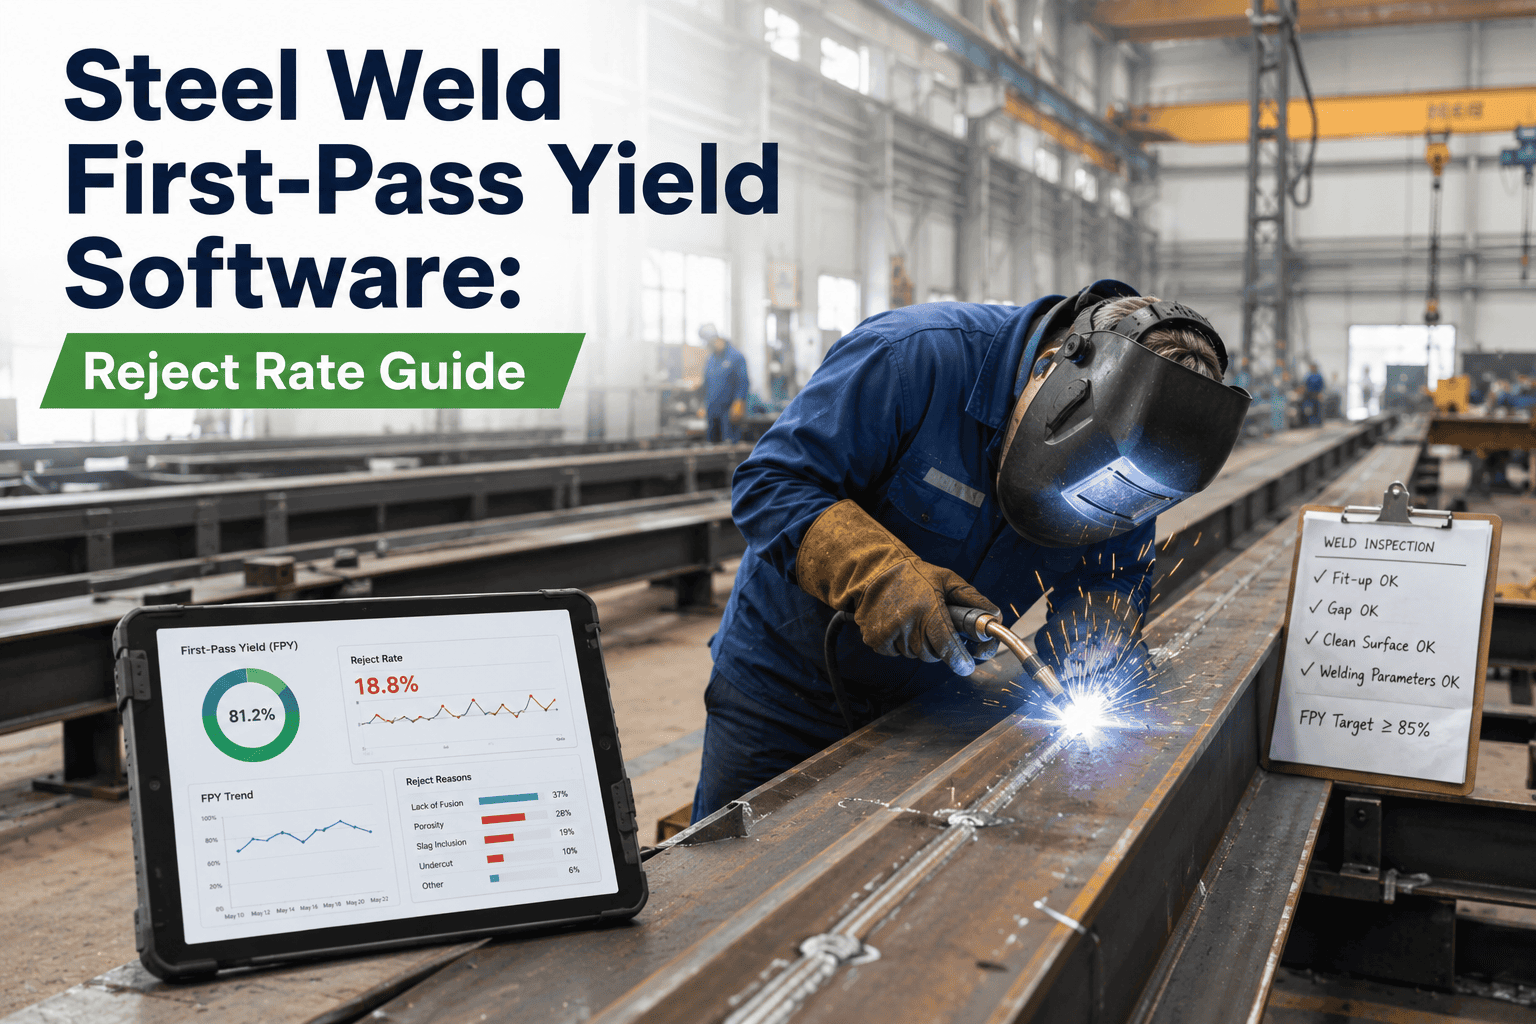
Ask five welding supervisors how their shop is performing and four of them will quote a scrap percentage from memory, not a measured first-pass yield. That gap is expensive. A pressure vessel shop running a "healthy" 5% reject rate on paper can be burning 15% of its welding hours on rework once repairs, re-inspection, and re-testing are counted honestly. First-pass yield is the number that closes that gap — the share of welds that pass inspection the first time, with zero touch-ups. Steel plants that track it by welder, weld process, and defect type stop guessing where the hidden factory lives and start fixing it, and you can see how that tracking works with a quick demo of Oxmaint's weld quality module.
Weld Quality · First-Pass Yield · Reject Rate
Steel Weld First-Pass Yield Software: Turn Reject Rate Into a Number You Can Actually Fix
First-pass yield is not the same as "welds that eventually pass." It is the percentage of welds accepted on the very first inspection — no grinding, no re-welding, no second trip back to the joint. Most steel shops track final yield instead, which flatters the process because it counts reworked welds as good. The result: a mill reporting 97% final yield can be sitting on a first-pass yield of 84%, and nobody in the building can point to why.
82% → 98.5%
First-pass rate improvement reported after fabricators moved from manual to controlled, tracked welding processes
2% or Less
Typical shop-condition reject rate benchmark most structural and pressure fabricators aim to stay under
13-Point Gap
The difference commonly found between reported final yield and true first-pass yield once rework is separated out
The Core Metric
First-Pass Yield vs. Final Yield — Why the Difference Matters
Final yield answers "did it eventually ship?" First-pass yield answers "did we do it right the first time?" Steel plants that only watch final yield are watching a number that hides rework, and rework is where welding hours, gas, filler metal, and inspection time quietly disappear. The formula itself is simple — the discipline is in measuring it consistently.
There is a second layer most shops skip: rolled throughput yield, or RTY. A weld that passes visual inspection but fails UT downstream still counts as a first-pass failure — it just failed at a later station. RTY multiplies the first-pass yield of every inspection stage a weld passes through, so a joint that is 96% likely to clear visual, 94% likely to clear UT, and 98% likely to clear dimensional check has a true rolled yield closer to 88%, not the 96% a single-station report would suggest.
Benchmark Data
How Does Your Reject Rate Compare to the Rest of the Industry
Acceptable reject rate is code-specific and environment-specific — a number that is normal for pipeline field welding would be alarming in a pressure vessel shop. Use this table as a starting reference point, then track your own baseline by weld process and joint type rather than borrowing someone else's target.
| Welding Environment |
Typical Reject Rate |
What Drives It |
Watch-Out Threshold |
| Shop-condition structural fabrication |
1% – 2% |
Controlled fit-up, indoor conditions, consistent WPS |
Above 5% signals a process or training gap |
| Pressure vessel and piping shops |
2% – 5% |
Tighter acceptance criteria under ASME B31.3 |
Above 8% warrants welder re-qualification review |
| Field pipeline and tie-in welds |
5% – 15% |
Weather, access, fit-up variation, portable equipment |
Sustained rates above 20% trigger 100% inspection under most codes |
| Manual structural steel, uncontrolled process |
Up to 18% |
Plate edge variation, travel-speed drift, operator fatigue |
First-pass yield under 85% is a productivity emergency |
| Robotic or process-controlled welding |
Under 1.5% |
Repeatable travel speed, heat input, and torch angle |
Drift above 3% usually means fixture or sensor calibration issue |
Defect Taxonomy
Where Rejects Actually Come From
A reject rate percentage on its own does not tell your welding engineer what to fix. Breaking it down by defect type turns a lagging number into a repair list. These five categories account for the overwhelming majority of first-pass failures across steel fabrication and pipe welding.
01
Undersized Welds and Undercut
Travel speed too fast or amperage mismatched to joint geometry leaves the weld leg undersized or cuts a groove into the base metal along the toe. This is the single most common visual rejection cause and is almost always traceable to a specific welder-machine combination once it is tracked by name.
02
Lack of Fusion
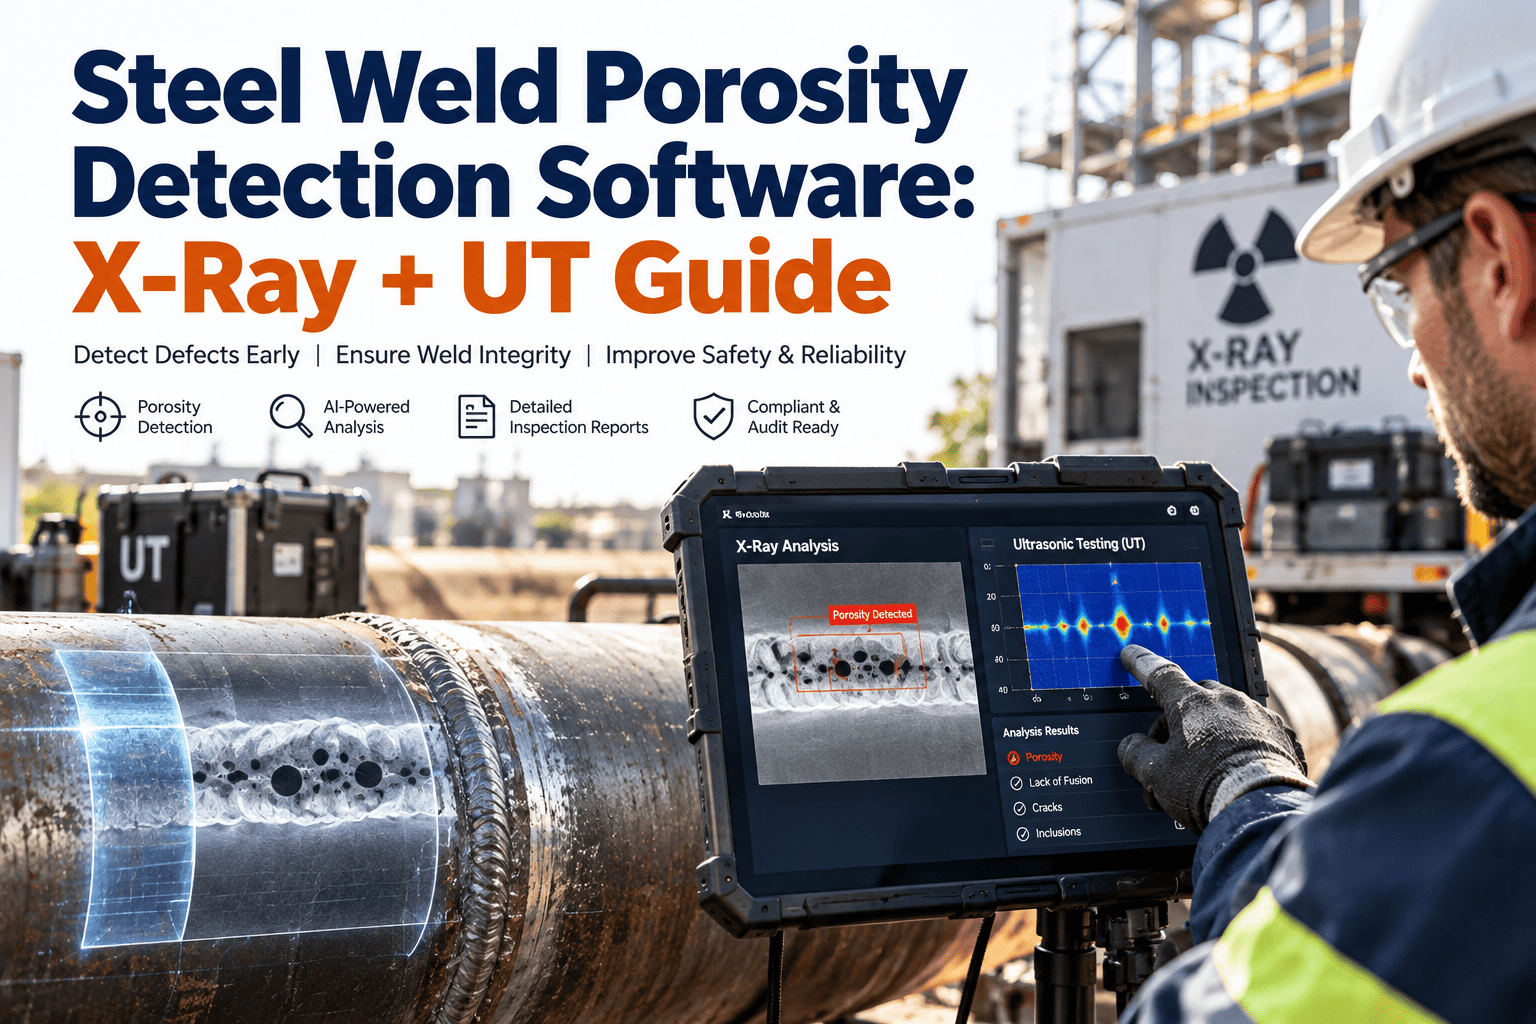
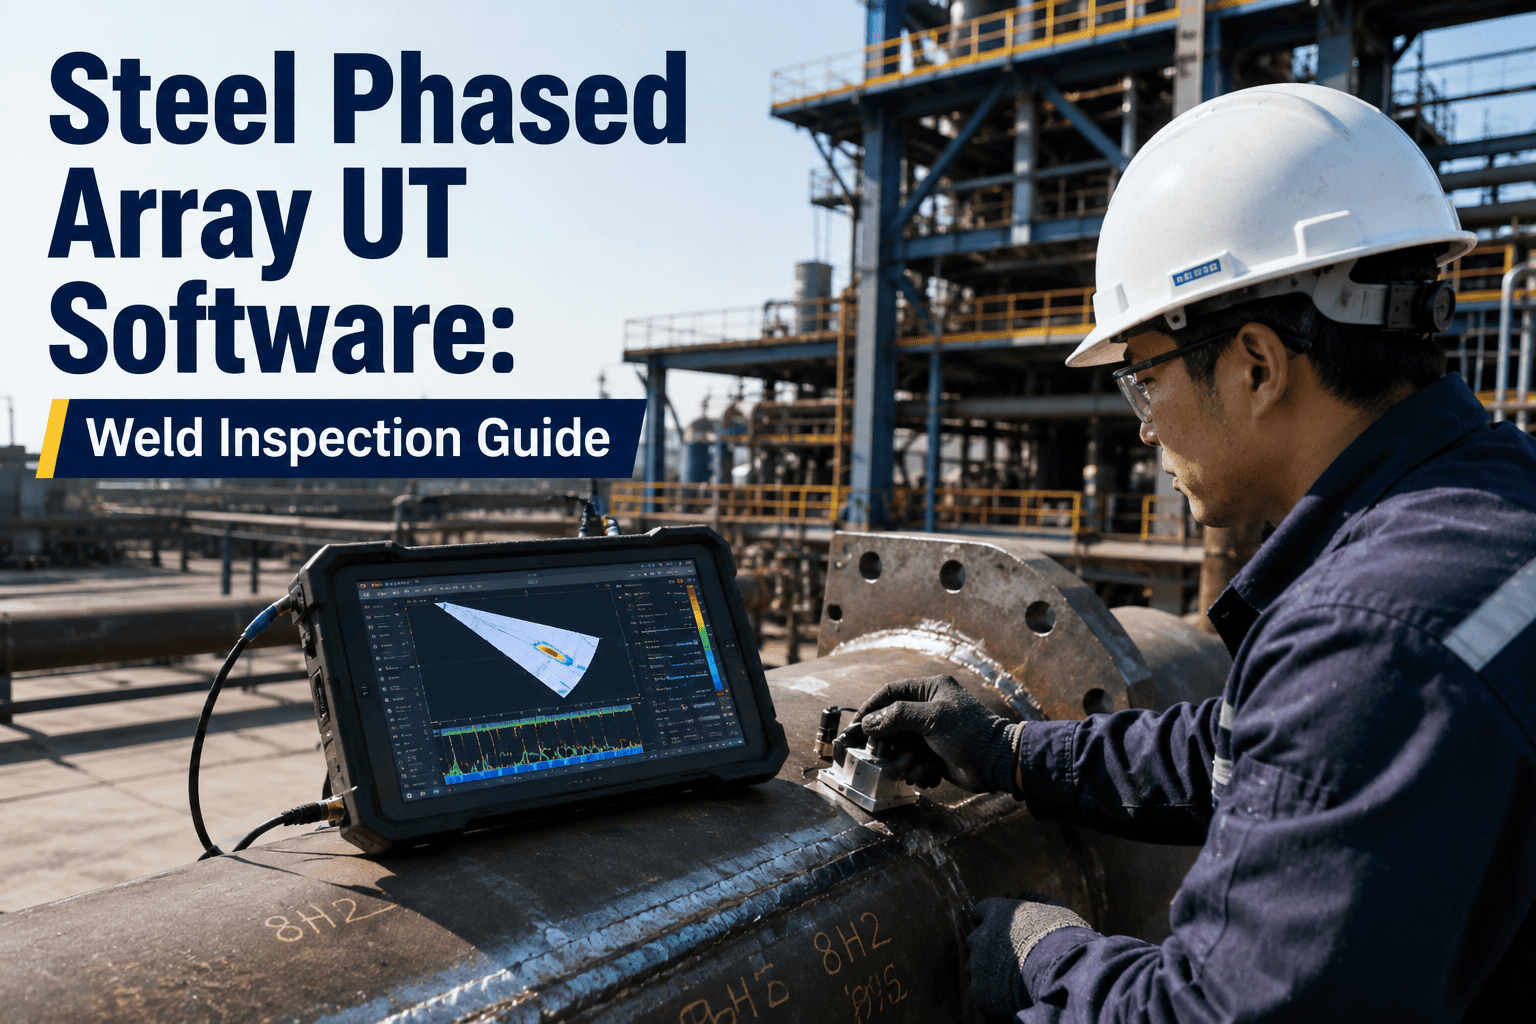
The weld metal did not properly bond to the base metal or a previous pass, usually from insufficient heat input, poor torch angle, or mill scale left on the joint. It is invisible to the naked eye and typically caught only by ultrasonic or radiographic testing, which is why it drives the largest rework cost per incident.
03
Porosity and Slag Inclusions
Trapped gas or unremoved slag between passes creates voids in the weld. Root causes trace back to contaminated filler wire, inadequate shielding gas coverage, wind exposure on field welds, or rushed interpass cleaning.
04
Arc Strikes and Surface Damage
An accidental arc touch outside the joint creates a hardened, brittle spot that can become a crack initiation point. These are avoidable defects tied almost entirely to workspace setup, ground clamp placement, and housekeeping around the weld station.
05
Distortion and Excessive Convexity
Heat input sequencing pulls the member out of dimensional tolerance, or excess filler builds a convex bead that fails profile checks. Both point back to weld sequence planning rather than welder skill, and both are preventable with fixture and sequence standardization.
The Hidden Factory
What a 13-Point FPY Gap Actually Costs a Steel Mill
Every weld that fails first inspection does not disappear — it gets rerouted into what quality engineers call the hidden factory: a second welding pass, a second inspection, a second round of paperwork, all consuming capacity that never shows up on the production schedule. The comparison below shows why two mills reporting the same final yield can have very different real costs.
Mill A — Final Yield Only
98% Final Yield
Looks excellent on a monthly report. But first-pass yield sits at 85%, meaning 13 of every 100 welds needed rework. Rework hours are absorbed into "general labor" and never isolated, so the mill has no defect-type data to act on.
Mill B — First-Pass Yield Tracked
96% First-Pass Yield
A lower headline number, but the mill knows exactly which defect type, which welder, and which shift is driving the remaining 4%. Rework hours are logged separately, isolated by cause, and closed out with corrective action — so the number keeps improving instead of staying flat for years.
Weld Quality Tracking
You Cannot Fix a Reject Rate You Only See Once a Month
Most shops discover their real first-pass yield during a customer audit, not during production. Oxmaint logs every weld inspection result at the moment it happens — by welder, by weld process, and by defect type — so the Pareto chart builds itself instead of waiting for a quarterly review.
How the Software Works
What Oxmaint Tracks for Every Weld, Every Shift
A CMMS built for steel plants does more than log a pass or fail. It captures the context around every inspection result, so a falling first-pass yield trend can be traced back to a cause within minutes instead of weeks.
Defect Type
Automatic Pareto by Rejection Cause
Every inspection failure is logged against a standardized defect code — lack of fusion, porosity, undercut, and more. The system builds a running Pareto chart so the top two or three defect types driving most of your reject rate are always visible, not buried in a spreadsheet.
Defect trends update in real time as each weld is inspected
Welder Performance
First-Pass Yield by Welder and Position
Reject rate is tracked per welder, per weld position, and per joint type — not as a blame tool, but to target retraining where it moves the needle fastest. A welder struggling only with overhead lack-of-fusion needs a very different fix than one with a broad, shop-wide problem.
Retraining targeted by specific defect pattern, not general performance
Process Comparison
SMAW, GTAW, GMAW, and Robotic Side by Side
First-pass yield is reported separately by weld process, so a mill running mixed manual and robotic cells can see exactly how much reject rate the manual stations are contributing versus the automated ones, backed by the same inspection data.
Process-level yield comparison across every weld station
Rolled Throughput Yield
Multi-Station Yield Calculated Automatically
Where a weld passes through visual, dimensional, and NDT inspection stages, Oxmaint calculates rolled throughput yield across all of them, giving a true end-to-end acceptance rate instead of a single-station snapshot that overstates quality.
True multi-stage yield, not a single-inspection estimate
Material and Shift Correlation
Connects Reject Spikes to Root Cause
Reject rate is cross-referenced against material lot, shift, and consumable batch automatically, so a spike tied to a bad filler wire lot or a night-shift fatigue pattern surfaces as a correlation, not a coincidence someone has to notice manually.
Root-cause correlation without manual spreadsheet cross-checking
Audit Trail
Every NCR and Repair Logged and Time-Stamped
Non-conformance reports, repair welds, and re-inspection results are logged with full traceability, giving quality teams a complete record ready for ASME, ISO 9001, or customer audits without reconstructing history from paper travelers.
Audit-ready records generated automatically at inspection time
Applied to Your Operation
Four Steel Welding Operations, Four Different Reject Rate Problems
First-pass yield problems look different depending on whether you run a job shop, a pipe mill, a structural fabricator, or a mixed manual-robotic floor. Here is how the same tracking approach solves each one differently.
Job shops often discover their real first-pass yield only when a customer complains. Logging inspection results at the weld station — not at end-of-shift — surfaces a slipping trend within days instead of at the next audit, giving the shop time to correct before a batch of rejects reaches the yard.
Fix: Real-time inspection logging tied to each welder and joint, reviewed weekly instead of quarterly.
Typical outcome: reject rate visibility within the same shift, not the same month.
A weld that clears visual inspection but fails UT downstream is still a first-pass failure, but single-station reporting often misses it. Rolled throughput yield calculated across every gate gives an accurate end-to-end number and flags which inspection stage is catching the most defects.
Fix: Track yield per inspection stage, then roll it up to a single true first-pass number.
Typical outcome: hidden downstream failures surface weeks earlier.
Code welding carries welder qualification requirements tied directly to reject history. When rejects are logged against the specific welder and procedure, requalification decisions are backed by data instead of a supervisor's impression, and audit prep drops from days to hours.
Fix: Link every reject to welder certification records for defensible requalification decisions.
Typical outcome: audit preparation time cut significantly with a standing digital record.
Combined reject rate reporting hides which stations actually need attention. Splitting first-pass yield by process shows whether the manual cells are dragging the average down, or whether a robotic fixture has drifted out of calibration and needs a maintenance check.
Fix: Report first-pass yield separately by process so investment decisions target the right station.
Typical outcome: clearer case for where automation investment actually pays off.
Reported Outcomes
What Changes When First-Pass Yield Is Tracked Continuously
Faster
Root Cause Identification
Defect-type Pareto data points welding engineers to the top rejection cause within a shift instead of after a monthly review.
Targeted
Welder Retraining
Training time is spent on the specific defect pattern a welder struggles with, not a generic refresher course.
Lower
Rework Hours
Isolating rework from general labor time shows exactly how many hours the hidden factory is consuming, and where to cut it.
Audit-Ready
Compliance Records
Every inspection, repair, and NCR is time-stamped and traceable, ready for code compliance review at any time.
Common Questions
Steel Weld First-Pass Yield — Frequently Asked Questions
What is a good first-pass yield for steel welding?+
Shop-condition structural work typically runs 95% or higher first-pass yield, while code-controlled pressure welding often targets slightly tighter margins. Field pipeline welding is naturally lower due to weather and access. The right benchmark is your own trailing baseline — see how to set one with a
demo walkthrough.
How is reject rate different from first-pass yield?+
Reject rate counts failures; first-pass yield counts successes on the first attempt. They are mathematically related but reject rate alone does not separate a single bad batch from a systemic, repeating problem the way first-pass yield tracked over time does.
Can first-pass yield be tracked without adding inspection steps?+
Yes. Oxmaint logs results from inspections you already perform — visual, UT, or dimensional — at the point they happen, so no additional inspection stage is required. The data simply gets structured instead of written on a paper traveler.
Does tracking first-pass yield by welder create a blame culture?+
Used correctly, welder-level data targets training, not blame. Most mills find that a small number of specific, fixable causes — not individual welder skill — account for most of the gap once defect type is factored in alongside the welder name.
How quickly can a mill start seeing accurate first-pass yield data?+
Most mills see their first accurate defect-type Pareto within the first week of logging inspections in the system. A
free trial is usually enough time to validate the numbers against your own paper records.
We reported 97% yield for years and thought we were in good shape. Once we split it by defect type and welder, our real first-pass number was closer to 86%. The lack-of-fusion cases alone were costing us more welding hours than every other defect combined. We fixed the joint prep procedure for that one issue and moved the whole shop up six points in a quarter.
— Quality Manager, Structural Steel Fabricator
Get Your Real Number
Stop Reporting Final Yield When First-Pass Yield Is the Number That Actually Runs Your Shop
Oxmaint logs every weld inspection at the source, builds the defect-type Pareto automatically, and gives your welding engineers a real first-pass yield number by welder, process, and shift — not an estimate reconstructed from paper travelers once a month.