A steel plant's monthly utility bill tells you what energy cost, not where it went — and the gap between those two numbers is where real margin quietly disappears every single shift. A compressor left cycling on a shutdown line, a furnace zone holding setpoint two hours longer than the heat actually required, an idling shift crew running full ventilation through an empty bay — none of these show up as a line item anywhere except the total kWh figure finance already accepted as normal. Digital maintenance tracking gives reliability and energy teams a way to see equipment-level, process-level, and shift-level energy drift as it happens instead of reconstructing it from a bill that already arrived, and connecting energy monitoring to work order data turns that invisible drift into something a plant can actually act on.
The Energy Your Plant Loses Between Shift Changes
Blind spots don't show up on a monthly bill — they show up in the gap between rated equipment load and what a compressor, furnace zone, or ventilation system actually consumes when nobody is watching. OxMaint links energy readings to the equipment and shifts responsible for them.
Three Places Energy Cost Hides in a Steel Plant
Energy blind spots cluster around three layers of plant operation, and each layer needs a different kind of visibility to catch. A single monthly total collapses all three into one number, which is exactly why the waste stays invisible.
Equipment-Level Drift
A motor, compressor, or pump running outside its designed efficiency band due to bearing wear, belt slip, or fouled heat exchangers — pulling more current to do the same work without tripping any alarm.
Process-Level Waste
Furnace zones, annealing lines, and drying ovens holding temperature longer than the current product mix requires, or running at a legacy setpoint nobody has revisited since the original process design.
Shift-Level Behavior
Ventilation, lighting, and auxiliary equipment left running through breaks, changeovers, or planned line stoppages because shutting down and restarting feels riskier than just letting it run.
Stop Waiting for the Bill to Tell You
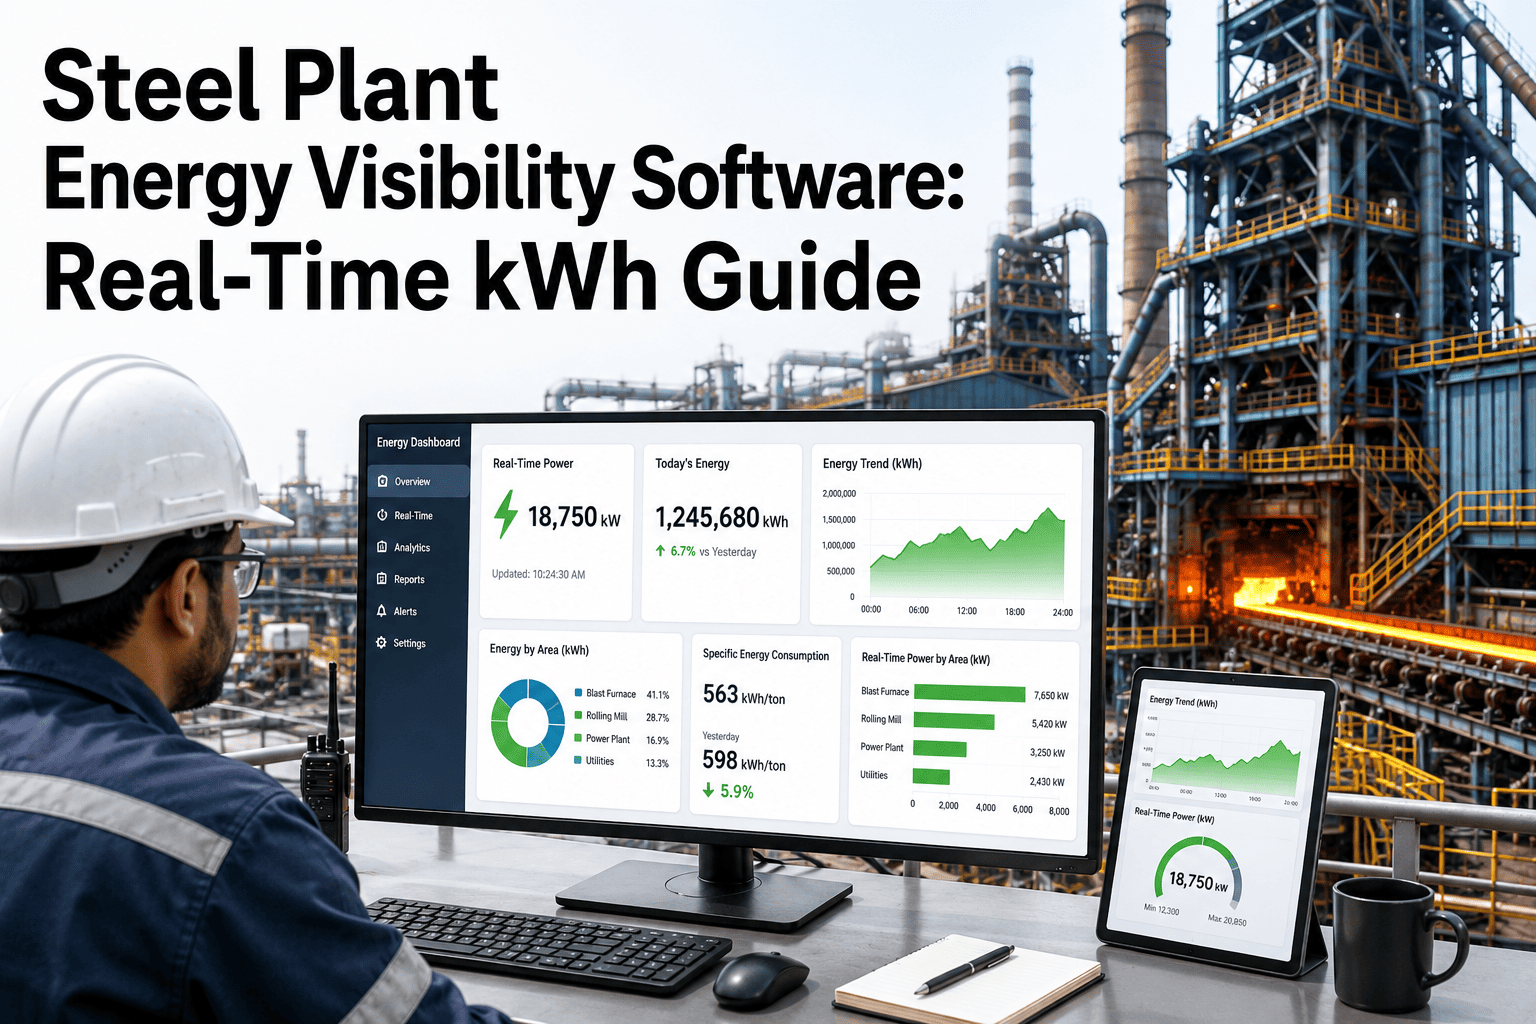
OxMaint connects energy readings to the specific asset, line, and shift responsible for them, so drift becomes a work order instead of a mystery line item finance notices a month later.
Why the Monthly Bill Hides All of This
A utility bill aggregates an entire month across every shift, every process area, and every piece of equipment into a single kWh total and a single dollar figure. That aggregation is exactly what makes blind spots invisible — the bill tells finance what was spent, but nothing about where, when, or why.
Common Causes of Energy Drift by Equipment Type
Different equipment classes leak energy for different mechanical reasons. Knowing the pattern helps a maintenance team decide whether a spike is a sensor fault, a mechanical fault, or simply a process that has drifted from its original design intent.
Compressed Air Systems
Leaks in distribution piping and worn seals force compressors to cycle more often to maintain header pressure, often accounting for a meaningful share of a plant's total electrical draw without any single leak being large enough to notice on its own.
Electric Motors and Pumps
Bearing wear, misalignment, and belt slip all increase the current a motor needs to deliver the same mechanical output, and this draw increase typically precedes an audible or vibration-based failure signal by weeks.
Furnace and Thermal Process Zones
Insulation degradation, door seal wear, and setpoint creep all increase fuel or electrical draw needed to hold temperature, and these losses accumulate slowly enough that no single shift notices the change.
Ventilation and Auxiliary Systems
Fans and dust collection systems sized for full production frequently keep running at full rate during partial shutdowns or reduced-crew shifts, since no one owns the decision to scale them down.
Energy Blind Spot Monitoring Reference
A practical starting framework for where to place monitoring points and how often to review them, organized by the layer of the plant they belong to.
| Monitoring Point | What to Watch | Review Cadence |
|---|---|---|
| Compressor header pressure and cycle count | Cycling frequency rising against stable production demand | Weekly |
| Motor current draw vs. rated load | Current climbing without a corresponding output increase | Monthly |
| Furnace zone fuel or kWh per ton | Drift against product-mix-adjusted baseline | Weekly |
| Ventilation runtime during planned stoppages | Systems still running at full rate during line-down windows | Per shift |
| Off-hours baseline load | Site-wide draw during nights and weekends with no production | Monthly |
Three Signs Your Plant Has an Active Energy Blind Spot
Off-Hours Baseline Load Keeps Climbing
If site-wide draw during nights and weekends with no production keeps rising year over year, equipment is being left running that should be shut down, or standby losses on idle equipment are growing unnoticed.
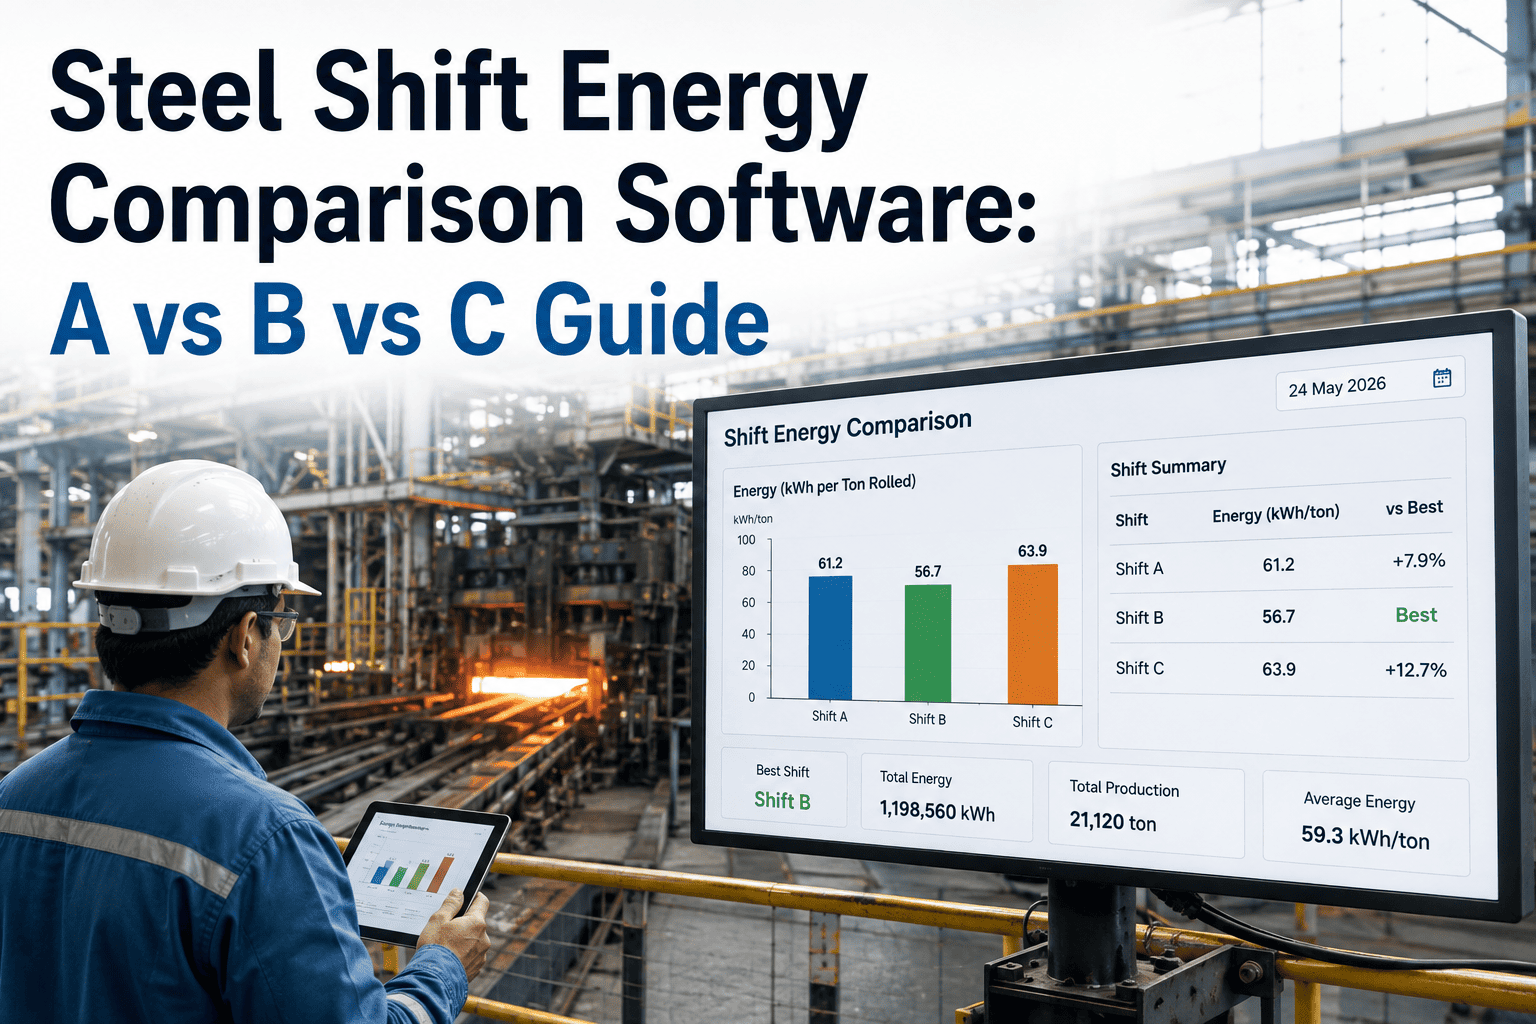
Energy Cost Per Ton Varies Widely Between Shifts
If the same product run costs noticeably more in energy on one shift than another with no difference in output quality, the variance is almost always behavioral — setpoint habits, shutdown discipline, or equipment left idling rather than powered down.
A Piece of Equipment's Draw Has Crept Up Without a Work Order
Rising current draw on a motor or compressor with no matching maintenance record usually means a mechanical fault is developing well before it becomes loud enough or hot enough for anyone to notice during a routine walkaround.
How OxMaint Closes Energy Blind Spots
Energy waste is easy to ignore when it lives in a spreadsheet nobody opens between billing cycles. OxMaint ties readings to the equipment, line, and shift that generated them so drift turns into an assigned task instead of a mystery.
Asset-Level Energy Baselines
Every motor, compressor, and furnace zone gets a baseline draw for normal operation, so a deviation shows up as a flag against that specific asset rather than disappearing into a site-wide total.
Drift-to-Work-Order Routing
When an asset's draw crosses its baseline threshold, a work order generates automatically and routes to the technician responsible for that equipment, closing the gap between detection and action.
Shift-Level Reporting
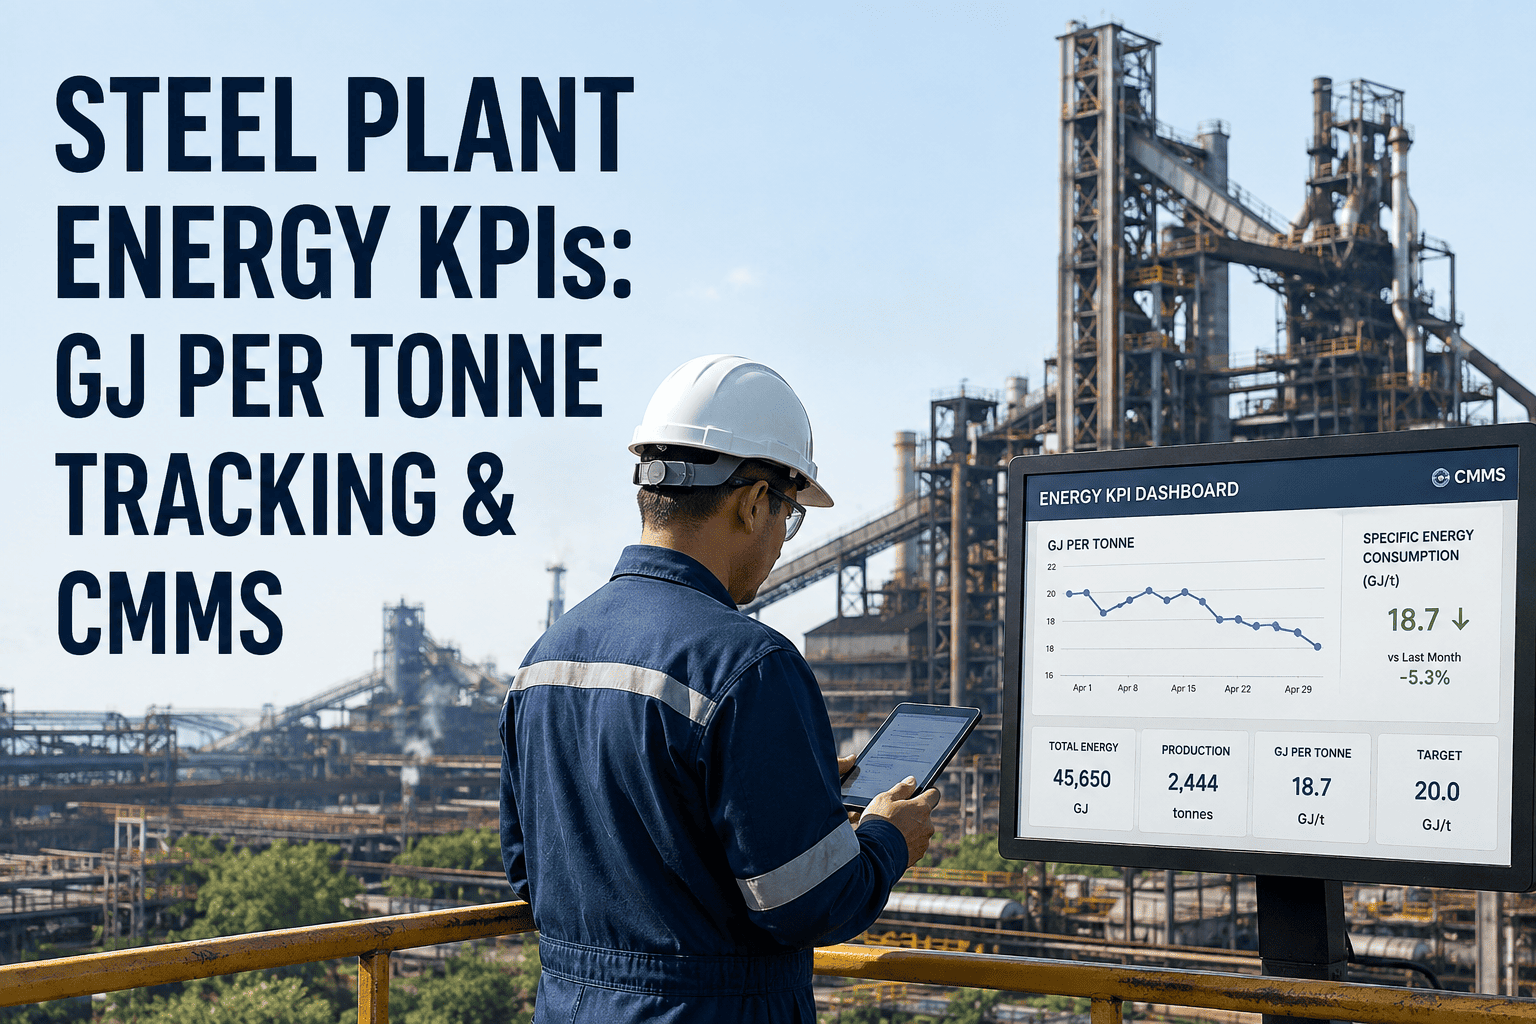
Energy cost per ton or per unit produced breaks out by shift, giving supervisors a concrete number to review in daily handover meetings instead of relying on anecdote about which crew runs leaner.
Off-Hours Load Trending
Baseline night and weekend draw trends over time, surfacing creeping standby losses long before they accumulate into a noticeable jump on the monthly bill.
Energy Blind Spot Questions
How is an energy blind spot different from a regular efficiency loss?
Do we need new hardware to monitor equipment-level energy draw?
Which equipment type usually hides the most blind-spot waste?
Can shift-level energy reporting create unfair comparisons between crews?
How quickly can a plant expect to see energy blind spots surface?
Find the Energy Your Bill Is Hiding
OxMaint connects equipment, process, and shift-level energy readings to the work orders that close the gap, so drift gets caught and corrected long before it shows up as an unexplained line on next month's bill.