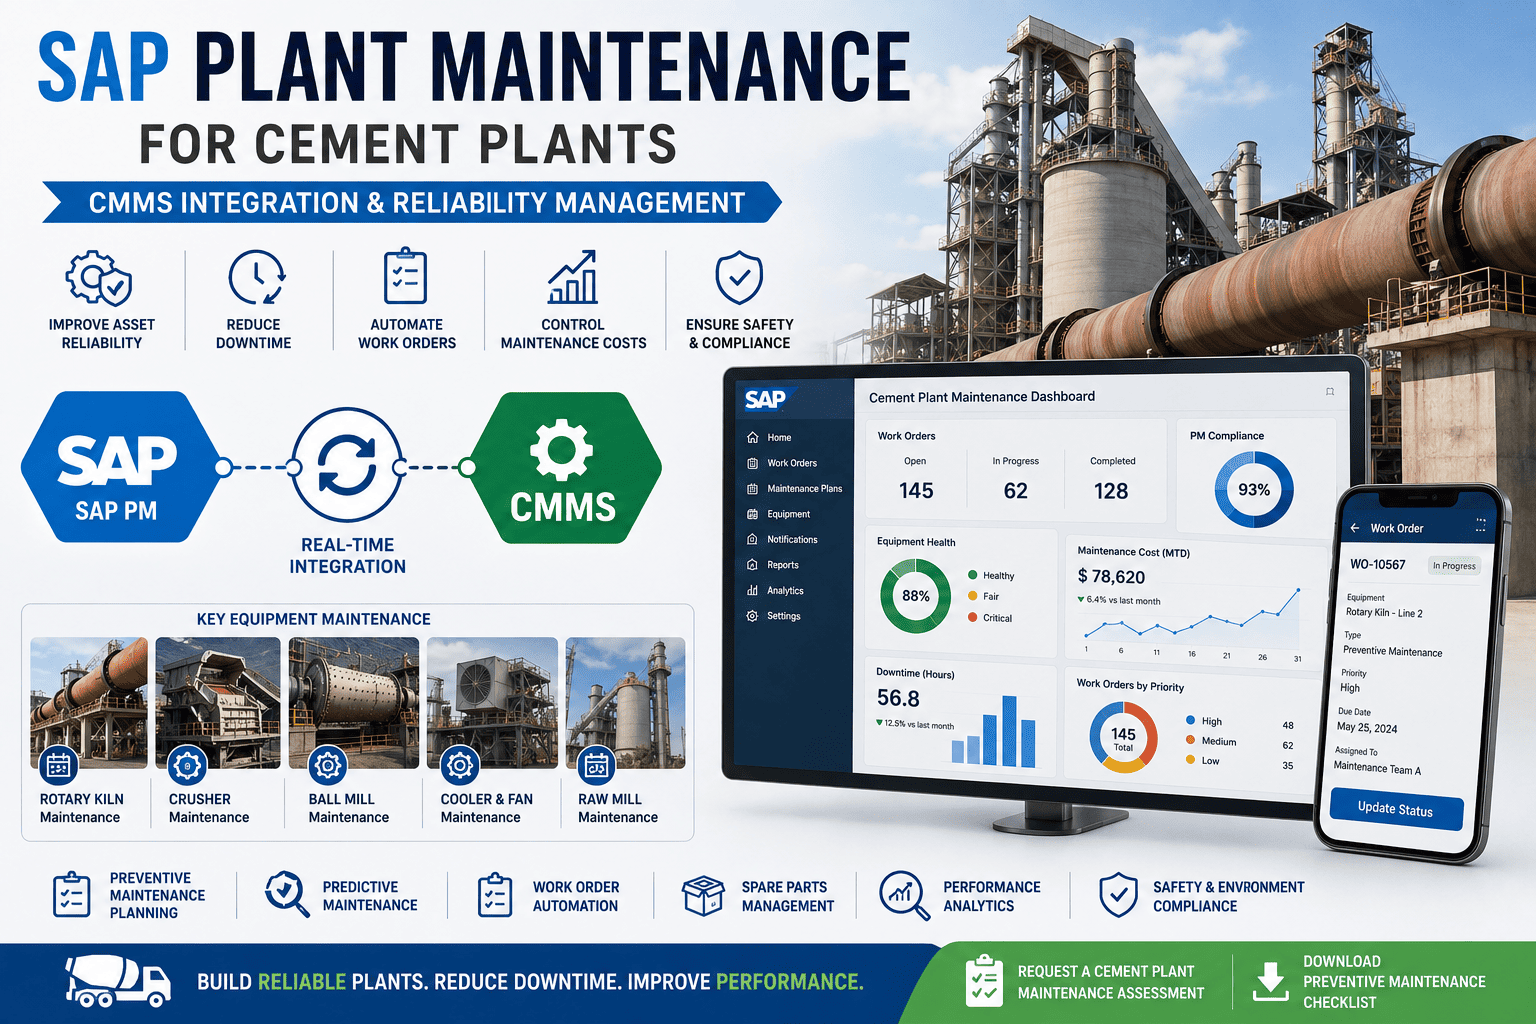
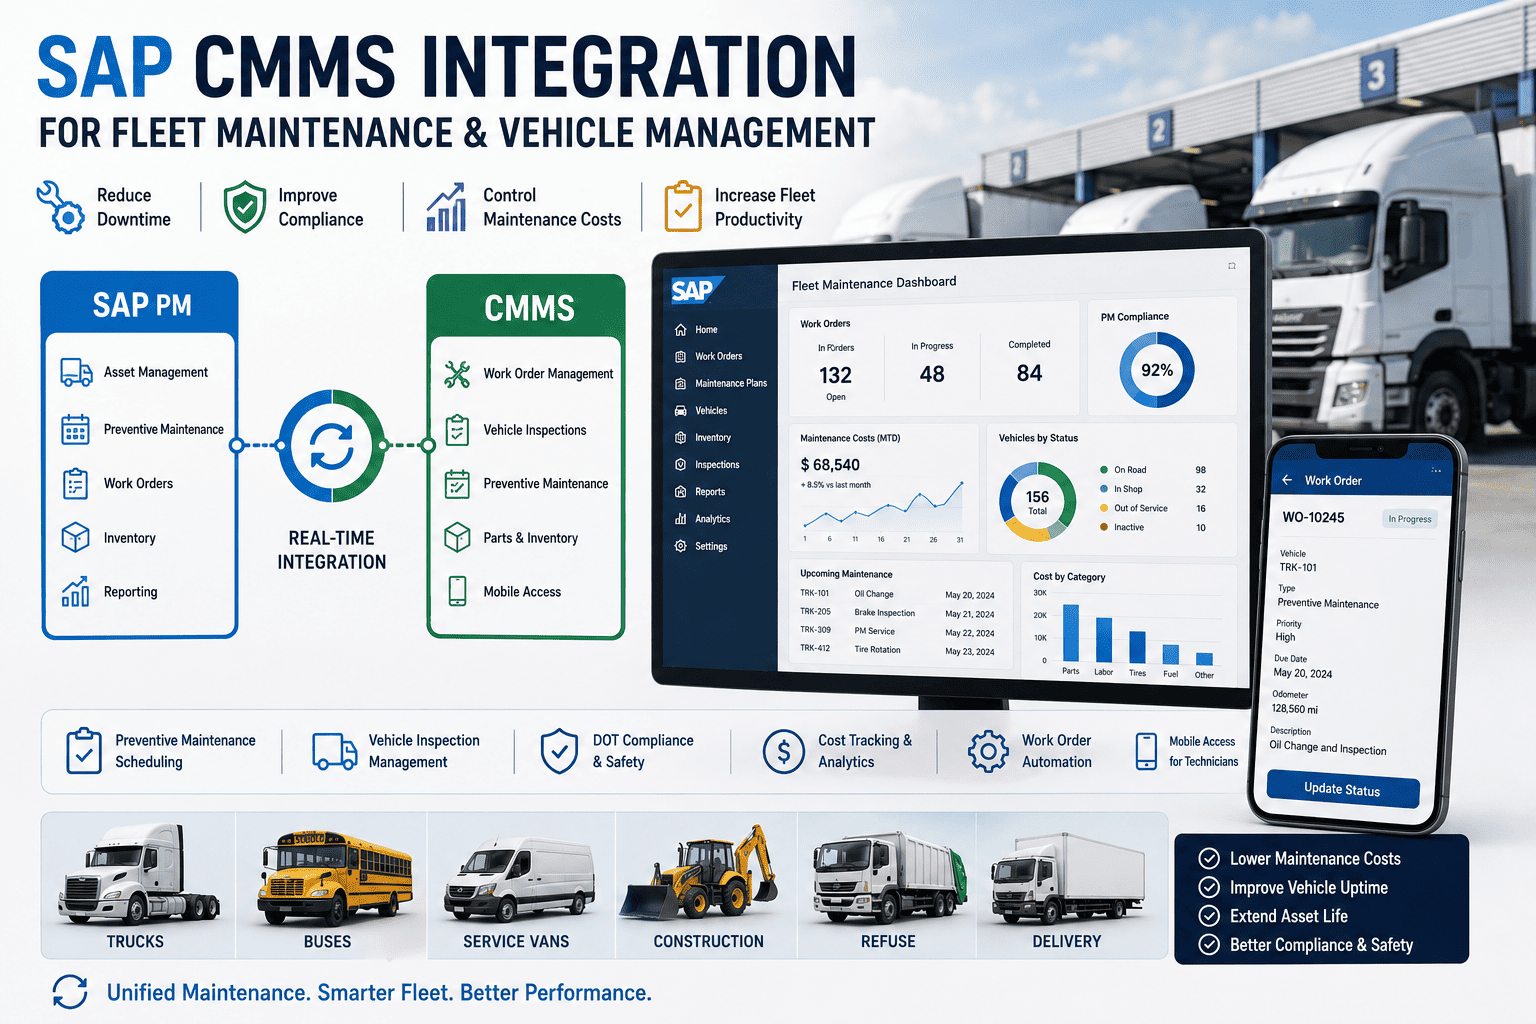
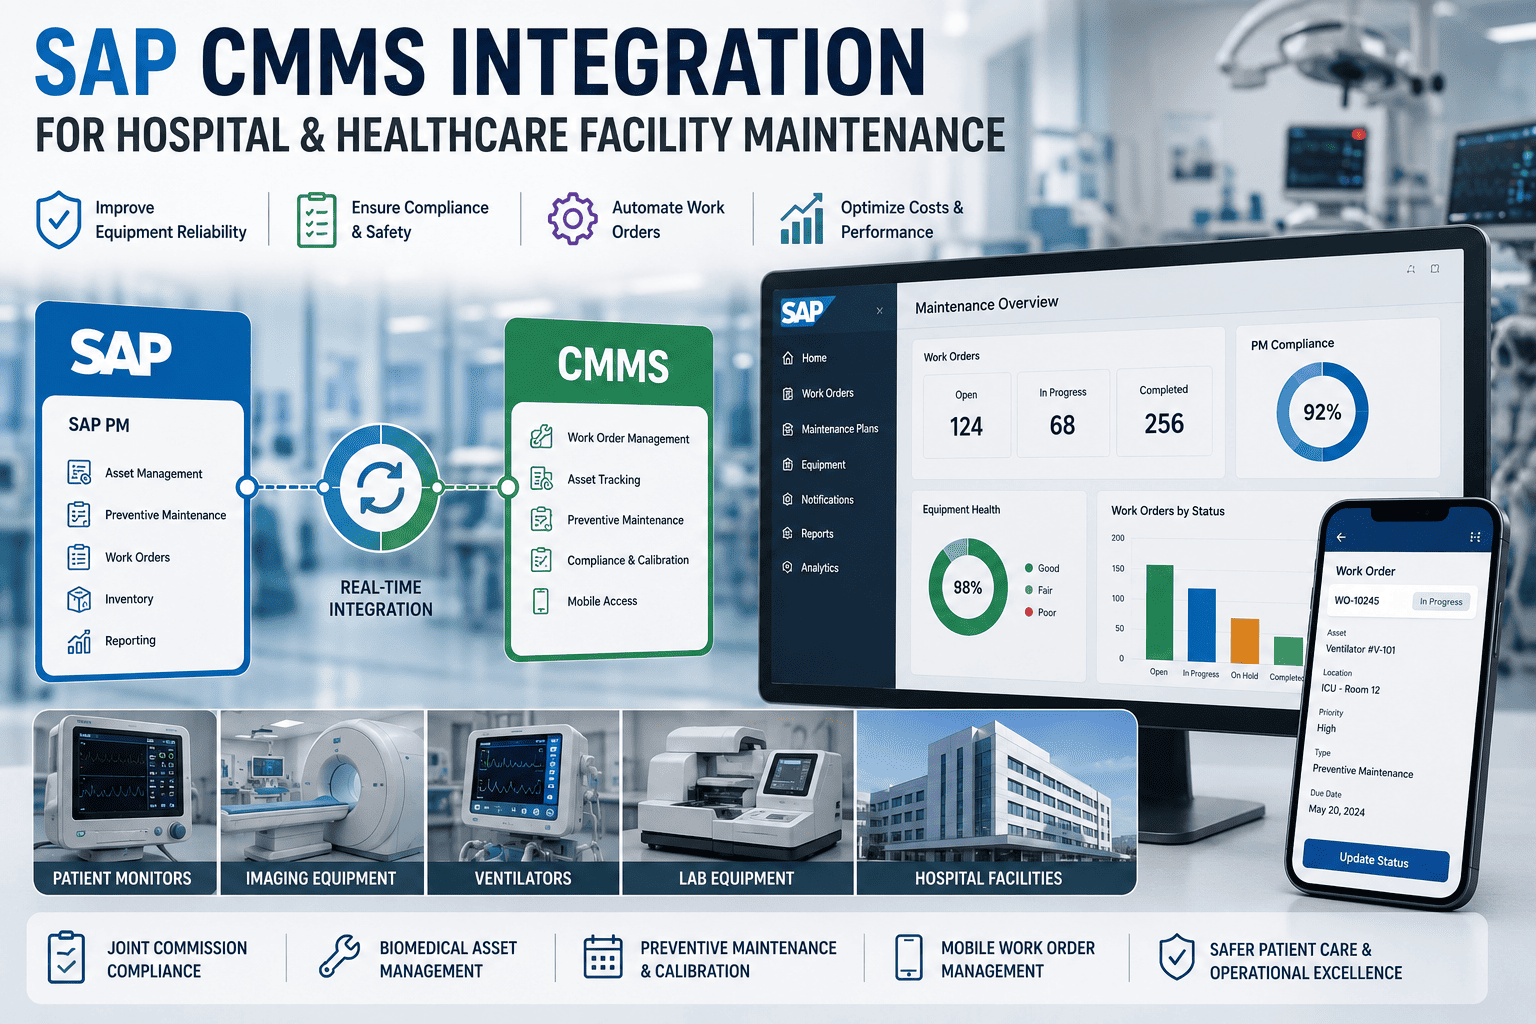
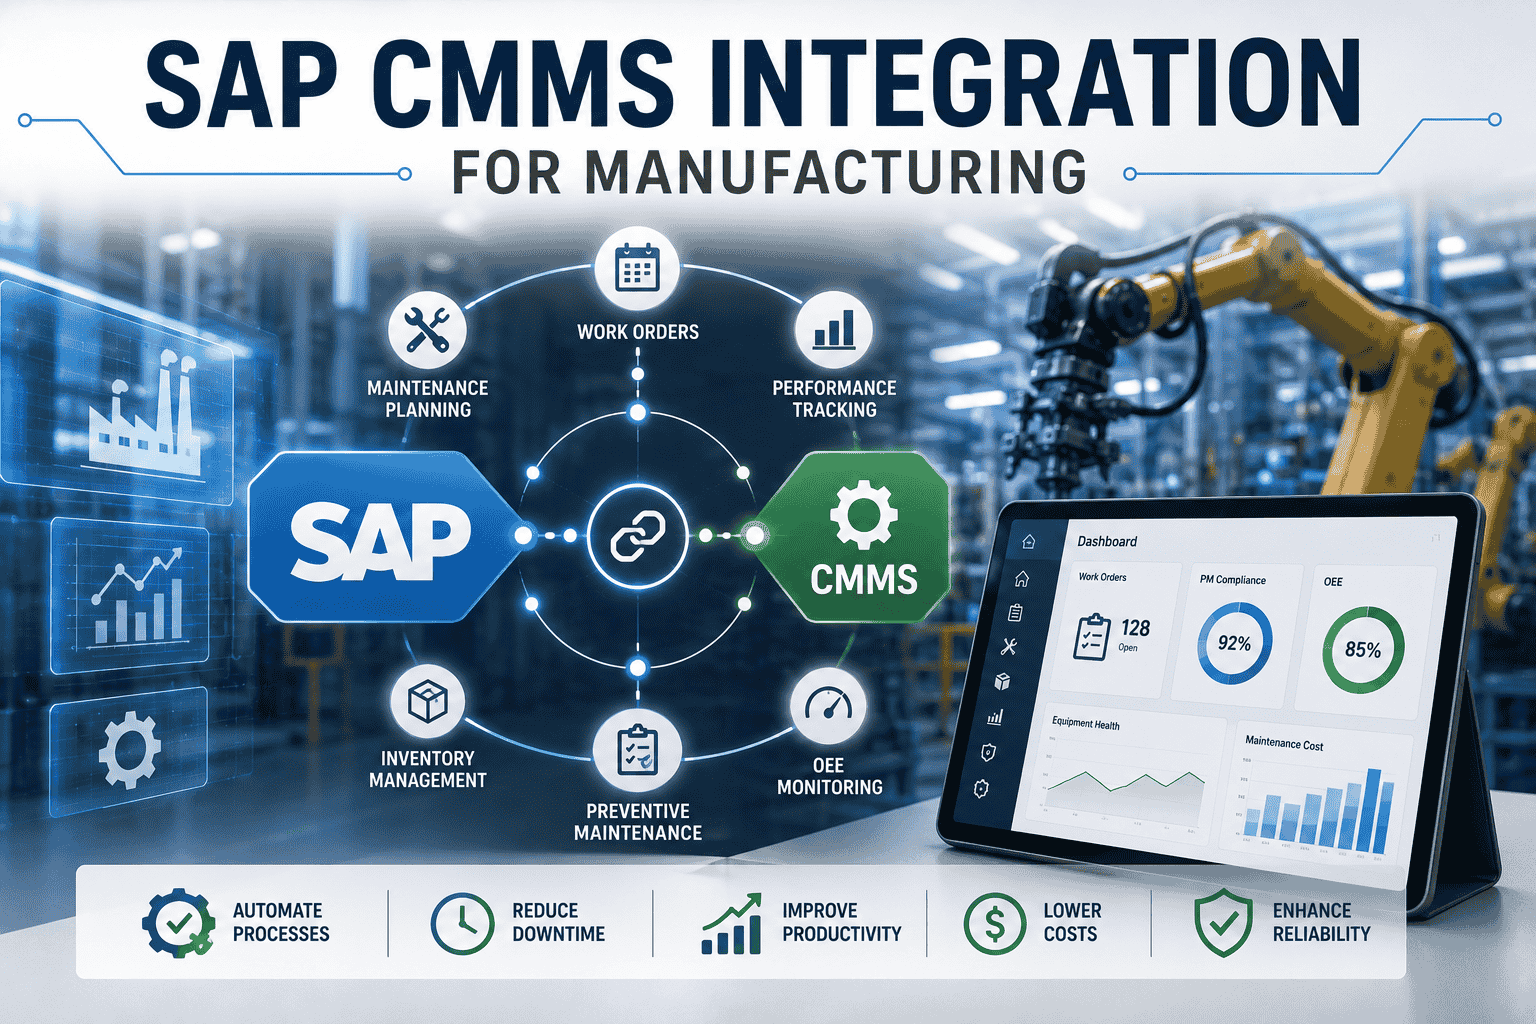
Higher education sits on $197 billion in deferred maintenance—an entropy bill that compounds quietly while enrollment forecasts trend downward. The buildings on most American campuses are older than the deans who manage them, and the gap between annual capital renewal needs and actual funding produces the FCI scores that dominate facilities board presentations. SAP PM gives universities the financial backbone; the CMMS layer turns work orders into the documented FCI evidence that boards, trustees, and bond rating agencies require. Book a free demo to walk through campus SAP-CMMS integration.
$197B
U.S. higher education deferred maintenance backlog (APPA, latest estimate)
Source: APPA / Gordian
$140+
Average deferred capital renewal cost per gross square foot, up from $125 in 2022
Source: Gordian State of Facilities Report
43,000
Higher-education buildings actively benchmarked in industry condition databases
Source: Gordian
13%
Projected decline in U.S. high school graduates between 2025 and 2041
Source: WICHE / Gordian
Why Higher Ed Facility Maintenance Is a Crisis Hiding in Plain Sight
Campus facilities operate under a structural problem no other industrial environment quite shares: a 50-to-150-year asset base, a single annual budget cycle, a board that wants to fund academics rather than mechanical rooms, and an FCI metric that gets calculated whether the facilities team produces it or not. Every year that capital renewal funding lags actual renewal need adds to the deferred maintenance backlog, and unlike industrial equipment that fails in a measurable downtime event, campus buildings degrade silently—until a steam line bursts under a classroom, a residence hall HVAC fails the week of move-in, or a research lab loses chilled water during a critical study.
SAP PM brings the asset master, cost center, and financial governance that institutional research and finance offices require for audited reporting. What it doesn't deliver out of the box is the CMMS-layer functionality that translates daily work orders into FCI scores by building, into capital renewal forecasts by system, and into the bond-eligible documentation that supports facility-funded capital campaigns. Facilities directors ready to layer that execution capability on top of SAP PM can Sign up free to start generating FCI-ready evidence from the first work order.
The Campus FCI Distribution by Building Category
The visualization below shows what an institutional facilities portfolio actually looks like when FCI scores are calculated at the building level and rolled up by category. The example reflects a mid-size research university with 68 buildings totaling 3.25 million gross square feet. The pattern—research and residential carrying the worst FCI distribution while athletics and admin sit relatively healthy—is consistent across the higher-ed institutions APPA and Gordian benchmark annually.
Good · FCI 0-5%
Fair · FCI 5-10%
Poor · FCI 10-30%
Critical · FCI 30%+
ACADEMIC
24 buildings · 1.2M sf · Avg FCI 0.14
RESIDENTIAL
18 buildings · 850K sf · Avg FCI 0.18
RESEARCH
12 buildings · 600K sf · Avg FCI 0.24
ATHLETICS
8 buildings · 400K sf · Avg FCI 0.09
ADMIN / AUX
6 buildings · 200K sf · Avg FCI 0.07
The pattern this view exposes is what makes board presentations actionable. Research buildings—the most expensive square footage to operate and the most reputationally critical—carry the worst FCI distribution, with two buildings already in critical condition where renovation costs exceed new construction. That is the data that justifies capital campaign priorities, not the data that describes "general deferred maintenance" in qualitative terms. Facilities directors ready to model this view on their own portfolio can Sign up free to begin building FCI evidence at the building level.
From Service Request to Closed Work Order
Campus maintenance has a unique operational characteristic: the work-order initiator is rarely a maintenance professional. Students, faculty, staff, RAs, and graduate researchers all generate service requests through portals, mobile apps, and email channels. Translating that distributed inbound stream into prioritized, asset-linked, FCI-tracked work orders is what separates a working campus CMMS from a tool that collects requests faster than it resolves them.
T+0
Service Request Submitted
Student or staff reports issue via mobile portal, QR code on building plaque, or email. Building, room number, and issue category captured. Auto-acknowledgment sent with tracking ID.
T+15 min
Auto-Triage & Asset Linkage
Request matched against SAP PM functional location hierarchy. Severity scored. Work order auto-created with cost center, building, and asset linkage. Priority assigned by impact and category.
T+1 hr
Crew Dispatch
Work order routed to building-zone crew or specialty trade. Mobile alert sent with full asset history, parts likely needed, and access requirements (after-hours, secured spaces, lab safety).
T+4 hrs
Field Execution & Data Capture
Technician arrives, completes repair. Time, parts, and condition observations captured on mobile. Photos pre/post. Building condition rating updated if material change observed.
T+5 hrs
SAP Posting & FCI Update
Labor and materials post to SAP cost center. Requester receives completion notification. Building FCI calculation incrementally updated. Capital renewal forecast refreshed.
The traditional version of this same workflow—paper service ticket walked across campus, manual dispatch via radio, end-of-week reconciliation, no FCI tracking—takes days to close, leaves the FCI calculation entirely separate from operations data, and produces the qualitative narrative that boards stopped accepting two budget cycles ago. The round-trip model is what generates board-ready evidence.
Capital Renewal, FCI Reporting & the Board Presentation
Three reporting structures dominate higher-ed facilities communication: the FCI dashboard for the board, the capital renewal plan for the CFO, and the bond-eligible documentation for rating agencies during debt issuance. Each draws from the same underlying work order data—but only if that data is captured with the right metadata structure from the first ticket.
FCI
Board & Trustee Dashboard
Building-by-building Facility Condition Index, trended quarter-over-quarter. The single metric trustees and presidents look at first. APPA-aligned methodology produces comparability across institutions.
Data captured
Deferred backlog by building · Current replacement value · Renewal investment · Trend direction
CRP
5-Year Capital Renewal Plan
Rolling capital renewal forecast feeding the CFO's annual budget and capital plan submission. Translates per-building backlog into year-by-year funding requirements with cost-of-delay scenarios.
Data captured
System-level renewal needs · Cost escalation by year of deferral · Funding gap analysis
BOND
Rating Agency Documentation
Documented evidence of stewardship for Moody's, S&P, and Fitch when the institution issues capital bonds. Strong FCI trends and capital renewal discipline directly support credit ratings and reduce borrowing costs.
Data captured
Multi-year FCI trends · Capital deployment evidence · Asset condition assessments
The single most overlooked of these is the rating agency dimension. Universities that issue bonds for academic buildings, residence halls, or athletic facilities pay credit-rating-determined interest rates over 20-to-30-year terms. A documented program of capital stewardship—FCI trending in the right direction, capital renewal occurring on schedule, deferred backlog reducing year-over-year—directly supports stronger credit ratings and measurably lower borrowing costs across hundreds of millions in institutional debt.
See Campus SAP-CMMS Running on Your Building Portfolio
Walk through service requests, work orders, FCI calculation, and capital renewal forecasting on your own building portfolio. 30 minutes, with your actual asset register.
ROI: What Integration Returns at Campus Scale
The financial case for campus CMMS integration sits on three compounding factors: avoided emergency repair premiums (every $1 of preventive saves $4 of failure response), reduced cost-of-delay on deferred maintenance, and the credit-rating effect on long-term borrowing costs that compounds over decades. The numbers below come from operating data at mid-size research universities and regional comprehensive institutions.
Swipe to compare
$4
Saved per $1 of preventive maintenance executed on schedule
60-90 days
Typical implementation timeline including building data import
The biggest single financial lever at most institutions isn't the operational savings—it's the credit-rating effect. A university that demonstrates documented capital stewardship typically borrows at 15 to 40 basis points below comparable institutions that don't, which on a $500 million capital plan over 25 years adds up to tens of millions in avoided interest expense. That is the math that makes campus CMMS investment a treasurer-level decision rather than a facilities-budget decision. Vice presidents for finance ready to model this can Book a free demo to walk through credit-rating and FCI evidence flow.
Expert Perspective: Why Campus CMMS Programs Stall
The institutions that get this right stop treating facilities as a cost center and start treating it as capital stewardship. The shift is conceptual but the consequences are operational. When FCI flows from work orders rather than from one-off condition assessments, when capital renewal plans build from the same data that generated last week's emergency repair, when the board sees a quarter-over-quarter FCI trend instead of an annual narrative—the conversation about facility funding changes. Universities that hold the conversation in those terms get capital plans approved. The ones that talk about general deferred maintenance keep absorbing the next steam-line failure.
Build for FCI From Day One
Every work order, every condition observation, every renewal investment has to roll up to building-level FCI. Retrofitting FCI on top of a CMMS designed without it is expensive and never gets fully done.
Connect to Capital Renewal Planning
Operational maintenance and capital renewal are the same conversation at different time scales. The CMMS that doesn't feed the 5-year capital plan is a workflow tool, not a strategic asset.
Make the Treasurer a Stakeholder
The biggest financial impact of integrated facilities data isn't operational—it's the bond credit rating effect. Programs that engage the VP for Finance early get prioritized and funded.
90-Day Path to Integrated Campus Operations
Campus implementations succeed when they deliver building-level FCI evidence within the first quarter, then scale across the institution in a structured second phase. The roadmap below is what successful research universities, regional comprehensive institutions, and large community college systems consistently execute.
Days 1–20
Building & Asset Import
Import building register and SAP PM functional location hierarchy. Validate replacement values per building. Establish FCI methodology aligned with APPA standards.
Days 21–45
Service Request & Mobile Go-Live
Activate student / staff service request portal. Deploy mobile work orders to trades crews. Validate round-trip from request to SAP-posted closure on common issue types.
Days 46–70
PM Schedules & FCI Calculation
Deploy PM schedules across HVAC, plumbing, electrical, building envelope. Activate FCI calculation engine. Begin trending building condition data quarter-over-quarter.
Days 71–90
Board & Treasurer Reporting
Activate FCI dashboard for trustees. Generate first 5-year capital renewal plan from CMMS data. Connect to treasurer for bond-eligible documentation export.
By day 90, institutions executing this roadmap typically have their first building-level FCI dashboard live for board review, the next quarterly trustee meeting set to receive data-driven facility evidence rather than narrative, and the treasurer engaged on credit-rating implications. Facilities directors ready to start the building import phase can Sign up free to start importing the campus building register this week.
Turn Campus Facilities Into a Capital Stewardship Story
Every work order documented. Every FCI calculated. Every capital plan board-ready. See SAP-integrated campus CMMS running on your building portfolio in a live walkthrough.
Frequently Asked Questions
What is FCI and why does it dominate higher-ed facilities reporting?
Facility Condition Index (FCI) is the ratio of a building's deferred maintenance backlog to its current replacement value. A building worth $20 million with $2 million in deferred maintenance has FCI of 0.10 (Fair). The same building with $6 million deferred has FCI of 0.30 (Poor)—approaching the threshold where renovation costs exceed new construction. FCI is the standardized metric APPA promotes and that boards, trustees, and accreditors use to compare institutions. It dominates higher-ed reporting because it produces an objective number from operational data and makes capital renewal conversations defensible.
How does SAP PM connect to APPA FCI methodology?
SAP PM holds the asset master, functional location hierarchy, and cost center structure that FCI calculations require. The CMMS layer captures the operational data—deferred renewal needs by building, system, and component—that feeds into the FCI formula. APPA methodology is workflow-agnostic; it specifies what the formula calculates and how to interpret results, while leaving the underlying data capture to the institution's chosen systems. SAP-integrated CMMS produces APPA-aligned FCI as a byproduct of normal work order operations rather than as a separate condition-assessment exercise.
What impact does documented facility stewardship have on bond ratings?
Rating agencies—Moody's, S&P Global, and Fitch—evaluate facility stewardship as part of institutional creditworthiness. Universities that demonstrate documented FCI trending improvement, capital renewal discipline, and reduced deferred backlog typically borrow at 15 to 40 basis points below comparable institutions without that documentation. On a $500 million capital plan over 25 years, that interest-rate differential compounds into tens of millions in avoided interest expense. The impact is large enough that the treasurer is often the strongest internal advocate for facility CMMS investment.
How long does a campus implementation typically take?
A focused phased implementation runs 60 to 90 days from kickoff to operational FCI reporting. Building register import and SAP PM mapping completes by day 20. Service request go-live and mobile crew deployment is operational by day 45. PM schedules and FCI calculation activation lands by day 70. Board-ready reporting and capital renewal planning integration is operational by day 90. Larger institutions with deep building registers may extend this to 120-150 days for full coverage, but pilot building groups can be operational within the standard 90-day window.
Can the system handle the diversity of campus building types—from research labs to residence halls to historic buildings?
Yes. The SAP PM functional location hierarchy supports virtually any building taxonomy, and the CMMS layer accommodates building-type-specific PM templates: research labs require fume hood certification cycles, residence halls require turn-cycle PM schedules around academic calendar transitions, historic buildings require preservation-trade work orders that document period-specific materials and methods. Each building type retains its specialized workflow while rolling up into the same FCI calculation and capital renewal planning structure that governs the entire portfolio.