oil-gas-sap-pm-integration

Oil and Gas Maintenance Management with SAP PM and CMMS Integration


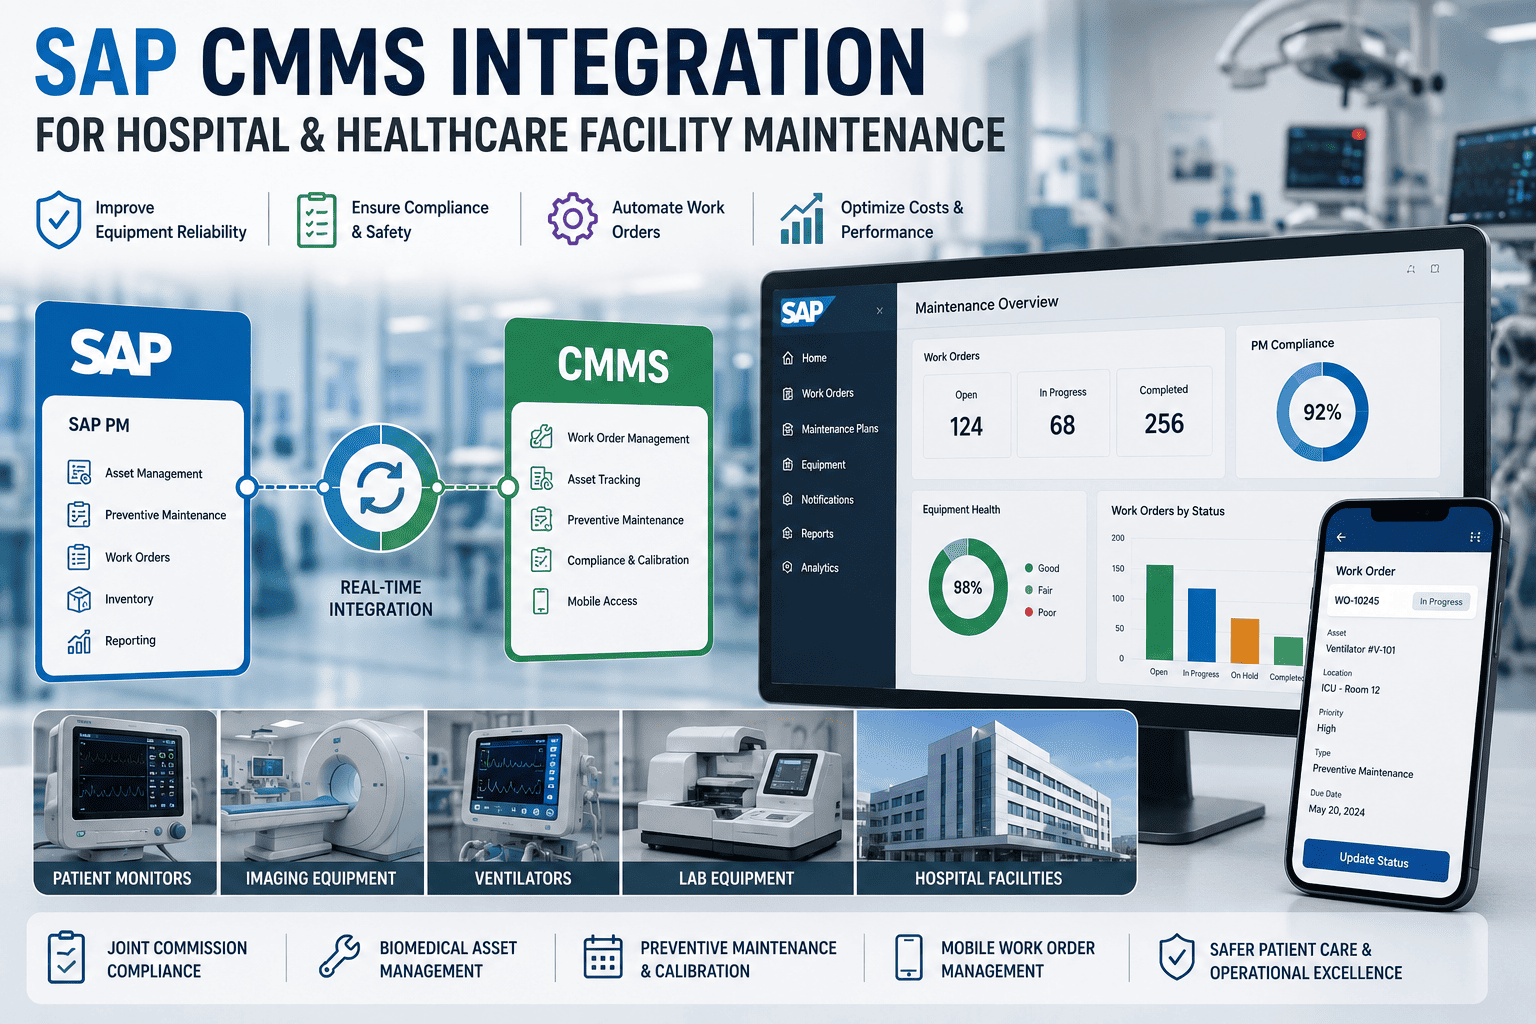
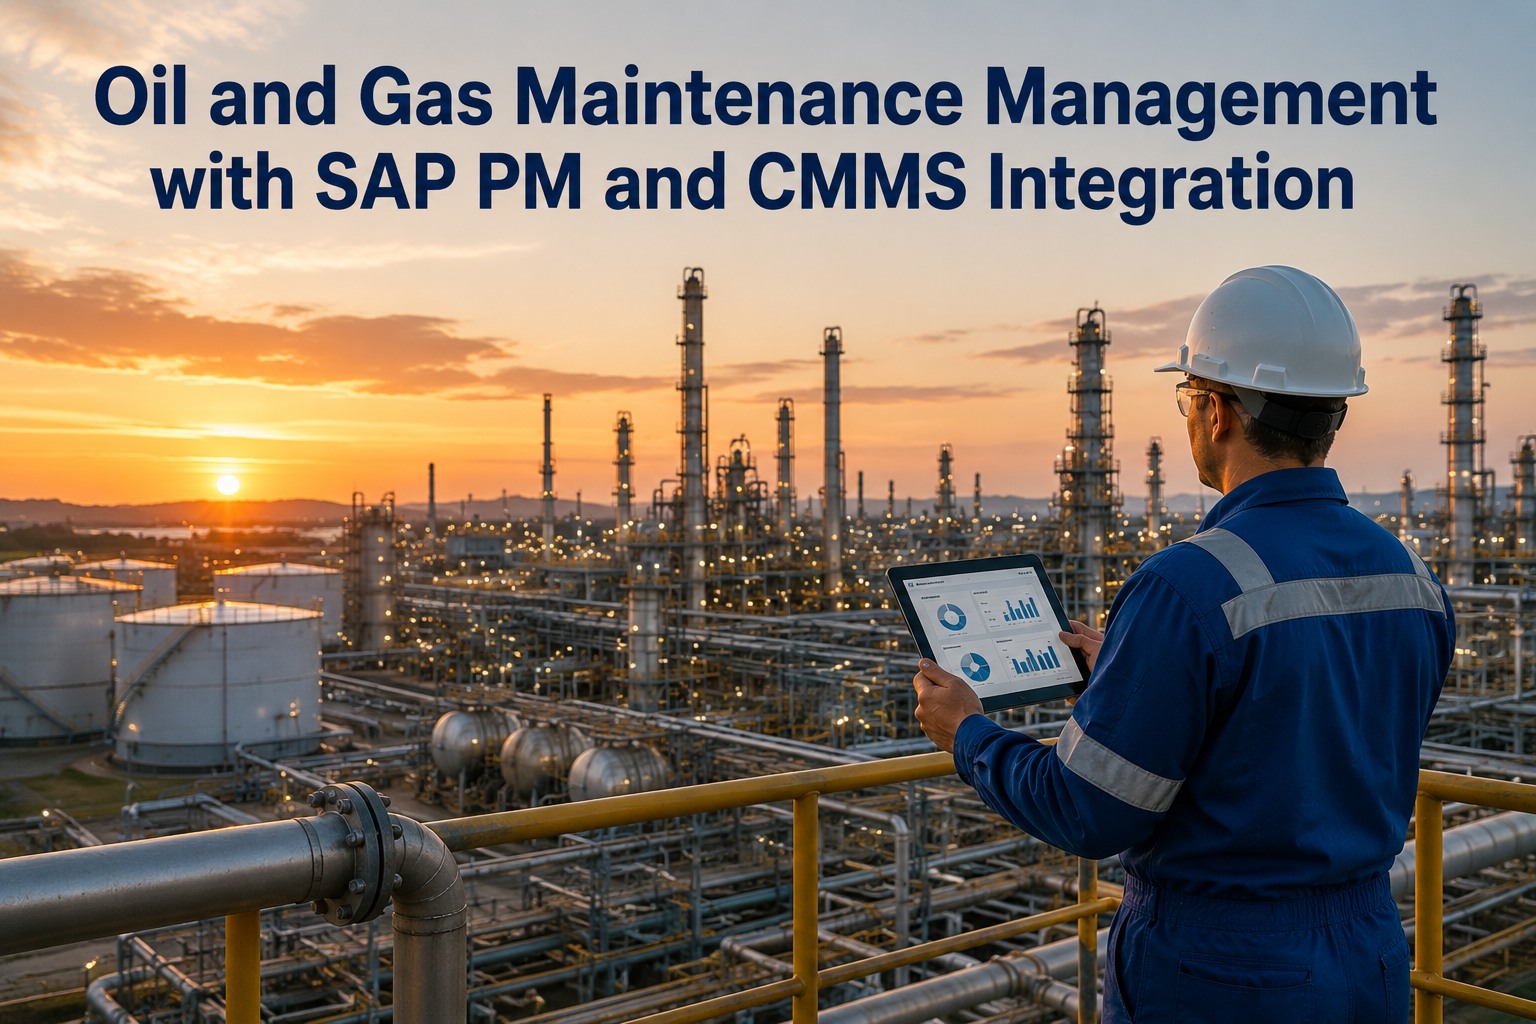
Oil and gas maintenance operates under conditions that make general industrial maintenance look forgiving. A pump failure on a wellpad cascades through gathering systems. A pipeline corrosion event triggers PHMSA disclosure. A refinery process upset becomes a Tier 1 process safety event. The asset base is geographically distributed, regulated by API and ASME codes, and bound by OSHA Process Safety Management requirements that demand documented evidence of maintenance integrity. Integrated SAP PM and CMMS architecture is how disciplined operators turn that complexity into operational discipline. Book a free demo to walk through O&G maintenance integration.

Oil & Gas Maintenance Reality
The Stakes Behind Every Asset Integrity Decision
$50-250M
Typical refinery turnaround cost; petrochemical TARs can run higher
Source: Industry TAR benchmarks
$1-5M/day
Cost of unplanned shutdown at a major refinery or processing facility
Source: Lost production calculations
29 CFR 1910.119
OSHA Process Safety Management standard governing highly hazardous chemical operations
Source: U.S. OSHA
API 580/581
Risk-Based Inspection methodology used across upstream, midstream & downstream
Source: API standards

The Scale of Oil & Gas Maintenance

Oil and gas operators run asset bases that span continents, regulatory regimes, and operating conditions. A single integrated company might operate upstream wellpads in West Texas, midstream pipeline networks spanning multiple states, and downstream refineries each individually larger than most industrial facilities elsewhere. Each of those segments has its own asset classes, API and ASME standards, inspection codes, and regulatory frameworks (PHMSA for pipelines, OSHA PSM for processes, EPA for emissions, state agencies for local compliance). The maintenance organization has to coordinate across all of this while meeting the asset integrity, mechanical reliability, and process safety standards that the industry takes as table stakes.

The integration challenge is fundamentally that single-site tools weren't designed for this scope. A CMMS deployed at one refinery doesn't natively connect to the corporate SAP PM instance that finance uses for cost reporting. The upstream production team uses different reliability software than the midstream pipeline team. The data fragmentation that results makes process safety reporting harder, makes capital planning less defensible, and makes regulator interactions more painful than they need to be. Maintenance and reliability leaders ready to scope this integration on their full asset base can Sign up free to begin an upstream-to-downstream asset audit.

How SAP PM + CMMS Solves Oil & Gas's Unique Challenges

Three integration challenges differentiate O&G from other process industries. First, the API and ASME inspection codes (API 510, 570, 653, 580, 581, 610, 617, etc.) carry specific cadence and documentation requirements that have to map directly to PM plans. Second, the regulatory frameworks—PSM, PHMSA, BSEE for offshore—require evidence chains that span maintenance work orders, inspection reports, and event documentation in formats regulators recognize. Third, the assets sit in operating conditions (high pressure, high temperature, sour service, offshore environments) that make condition monitoring and risk-based inspection mandatory rather than optional.

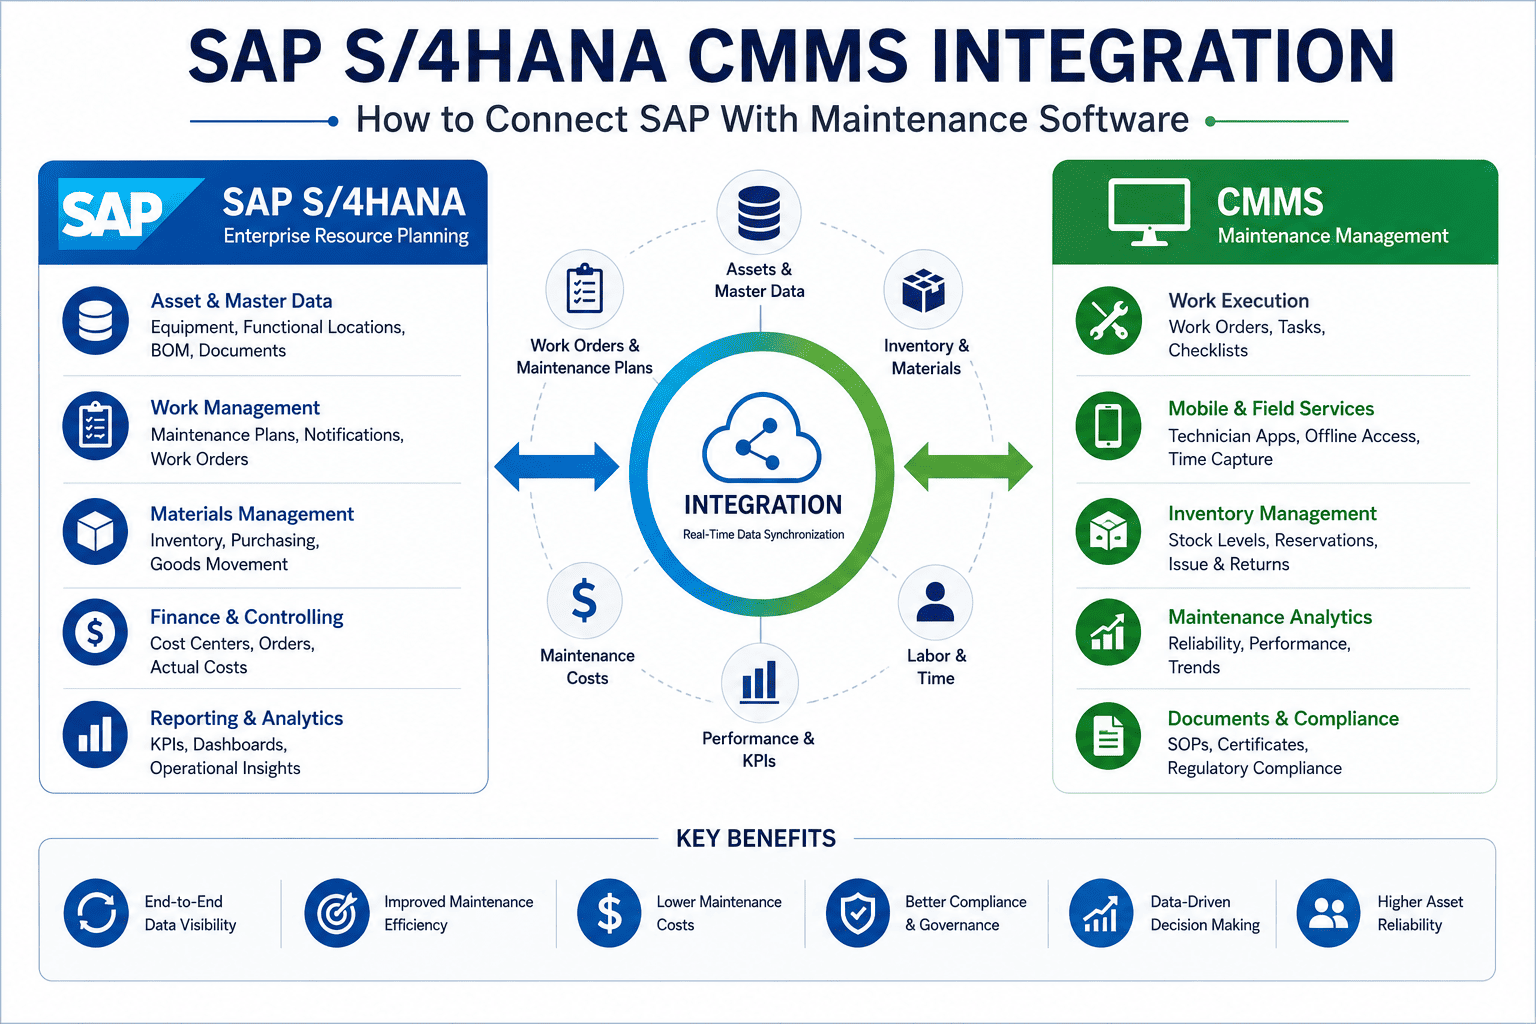
SAP PM provides the financial governance, equipment master, and cost center architecture that corporate finance and asset planning require. The CMMS layer provides the field execution, mobile work orders, condition monitoring integration, and inspection workflow management that operations need. Together, the integration produces the evidence chains—linking RBI calculations to inspection findings to PM completions to maintenance cost—that operate at the documentation depth O&G regulators expect.

The Asset Integrity Bowtie: Where SAP PM and CMMS Operate

The process safety bowtie below shows how integrated SAP-CMMS architecture supports asset integrity from threat to consequence. The center is the critical event the maintenance program exists to prevent. The left side shows the threats that drive risk into the asset; each is mitigated by a specific prevention barrier operationalized through SAP PM workflows. The right side shows the consequences that materialize if the critical event occurs; each is reduced by a recovery barrier supported by CMMS workflows.

Process Safety Bowtie · Integrated SAP-CMMS Support
Threats → Prevention Barriers → Critical Event → Recovery Barriers → Consequences
PREVENTION SIDE
CRITICAL EVENT
RECOVERY SIDE
Threats
T1Corrosion / Erosion (vessels, piping, tanks)
T2Vibration / Fatigue (rotating equipment)
T3Operator error / Procedural deviation
T4Instrument / SIS function failure
T5Material defect / Manufacturing flaw
Prevention Barriers
P1RBI Inspection · API 580/581
P2Vibration & Condition Monitoring · ISO 14224
P3Training Records & LOTO Discipline
P4SIS Proof Test · IEC 61511
P5Material Traceability & QA/QC Records
CRITICAL EVENT
Loss of Primary Containment / Asset Functional Failure
Tier 1 or Tier 2 process safety event per API RP 754
TriggerThreat penetrates prevention
DetectionSensor / observation / alarm
OutcomeDepends on recovery barriers
Recovery Barriers
R1Emergency Response Plan & Drill Cadence
R2Spill Response & Containment Procedures
R3Production Restoration Playbooks
R4Incident Investigation & RCA Workflow
R5Regulatory Reporting & Stakeholder Comms
Consequences
C1Personnel injury or fatality
C2Environmental release / spill
C3Production loss / deferred revenue
C4Regulatory enforcement (PHMSA, OSHA, EPA)
C5Reputational & community impact

The bowtie's discipline is that each barrier has to operationalize—not exist in policy alone. A prevention barrier like RBI inspection (P1) is operationalized through SAP PM inspection plans that link to specific equipment, generate work orders at API 580-derived intervals, and capture inspection findings as structured data feeding back into RBI recalculation. A recovery barrier like RCA workflow (R4) is operationalized through CMMS-driven incident investigation that links the event to causal equipment records and remediation actions. The integrated architecture is what turns the bowtie from a poster on a wall into operational reality. Asset integrity and reliability leaders ready to map their current barriers can Sign up free to score current barrier maturity against the bowtie framework.

From Threat Detection to Documented Response

The single highest-value workflow in O&G maintenance is the response sequence from threat detection through documented resolution. The pipeline below shows how an integrated SAP-CMMS architecture turns each step into evidence that survives regulator scrutiny.

From Threat Detected to Audit-Ready Documentation
Integrated workflow from sensor reading to PHMSA / OSHA-grade evidence chain
T+0
Condition Signal Detected
Vibration anomaly, corrosion thinning beyond limit, pressure-temperature excursion, SIS proof-test failure, or RBI calculation flags rising risk. Signal auto-logged with timestamp, equipment ID, and severity score.
T+10 min
Notification Generated & Routed
SAP PM notification created with equipment master linkage, cost center, criticality, and HSE escalation flag. Routing per organization's risk-tiered escalation matrix to reliability engineer, operations, and HSE.
T+1 hr
Risk Assessment & Work Order Decision
Reliability engineer reviews signal context (RBI history, prior inspections, criticality). Decision: continued monitoring, scheduled inspection, or immediate work order. Decision captured with rationale and approver.
T+Hours-Days
Field Inspection / Repair & Mobile Capture
Crew dispatched with permit-to-work, JSA, and inspection plan. Mobile capture of findings, photos, measurements (UT readings, ultrasonic thickness, vibration spectra). Findings auto-link to equipment record.
T+1-7 days
RBI Recalculation & Reporting
Findings feed back into RBI calculation. New risk score and next inspection date updated. Required regulatory reports (PHMSA, OSHA, state) auto-compiled. Lessons learned captured for similar equipment population.

The differentiator from manual workflows isn't speed—it's audit-grade evidence chain. When a regulator or insurance carrier asks two years later for the response history on a specific asset, the integrated record produces it from a single query against linked SAP PM and CMMS data. That documentation completeness is what separates operators who emerge from regulatory inspections cleanly from those who emerge with consent decrees.

See the Bowtie Operationalized on a Live O&G Operation
Walk through how prevention and recovery barriers run on real asset data with RBI integration, mobile inspection capture, and PHMSA-grade evidence chains. 30-minute live walkthrough.

ROI: What Integration Returns at O&G Scale

The financial case for O&G CMMS integration sits on three compounding factors: avoided process safety events (Tier 1 and Tier 2 PSEs carry consequences in the tens of millions), reduced unplanned shutdown frequency (each avoided shutdown at a major facility is worth $1-5M per day), and turnaround execution discipline (predictable TAR delivery vs the industry's chronic 50%+ over-budget pattern).

Fragmented Tools vs Integrated SAP-CMMS: Annual O&G Performance Delta
Swipe to compare
Operating Metric Fragmented Tools Integrated SAP-CMMS Shift
Mechanical availability 92-94% 96-98% +3-4 pts
PM compliance rate 70-80% 90-95% +15-20 pts
RBI inspection adherence Variable Tracked to date Material
Turnaround budget variance +15-30% ±5-10% Major
Process safety event response time Hours-Days Minutes-Hours Material
Audit finding cost (per cycle) $500K-$2M $50-250K −80%+
9-15 mo Typical payback for full SAP-CMMS integration at major O&G operator
$5-25M/yr Avoided cost at large refinery or integrated upstream operation

The largest single ROI lever isn't the operational metrics—it's the avoided Tier 1 process safety event. A single major PSE can carry combined cost (cleanup, litigation, capital remediation, lost production, reputation) reaching hundreds of millions, with the most severe events crossing $1B. The integrated documentation discipline that drives down the probability of a PSE is the highest-value capability the integration delivers, even if it's the hardest to model precisely. Finance and operations leaders ready to model the risk-adjusted ROI on their portfolio can Book a free demo to walk through risk-adjusted ROI on an upstream-to-downstream portfolio.

Expert Perspective: What Distinguishes Mature O&G Reliability Programs

The oil and gas operators I've seen mature their reliability programs successfully share a property that often surprises outside engineers: they treat the bowtie as an operational tool, not a poster. Every prevention barrier has a named owner, a defined PM workflow, and an evidence requirement. Every recovery barrier has rehearsed procedures, named responders, and documented post-event review. When a regulator asks about a specific equipment record, the answer comes from integrated SAP-CMMS data in minutes, not from a multi-week evidence-assembly effort. The operators that struggle have the same nominal programs but the bowtie lives in PowerPoint while the operational reality is fragmented spreadsheets and disconnected systems. The difference isn't engineering competence—the engineering competence is comparable. The difference is the discipline of operationalizing the framework through integrated tooling.

Bowtie as Operational Tool
Every barrier has named owner, PM workflow, and evidence requirement. The framework isn't a wall poster; it's the operational architecture of the reliability program.
Evidence on Demand
Regulator asks about specific equipment, the answer comes from integrated data in minutes. Multi-week evidence assembly indicates the integration architecture isn't operational—it's nominal.
RBI Drives PM, Not Calendar
Modern programs use Risk-Based Inspection (API 580/581) results to drive inspection cadence, not calendar defaults. The integration architecture has to support dynamic interval adjustment based on findings.

90-Day Path to Integrated O&G Operations

O&G operators that successfully deploy SAP-CMMS integration follow a consistent cadence: establish equipment master discipline, integrate condition monitoring and RBI workflows, activate mobile inspection capture, and validate regulatory reporting. The roadmap below is what disciplined teams execute.

90-Day O&G Integration Deployment
From equipment master baseline to operational bowtie
Days 1–20
Equipment Master & Criticality Baseline
Inventory critical equipment across selected facility. Establish equipment master with API class, ISO 14224 taxonomy, and criticality ranking. Cost center and functional location alignment with corporate SAP.
Days 21–45
RBI & Condition Monitoring Integration
Integrate RBI calculation engine and condition monitoring streams (vibration, corrosion monitoring, process data historian). Map RBI outputs to SAP PM inspection plan generation. Validate end-to-end data flow.
Days 46–70
Mobile Inspection & PM Activation
Deploy mobile inspection capture to field inspectors and mechanics. Activate PM and inspection plans across all critical equipment. Validate permit-to-work and JSA workflow integration. Train field teams.
Days 71–90
Regulatory Reporting & Bowtie Validation
Activate automated PSM, PHMSA, and state regulatory reporting workflows. Validate against current requirements. Test bowtie barrier operations end-to-end. Establish KPI dashboard for reliability leadership review.

By day 90, the integration is operational across the facility's critical equipment population, the bowtie barriers are operationalized through PM and CMMS workflows, and the regulatory reporting workflows produce audit-grade documentation as a byproduct of daily operations. Reliability and operations leaders ready to start the baseline phase can Sign up free to begin equipment master baseline on a single facility this week.
Turn Process Safety From Compliance Burden Into Operational Discipline
Ten bowtie barriers operationalized. RBI-driven inspection plans. Mobile field capture. PHMSA / OSHA / PSM evidence chains. See the framework running on a live oil and gas operation.

Frequently Asked Questions

How does SAP PM integration handle API 580/581 Risk-Based Inspection?
Integration with RBI workflows happens through API calls between the RBI calculation engine and SAP PM's inspection plan management. RBI results (risk score, recommended next inspection date, inspection scope) drive generation of inspection-type work orders against the equipment master. Inspection findings (UT readings, visual observations, sample results) flow back to the RBI engine as updated condition data, triggering recalculation. The integration produces the audit-traceable cycle that API 580/581 expects—risk drives inspection, inspection updates risk, all changes documented with rationale and approver.
What's the relationship between OSHA PSM and SAP PM workflows?
OSHA Process Safety Management (29 CFR 1910.119) requires documented evidence of mechanical integrity for equipment in highly hazardous chemical service. SAP PM workflows operationalize three of the 14 PSM elements directly: Mechanical Integrity (training, inspection, maintenance procedures, deficiency correction), Management of Change (equipment master updates with MOC linkage), and Pre-Startup Safety Review (PSSR documentation linked to commissioning work orders). The integration produces the audit trail PSM auditors expect—PM completion records, inspection findings, MOC linkages, and deficiency correction documentation all queryable from one integrated source.
How does the integration handle distributed assets across multiple sites and segments?
The architecture uses SAP PM's functional location hierarchy to model the full asset universe—corporate, business unit, facility, area, equipment. Multi-site operations link to a single corporate SAP instance for financial governance while allowing site-specific configuration of PM workflows, inspection plans, and reporting. The CMMS layer handles mobile work execution and operations-technology integration at the site level. Master data discipline at the corporate level ensures comparability across sites; site-level configuration accommodates legitimate operating differences (upstream wellpads vs midstream pipelines vs downstream refineries).
What's the standard approach to ISO 14224 reliability data?
ISO 14224 (Collection and exchange of reliability and maintenance data for equipment) provides the taxonomy O&G operators use to classify equipment, failure modes, and maintenance activities for reliability analysis. Integration adopts the ISO 14224 taxonomy in the equipment master classification, failure mode coding in notifications, and activity coding in work orders. This produces reliability data that supports MTBF, MTTR, and availability analysis at equipment-class level across the portfolio. Industry benchmarking organizations (Solomon Associates, OREDA) use ISO 14224 data formats, so the discipline also enables external benchmarking.
How does pipeline integrity management integrate with SAP PM?
Pipeline operators face PHMSA Integrity Management requirements (49 CFR 192 for gas, 49 CFR 195 for liquid) covering threat assessment, inspection cadence, and response to anomalies. Integration handles this through equipment master representation of pipeline segments (with diameter, material, MAOP, location attributes), inspection plan generation based on integrity management plans, and work order workflows for repair, recoat, and replacement programs. In-line inspection (ILI) findings flow into the equipment record as integrity data, triggering work orders for anomaly response within the regulatory response window. The architecture produces the PHMSA-grade documentation chain regulators expect during oversight reviews.


Share This Story, Choose Your Platform!