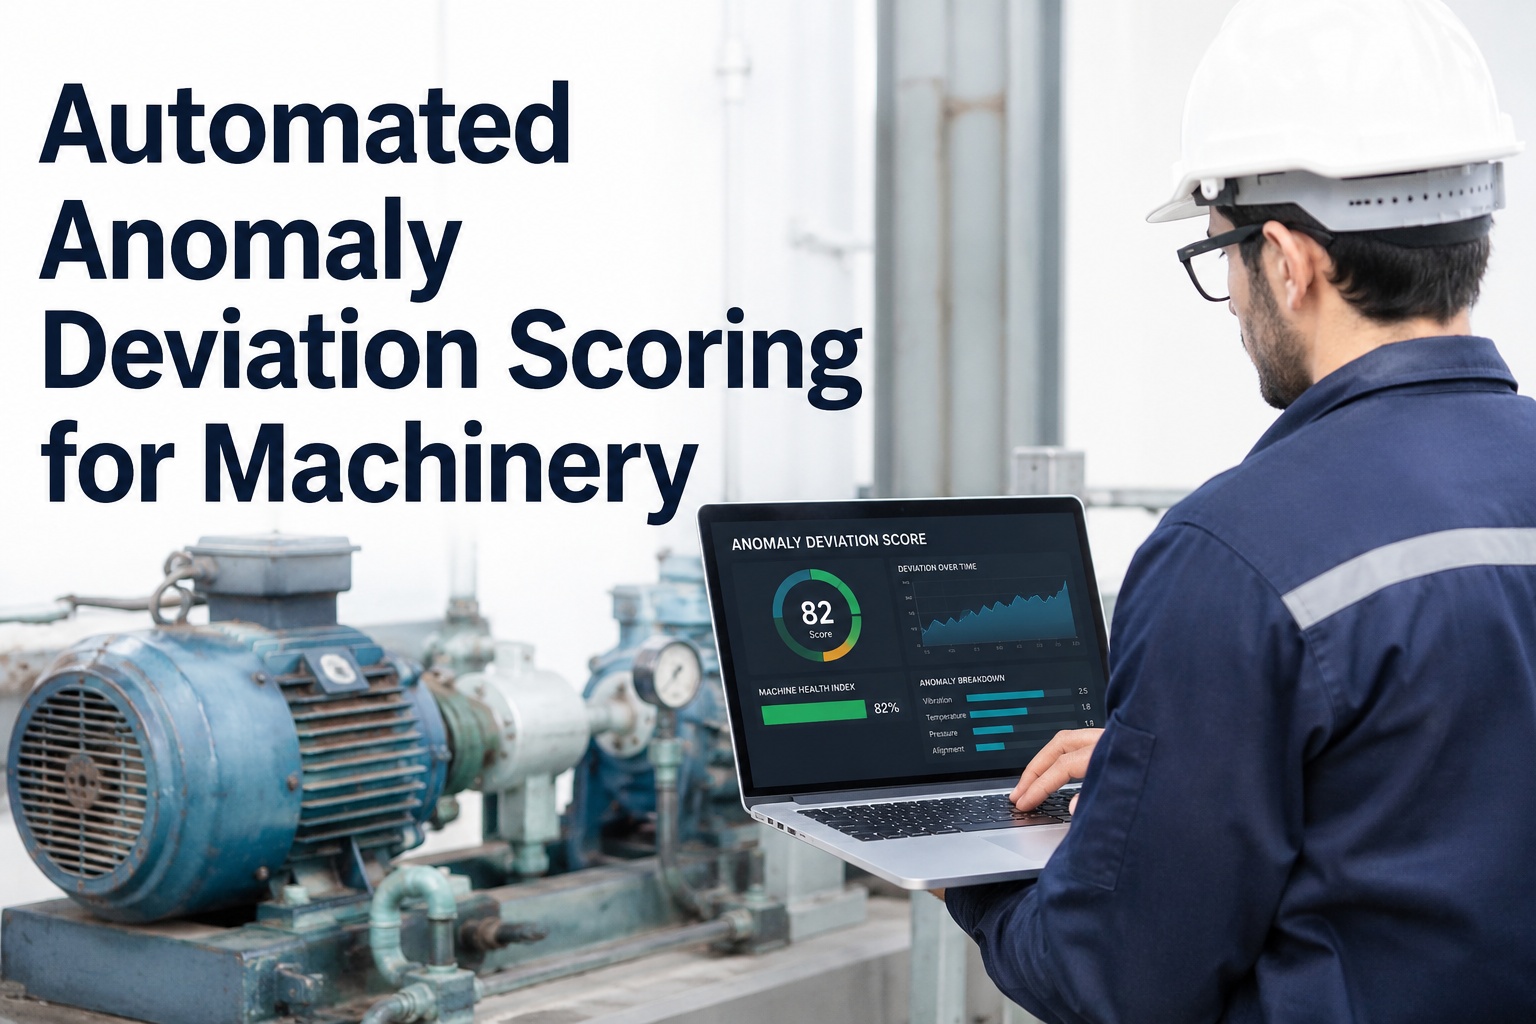
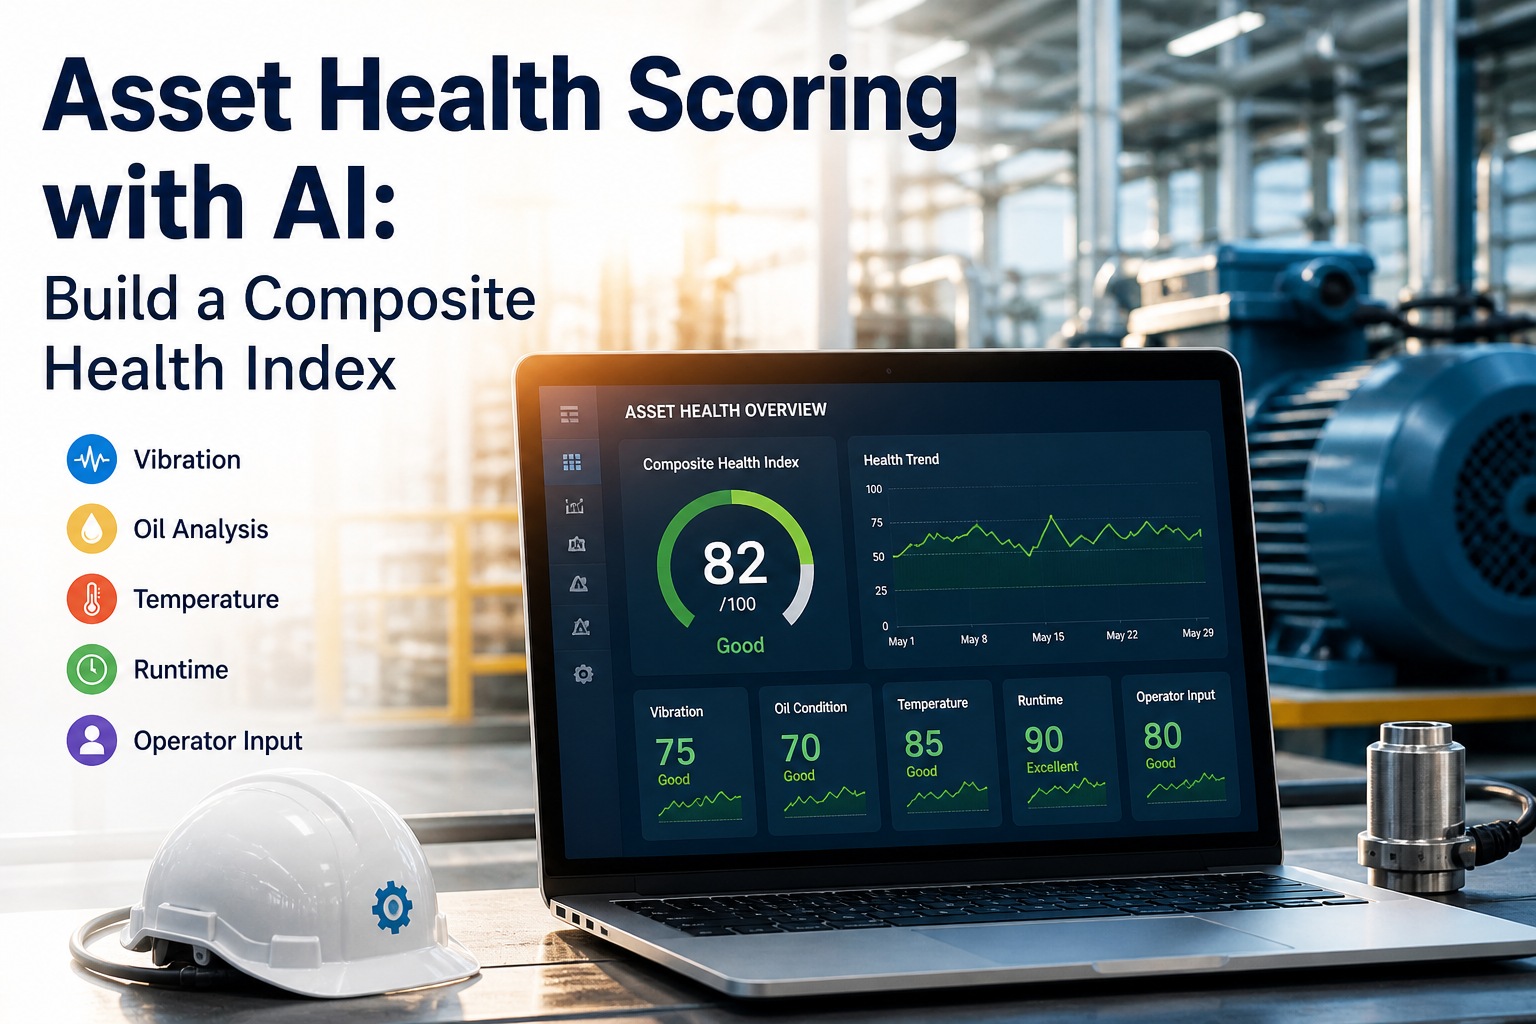
Every plant has a Joe — the senior technician who can stand next to a running motor for ten seconds and say "the inboard bearing's going, give it three weeks." Joe's interpretation is usually right and almost always undocumented. Anomaly deviation scoring is the AI equivalent: it works on every asset simultaneously, never goes on vacation, and produces a single numeric score every operator can read at a glance. Train a model on healthy operation, then continuously measure how far the live machine has drifted from that baseline — the resulting number replaces "this seems off" with "asset 4731 is at deviation 7.4 — amber, schedule investigation within 14 days." That gut-feel-to-actionable-number conversion is what makes condition-based maintenance scale beyond Joe. Sign up free to see deviation scores running on your equipment.
MAY 12, 2026 5:30 PM EST , Orlando
Upcoming OxMaint AI Live Webinar — Automated Anomaly Deviation Scoring for Machinery
Live session for plant managers, reliability engineers, and maintenance leaders moving from threshold-based monitoring to AI-driven deviation scoring. We'll walk through the autoencoder reconstruction-error model, demonstrate how healthy-machine baselines are built, show the 0–10 deviation score across vibration/thermal/visual channels, and walk through the OxMaint AI server deployment that ships pre-trained and ready to run in 6–12 weeks.
The Deviation Score — One Number, Three Zones, Zero Ambiguity
The deviation score is a continuous number scaled 0–10 that quantifies how far an asset has drifted from its healthy baseline. Zero means "indistinguishable from new." Ten means "actively failing." It collapses dozens of underlying metrics — vibration RMS, bearing fault frequencies, thermal patterns, acoustic signatures — into one number any operator can interpret without specialist training. Three threshold bands divide the scale into the actions a maintenance program actually takes.
CURRENT SCORE
7.4
AMBER · INVESTIGATE
Pump 4731 · Inboard Bearing
0.0 – 3.0
GREEN · Healthy
Within 99.95th percentile of healthy baseline. Log only.
3.0 – 7.5
AMBER · Watch
Drift detected. Inspection within 7–30 days.
7.5 – 10.0
RED · Act Now
Beyond 99.99th percentile. Auto work order, plan repair.
How the Score Is Calculated — Reconstruction Error in One Diagram
The score is the output of an autoencoder neural network used in a specific way: train it exclusively on healthy-machine data, and it learns to compress and faithfully reconstruct healthy patterns. Feed it anomalous data — bearing damage, misalignment, cavitation — and reconstruction fails, because the network never learned those patterns. The magnitude of the failure is the score. Book a demo to walk through the autoencoder pipeline on your sensor data.
Train on 30–90 days of healthy operation → autoencoder learns the manifold of normal → reconstruction error on live data, normalized to 99.95th and 99.99th percentiles, becomes the score.
One Score, Many Sensor Channels — Multi-Modal Fusion
The same reconstruction-error principle works across every sensing modality. The autoencoder doesn't care whether the input is a vibration spectrum, an audio waveform, a thermal image, or a video frame — it learns what "healthy" looks like in that signal space and flags drift. Production engines run autoencoders in parallel and fuse them into a single asset-level score weighted by which modality is most diagnostic. Sign up free to see multi-modal fusion on your asset data.
Vibration Spectra
Bearing wear · misalignment · imbalance
90% rotating equipment
Thermal Images
Bearing overheat · electrical hot spots · leaks
75% electrical / process
Visual / Video
Visual defects · subtle motion · structural
85% with motion amp
Acoustic / Ultrasonic
Cavitation · valve leaks · micro-cracks
70% fluid systems
Scene-Aware Thresholds — Why Static Cutoffs Fail
The hardest part of deviation scoring isn't the math — it's knowing what threshold to use. A pump at 100% load looks different from the same pump at 60% load. A motor on a hot summer day vibrates differently than the same motor in winter. Static thresholds that work in March trigger false alarms in August. Modern AI scoring solves this with scene-aware threshold selection — the system identifies the operating context and routes the score against the appropriate threshold for that exact regime.
STATIC
Single fixed cutoff — fails as conditions change
A score of 4.8 might be normal at 100% load and a real anomaly at 60% load. Operators learn to ignore the system after enough false alarms during shift changes, weather variance, and product changeovers.
SCENE-AWARE
Context-aware — adapts to operating regime
A parallel scene-classification network identifies load %, ambient temp, product variant, time of day, and routes the score against the threshold trained for that regime. Multiple healthy baselines, one per regime, all running in parallel.
Owned, Not Rented — The OxMaint AI Scoring Stack
The OxMaint AI Scoring deployment isn't a SaaS subscription. It's a pre-configured AI server bundled with the autoencoder training pipeline pre-loaded for vibration, thermal, visual, and acoustic channels. Get a quote and order it like the hardware it is — pre-tested, ready to begin healthy-baseline capture within days, and owned outright the day delivery completes.
Perpetual License
No monthly fees, no per-asset metering. Future costs entirely optional.
Data Sovereignty
Baselines, model weights, deviation histories live on your server, behind your firewall.
Source Access
Source code and modification rights included. Adjust thresholds, add modalities, retrain freely.
AI-Native Core
Autoencoder scoring, scene-aware thresholds, multi-modal fusion — built in, not bolted on.
Pre-Configured · Pre-Trained · Ships in 6–12 Weeks
Order an OxMaint Anomaly Scoring Stack — Pre-Loaded for Your Plant
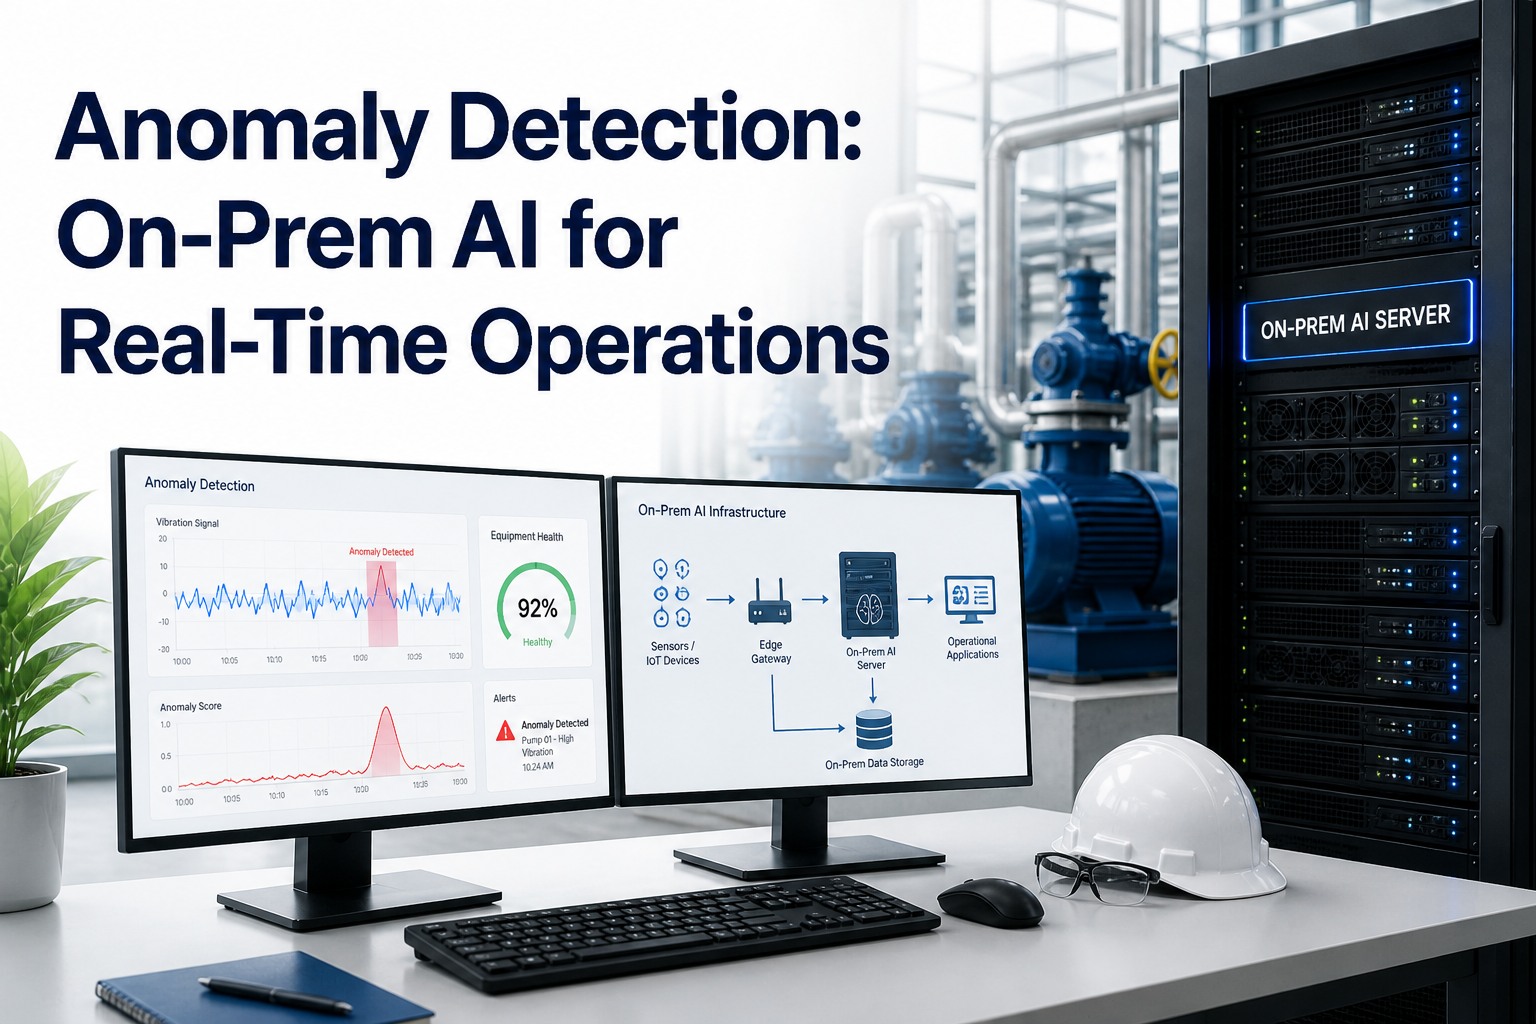
AGX Orin edge appliances running per-channel autoencoders, RTX PRO 6000 Blackwell server running multi-modal fusion and the deviation-score dashboard, automatic CMMS work orders when scores enter the red zone. Pre-trained on industrial baselines.
Inspection work order auto-drafted, severity 4–6, dispatched within 7–30 days.
Polling 4×. Trend slope monitored.
Email/Slack to reliability lead.
7.5–10
RED
Repair work order auto-generated, technician assigned, parts reserved.
Continuous polling. Live feed pinned.
SMS on-call + email + dashboard pulse alert.
Investment Summary — Per-Plant Rollout
Standard per-plant architecture: central RTX PRO 6000 Blackwell server plus two AGX Orin edge appliances. Multi-modal fusion engine, scene-aware threshold selection, and CMMS connectors all included. Book a demo to walk through pricing for your asset footprint.
Swipe to see breakdown
Component
Unit
Per Plant
Notes
RTX PRO 6000 Blackwell 96GB
$19,000
$19,000
Multi-modal fusion + dashboard
NVIDIA AGX Orin #1 (Sensor Edge)
$4,000
$4,000
Per-channel autoencoder inference
NVIDIA AGX Orin #2 (Vision + Thermal)
$4,000
$4,000
Visual + thermal autoencoders
Industrial Switch + Cabling
~$2,500
~$2,500
Cat6A, SFP modules
Local Electrical / Instrumentation
$8,000–$12,000
~$10,000
Sensor mounting, gateways
OxMaint AI Software + Integration
$35,000–$55,000
$45,000 avg
Autoencoder library, fusion, CMMS
Per-Plant Total
$72.5K–$94.5K
~$84.5K avg
4-month delivery
4-Plant Rollout (with Enterprise AI)
~$420K–$520K
Total
+ DGX Station GB300 Ultra
$84.5K
Avg per plant
4 mo
Delivery
$0
Recurring
∞
Perpetual
Perpetual · Owned · Source Access · Data Sovereignty
Stop Interpreting Spectra by Hand — Run Deviation Scoring, Owned
Multi-modal autoencoder scoring across vibration, thermal, visual, acoustic. Scene-aware thresholds. Automatic CMMS work orders. Your team owns the platform, the AI models, and the source code outright.
Why a 0–10 score instead of raw reconstruction error?
Raw error is unitless and asset-specific — what's "good" for a vibration spectrum on a 1,800 RPM motor is mathematically different from what's "good" for a thermal image. Normalizing to 0–10 based on the 99.95th and 99.99th percentiles of healthy training data puts every asset on the same scale and ties numeric ranges directly to action thresholds. A score of 7.4 means the same thing on a pump as on a transformer: amber zone, investigate within 7–30 days. That consistency lets reliability programs scale from 50 assets to 5,000 without retraining the workforce on per-asset interpretation rules.
How long do I need to collect healthy data before scoring works?
For most rotating equipment, 30 days of confirmed-healthy operation gives a workable baseline; 60–90 days produces a robust one. The minimum captures dominant operating regimes — startup transients, normal load, partial load, idle. Longer captures help when assets have seasonal variation or weekly maintenance cycles. OxMaint starts in "learning mode" during the baseline period — displays scores but doesn't trigger work orders. After go-live, the model continues self-refining: every confirmed green-zone hour adds to the training set. Most plants see false positive rates drop from ~10% in month one to under 3% by month six.
What if my equipment has never been "healthy" — only ever degraded?
The legitimate edge case for autoencoder scoring. Three workarounds: (1) start scoring after a planned overhaul, capturing post-overhaul state as the baseline; (2) cross-asset transfer learning, training on identical pumps in better condition elsewhere in the plant; or (3) synthetic baselines from physics-based digital twins, which OxMaint provides for common rotating equipment. Transfer learning is most common — if you have ten identical pumps, the three healthiest become the source baseline for the seven worse ones. This catches the genuinely-failing assets and prioritizes them above the merely-aged ones.
Doesn't this generate too many alarms?
Default thresholds (99.95% green/amber, 99.99% amber/red) are tuned to keep alarm volume manageable — a typical 200-asset plant sees 2–5 amber events per week and 0–2 red events. The bigger driver of false positives is the static-threshold problem covered above. Scene-aware threshold selection cuts false positive rates by 60–80% versus static cutoffs. Additional controls: temporal consistency (score must stay above threshold for N samples before triggering), trend-slope analysis (gradual drift fires earlier than sensor-glitch spikes), and operator feedback loops where dismissed alarms feed back into threshold tuning.
Can the score predict time-to-failure?
Yes, with caveats. The score itself is present-tense, but score trajectory over time is highly predictive of remaining useful life. OxMaint fits a regression model to each asset's score history and projects when the score will cross the red threshold. For assets in active degradation, this typically yields RUL estimates accurate to ±20–30% — enough precision for maintenance scheduling. Higher-fidelity ±5–10% RUL prediction requires physics-based digital twin models, available as an add-on for critical equipment. Most reliability programs use the score for the action decision and the RUL estimate as a planning hint.