SAP Predictive Maintenance for Power Plant Turbine Reliability
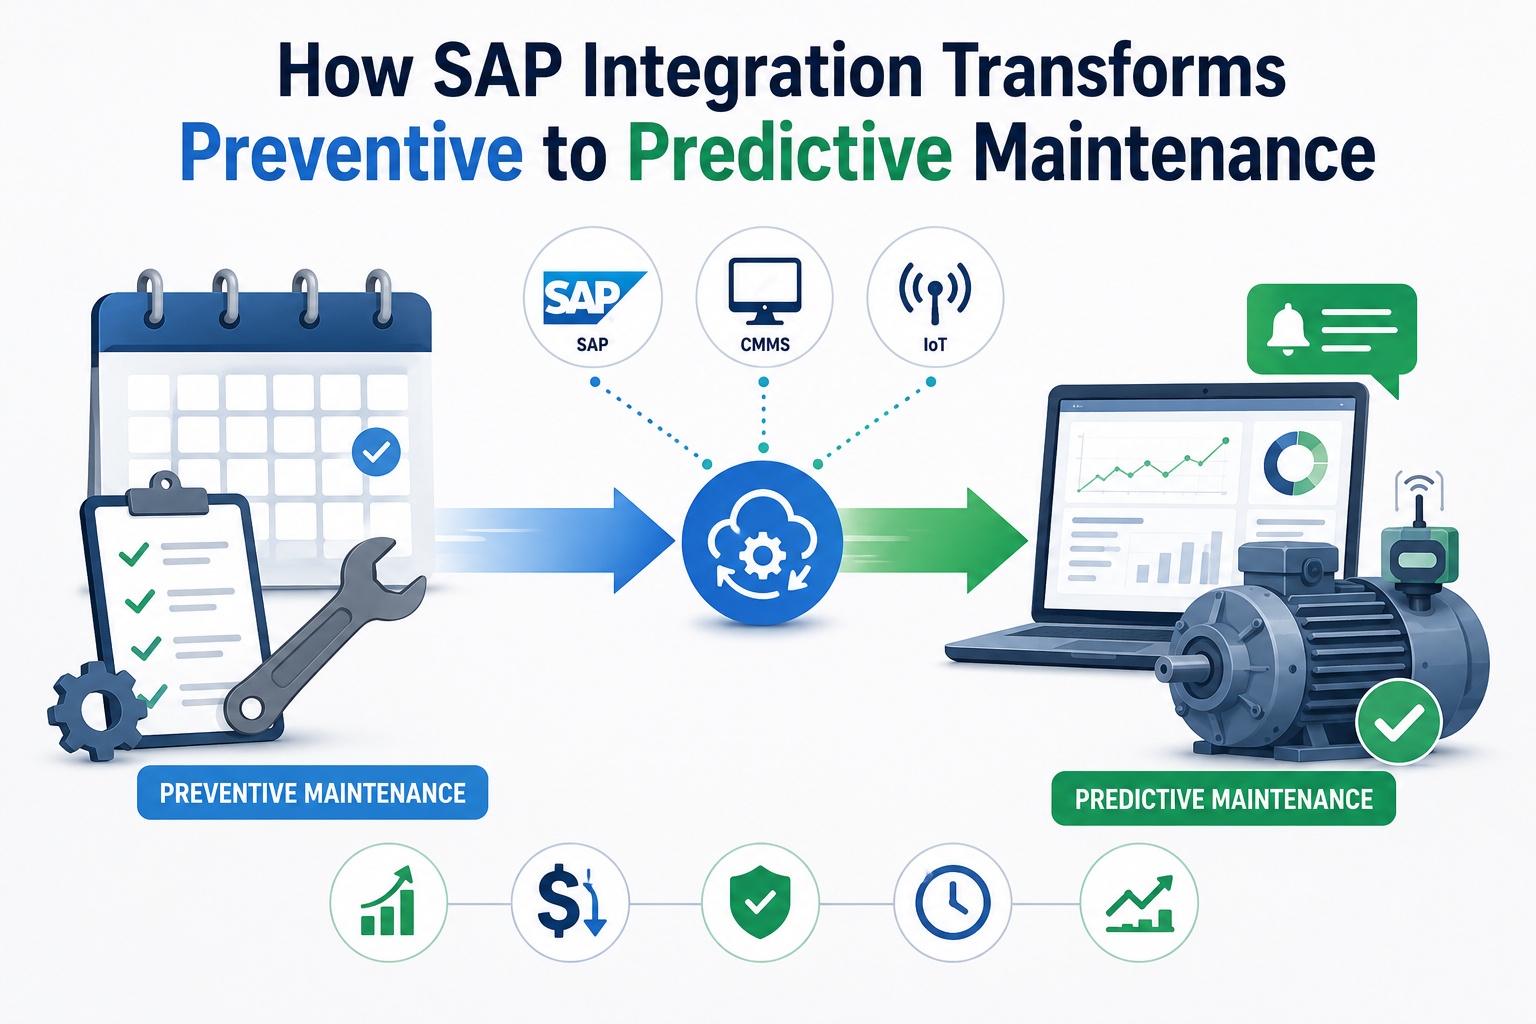
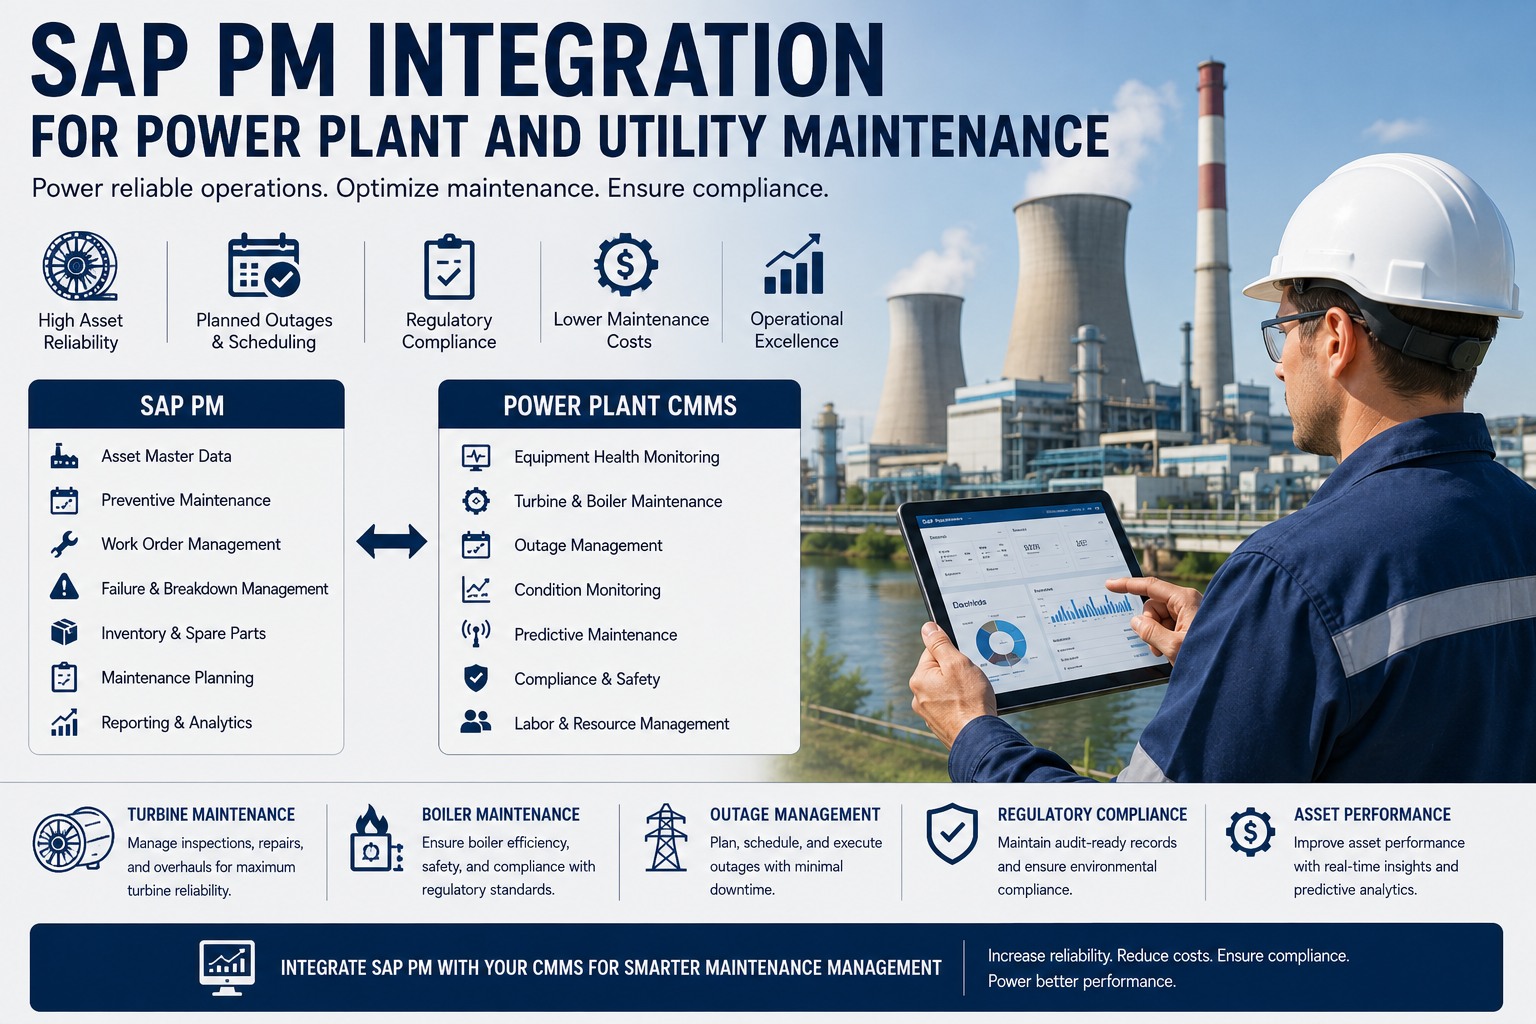
A single forced outage on a 500 MW gas turbine costs $500,000 to $2.5 million in lost generation, emergency parts premiums, and grid penalty cascades. The same failure detected four to twelve weeks earlier via vibration analysis costs a fraction—and the maintenance happens during a scheduled outage window instead of at 2 AM on a Saturday. Predictive maintenance turns that economic asymmetry into structural advantage for power plants connecting SAP PM, IoT sensors, and CMMS execution into one intelligence layer. Book a free demo to walk through turbine predictive operations.
Power Generation Predictive Maintenance, 2025-2026
The Economics Behind Continuous Turbine Monitoring
$7.08B
Projected predictive maintenance market in energy sector by 2030, growing at 25.77% CAGR
Source: Industry market research
$125K/hr
Average cost of unplanned downtime in power generation
Source: Energy sector benchmarks
35-50%
Unplanned downtime reduction reported by predictive maintenance adopters
Source: PdM ROI studies
$12 : $1
Average return per dollar invested in vibration monitoring on rotating equipment
Source: Vibration monitoring benchmarks
The Economics of Turbine Reliability
Power plant turbines are the highest-value, highest-risk assets in generation. A single forced outage on a 500 MW combined-cycle gas turbine cascades through lost generation revenue, emergency parts at 40 percent premium pricing, replacement power purchases, grid penalty exposures, and the reputational cost of missing dispatch commitments. The 2025 industry data is unambiguous: average hourly downtime cost in energy lands at $125,000, single forced outage events range from $500,000 to $2.5 million, and the gas turbine MRO market has grown to over $15.6 billion as operators chase the savings predictive programs unlock.
The asymmetry between reactive and predictive is what makes the business case so strong. Reactive repairs cost three to eight times more than the identical repair performed proactively—the premium covers after-hours labor, expedited parts, and contractor emergency call-out fees. Plants spending $500K per year on maintenance typically carry $150-200K in emergency-driven overhead that predictive programs eliminate within 12-18 months. Operations and reliability leaders ready to model that recovery on their own fleet can Sign up free to map predictive opportunities across the asset base.
How Predictive Maintenance Detects Failures Weeks Before They Happen
Modern turbines generate thousands of data points per second—exhaust gas temperatures, vibration signatures, compressor pressure ratios, bearing conditions, fuel flow rates, blade tip clearances. Most plants already collect 70-80 percent of the sensor data needed for predictive analytics; the gap is the analytical intelligence connecting that data to maintenance decisions. Machine learning algorithms trained on thousands of failure patterns compare live sensor signatures against baseline operating conditions, detect statistically significant degradation trends, and translate them into remaining useful life estimates with documented accuracy now exceeding 97 percent in healthy-versus-faulty classification.
The detection horizons are operationally significant. Vibration-based degradation typically becomes detectable four to twelve weeks before functional failure. Hot path issues—combustor liner cracking, transition piece distortion, blade tip degradation—are detectable two to eight weeks ahead. Bearing wear shows in vibration spectra long before any audible sound or temperature anomaly. The earlier the detection, the more options the maintenance organization has: schedule the repair during the next planned outage, source parts at standard pricing, deploy in-house crews instead of emergency contractors.
The Turbine Health Map
The diagram below shows where predictive monitoring is deployed across a typical large combined-cycle gas turbine, from air intake through generator. Each zone has a specific sensor mix, monitors specific failure modes, and provides a specific detection horizon. The pattern—continuous coverage from compressor to generator, with overlap zones at the most critical transitions—reflects how production-grade turbine programs are actually instrumented.
Turbine Health Map · 6 Monitoring Zones
Continuous predictive coverage from air intake to generator output
60-70%Of gas turbine maintenance costs concentrate in Zone 3 (hot section)
85%+Of forced outages originate in Zones 2-5 (compressor through LP turbine)
4-12 wksTypical lead time on bearing wear detection through vibration analysis
The single most consequential zone is Z3—the combustor and hot section. Components there operate at 1,400°C and accumulate 60-70 percent of all turbine maintenance spend. The single most detection-rich zone is Z5—the low-pressure turbine and main bearings, where vibration analysis routinely produces four-to-twelve-week lead times on the bearing failures that cause the largest portion of forced outages. Power plant reliability teams ready to overlay this monitoring framework on their existing turbine fleet can Sign up free to map current sensor coverage to the six-zone framework.
From Sensor Anomaly to Scheduled Repair
Continuous monitoring without integrated workflow is just expensive data collection. The value materializes when an anomaly detected at the sensor level translates—automatically and quickly—into a SAP-posted work order with parts requisitioned, crew dispatched, and cost center assigned. The pipeline below shows how production-grade predictive programs close that loop.
From Vibration Anomaly to SAP-Posted Work Order
Continuous monitoring closing the loop to integrated maintenance execution
T+0
Sensor Anomaly Detected
HP turbine bearing vibration trends 0.4 mm/s above baseline. ML model classifies as early-stage bearing wear pattern. Anomaly logged with timestamped sensor data.
T+5 min
Failure Mode Classified
AI engine assigns specific failure mode (e.g., outer race wear), severity score, and remaining-useful-life estimate. Recommended action library matched.
T+10 min
SAP Notification Auto-Created
Notification posted in SAP PM with equipment master linkage, cost center, and failure code. Reliability engineer receives alert with sensor evidence attached.
T+1 hr
Work Order & Parts Reservation
Reliability engineer converts notification to work order. SAP MM checks bearing inventory, generates purchase requisition if needed. Scheduling slotted into next planned window.
T+ Outage
Planned Repair Executed
Bearing replaced during scheduled outage window. Technician completes on mobile CMMS. Time and parts auto-post to SAP. Vibration baseline re-established post-repair.
This closed-loop pattern—from sensor anomaly to scheduled repair without manual reconciliation between systems—is what separates ROI-positive predictive programs from expensive monitoring projects. The integration layer that connects vibration analytics to SAP notification and work order generation is where most predictive programs either succeed or stall.
See Closed-Loop Predictive Maintenance on a Live Turbine
Walk through real vibration data triggering automated SAP PM notifications, work orders, and parts reservations. 30-minute live demonstration on production-grade architecture.
ROI: What Predictive Programs Return at Plant Scale
The ROI case for turbine predictive maintenance is one of the strongest in industrial asset management. Documented operating data from utility deployments shows the size of the recovery. A 1,200 MW gas power plant predicted a high-pressure feedwater pump failure 11 days in advance using ML-based analytics—saving $4.3 million in avoided downtime and grid penalty exposure. Plants with continuous vibration monitoring routinely report forced outage frequency dropping by two-thirds within the first full year of operation. The numbers below reflect what disciplined programs consistently deliver.
Calendar-Based vs Predictive Turbine Maintenance: Annual Performance Delta
Swipe to compare
Reliability Metric
Calendar-Based
Predictive Program
Shift
Forced outage frequency
Baseline
−66%
2/3 reduction
Unplanned downtime hours
Baseline
−35 to −50%
Material
Maintenance cost
Baseline
−25 to −30%
Material
Emergency repair premium
$150-200K/yr
Eliminated by month 18
Material
Heat rate (efficiency)
Baseline
+1-2%
$680K/yr fuel
Equipment life extension
Baseline
+20-40%
CapEx defer
6-12 moTypical payback period for predictive maintenance investment
95%Of predictive maintenance adopters report positive ROI
The largest single ROI lever isn't operational savings—it's the capital expenditure deferral that comes from extending major rotating equipment life by 20-40 percent. For turbines and generators where unit replacement cost runs $2 million to $15 million, even a 12-month life extension defers capital that often dwarfs the annual operational savings. Power plant reliability and asset management leaders ready to walk through the financial model on their own fleet can Book a free demo to walk through plant-specific ROI modeling.
Expert Perspective: What Distinguishes Programs That Succeed
The plants that succeed with predictive maintenance share a property that often surprises operations teams: they treat sensor data as evidence, not as decoration. Every vibration spike gets traced to a specific failure mode. Every temperature trend gets matched against a known degradation pattern. Every anomaly produces either a documented action or a documented "monitor and observe" decision with calendar follow-up. The plants that struggle deploy sensors and dashboards, generate spectacular real-time visualizations, and then continue to schedule maintenance on the same calendar they used before. The technology isn't the differentiator. The discipline of converting data into either action or documented rationale—every single time—is what separates programs that deliver the documented 35-50 percent downtime reduction from programs that produce expensive monitoring and no operational change.
Match Sensors to Failure Modes
Deploy the sensor that detects the specific failure mode you care about. Vibration for bearings. Acoustic for combustion. Oil analysis for wear. Generic monitoring without failure-mode specificity produces dashboards, not decisions.
Close the Loop to SAP
Anomaly detection without automated SAP notification creation produces alert fatigue and missed action. The integration from analytics to PM work order is what converts predictive insight into maintenance execution.
Start With the 15-20% That Drive 70%
Turbines, generators, main transformers, and critical pumps drive 60-70 percent of forced outages. Start there. The ROI from focused deployment on the highest-impact assets funds the broader program.
90-Day Path to Predictive Operations
Power plants that successfully deploy predictive maintenance follow a consistent cadence: assess existing sensor coverage, integrate analytics with SAP PM, validate detection accuracy on historical failures, then scale across the asset base. The roadmap below is what disciplined programs execute.
90-Day Predictive Maintenance Deployment
From sensor inventory to fleet-wide predictive operations
Days 1–20
Sensor Audit & Integration
Inventory existing sensor coverage on critical turbines. Integrate SCADA, DCS, vibration platforms, and process historian via OPC-UA. Validate data quality and sampling rates.
Days 21–45
Baseline & Model Training
Establish vibration and thermal baselines per asset. Train AI models on historical operating data. Validate detection accuracy against known past failures.
Days 46–70
SAP Integration & Pilot
Connect anomaly detection to SAP PM notification and work order generation. Pilot on 2-3 critical turbines. Validate closed-loop workflow from sensor to scheduled repair.
Days 71–90
Fleet Rollout & Tuning
Expand to balance-of-fleet rotating equipment. Tune alarm thresholds to minimize false positives. Establish reliability KPIs for monthly review.
By day 90, the program is operational across critical rotating equipment, the SAP integration is producing notifications and work orders automatically, and the first wave of forced-outage avoidance evidence is documentable for executive reporting. Reliability and operations leaders ready to begin the sensor audit can Sign up free to start the sensor inventory phase this week.
Turn Existing Sensor Data Into Forced-Outage Prevention
Six zones monitored continuously. Anomalies translated to SAP work orders automatically. Forced outages caught weeks before they happen. See the full architecture running on a live combined-cycle plant.
What sensor types are essential for turbine predictive maintenance?
For most power plant turbine applications, triaxial ICP (Integrated Circuit Piezoelectric) accelerometers mounted directly on bearing housings deliver the best combination of frequency range and signal quality for vibration analysis. For high-temperature locations on steam turbines, high-temperature-rated accelerometers rated to 150°C+ are required. Beyond vibration, the essential additions are exhaust gas temperature sensors (for combustor health), pressure transducers at compressor stages, oil analysis sampling, and—for advanced programs—blade tip clearance probes and acoustic sensors at the combustor. Most plants already have 70-80 percent of these sensors deployed and connected to SCADA; the gap is typically the analytics layer rather than the sensor coverage.
How does predictive maintenance integrate with our existing SAP PM module?
Integration runs through standard SAP OData APIs. The predictive analytics layer generates anomaly events with equipment master linkage, severity scoring, and recommended actions. These flow into SAP PM as notifications (typically using standard notification types) with sensor evidence attached as documents. From the notification, the reliability engineer converts to a work order, which triggers SAP MM for parts reservation and SAP FI/CO for cost settlement. The integration is bidirectional—work order completion status, parts consumption, and post-repair vibration baselines flow back to the analytics layer to update the asset's baseline model.
What's the typical implementation timeline for a power plant?
Focused implementations on critical turbines and rotating equipment typically run 60-90 days from kickoff to operational predictive monitoring. Sensor inventory and integration completes by day 20. Baseline establishment and model training runs through day 45. SAP integration and pilot deployment on 2-3 critical assets is operational by day 70. Fleet-wide rollout to balance-of-plant rotating equipment lands by day 90. Larger plants with more complex asset bases may extend total deployment to 120-180 days, but the pilot critical assets are typically generating verifiable predictions within the standard 90-day window.
How do we measure predictive maintenance success?
The headline metrics are forced outage frequency (target: 60-70 percent reduction), unplanned downtime hours (target: 35-50 percent reduction), maintenance cost as a percentage of operating budget (target: 25-30 percent reduction), and emergency repair premium spending (target: eliminated by month 18). Secondary metrics include detection accuracy (true positives versus false alarms), advance warning time (days between detection and would-have-been-failure), and heat rate trending (1-2 percent improvement signals successful compressor and hot section management). The strongest reporting metric is documented prevented-outage events—each one with its avoided cost calculation captured as evidence for executive review.
Does this work for steam turbines and hydro units, or only gas turbines?
The framework applies across all turbine types with sensor configurations adjusted for the specific asset. Steam turbines require high-temperature vibration sensors and benefit from added monitoring on the condenser and feedwater systems. Hydro units need attention to thrust bearings, generator stator monitoring, and water-side cavitation detection. The six-zone monitoring concept translates directly: intake/inlet, primary motion source (compressor for gas, throttle for steam, gates for hydro), energy conversion zone, transition zones, secondary motion source, and generator. The detection lead times are comparable: vibration anomalies routinely surface 4-12 weeks before functional failure across all turbine classes.