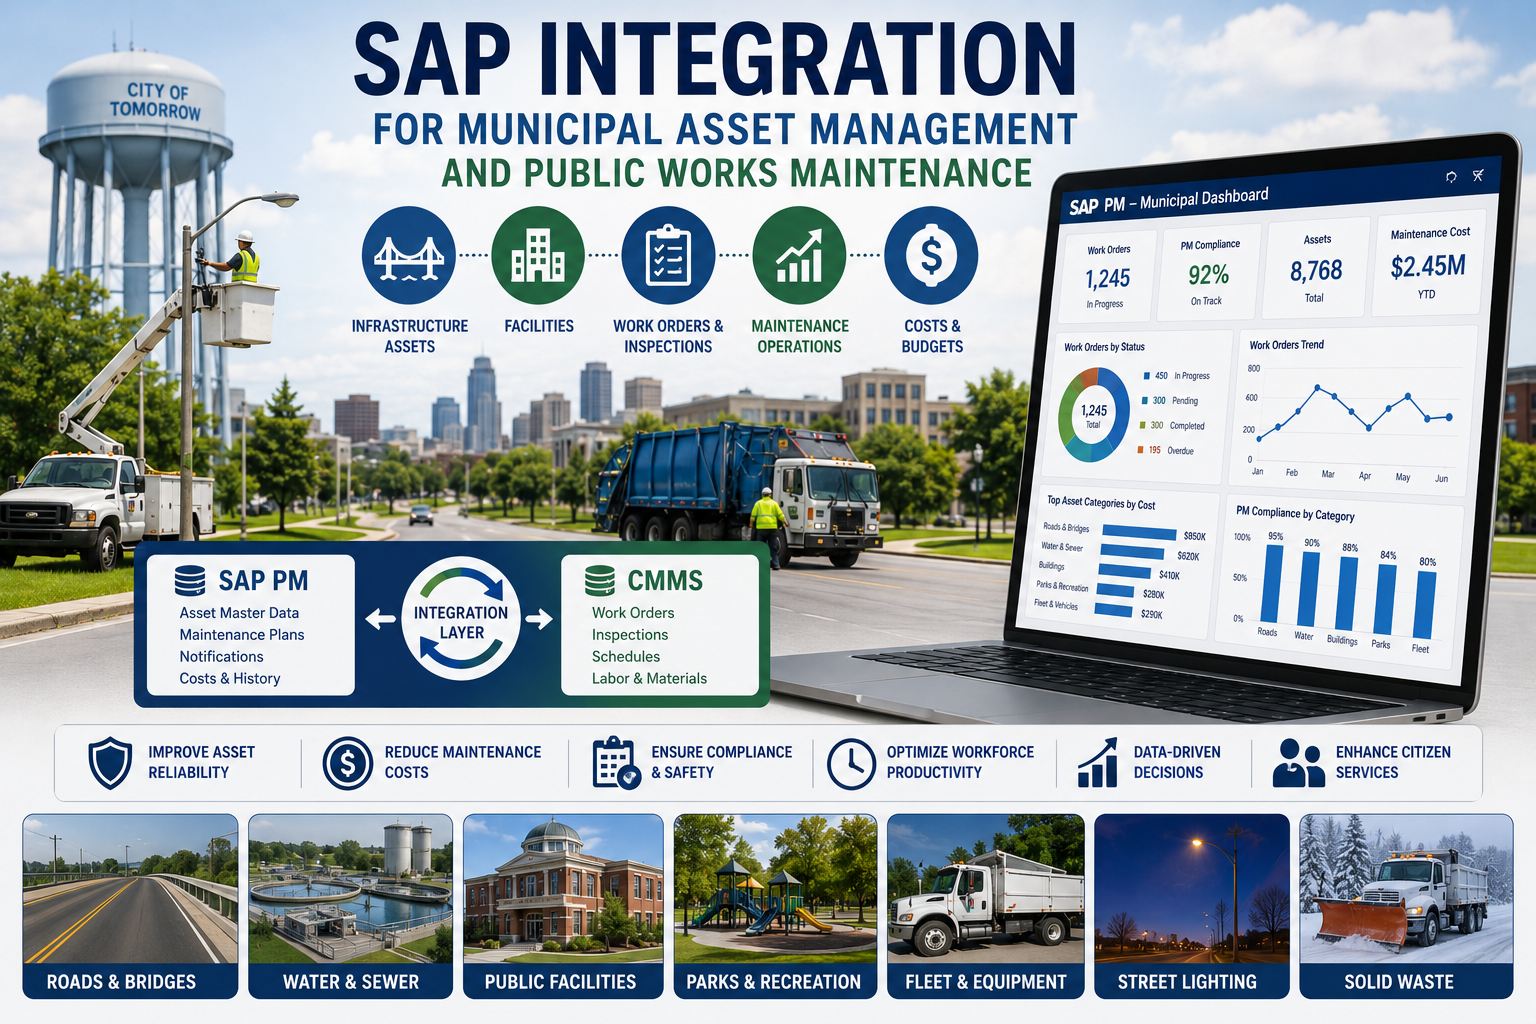
Every American city manages an asset portfolio worth billions—roads, bridges, water mains, fire stations, parks, fleet—on a budget that ASCE's 2025 Infrastructure Report Card identifies as a $3.7 trillion shortfall away from a state of good repair. Public works departments must do more with less, document every dollar for council, comply with GASB 34 and EPA mandates, and respond to citizen 311 requests within hours. SAP PM gives municipalities the financial backbone; what they lack is the field execution layer. Book a free demo to walk through municipal SAP PM integration.
C
Overall U.S. infrastructure grade, 2025 (up from C- in 2021)
Source: ASCE 2025 Report Card
$3.7T
Infrastructure funding gap over the next decade to reach good repair
Source: ASCE
$1 → $4
Every dollar in preventive maintenance saves four in failure response
Source: ASCE
90%
Of U.S. public construction costs borne by state and local governments
Source: U.S. Census
Why Municipal Maintenance Operates Under Unique Constraints
Municipal maintenance is the only environment in heavy industry where every work order is potentially public record, every deferred task is visible from the sidewalk, and every cost overrun lands in front of an elected council. SAP PM was designed for industrial plants that operate behind fences. Public works departments operate in plain view, with citizens, journalists, and bond rating agencies watching the numbers. A pothole left unfilled becomes a 311 complaint, then a council inquiry, then a local news story. A water main break becomes a boil-water notice, then an EPA violation, then a federal grant ineligibility risk.
The structural problem isn't SAP PM's accounting—it's that nothing in standard SAP PM was built to manage citizen 311 portals, GIS-mapped infrastructure inspections, federal grant evidence trails, or the kind of public transparency that municipal CFOs now require. Successful cities pair SAP PM with a purpose-built CMMS layer that handles the field-facing realities: mobile inspections, GIS asset mapping, citizen status portals, GASB 34 condition data, and FEMA-ready documentation. Public works departments ready to model this layered approach can Sign up free to map municipal assets to SAP PM in days, not months.
The Municipal Asset Portfolio in One View
The visualization below shows how a typical mid-size U.S. city's $2.4 billion asset portfolio breaks down by category. Block size approximates relative asset value; the condition grade reflects ASCE methodology adapted to municipal scale. This is the universe a single SAP PM equipment master needs to govern—and the universe a CMMS layer needs to make navigable for crews in the field.
Roads, Bridges & Signals
Pavement · Bridges · Traffic signals · Signs · Sidewalks · Streetlights
Pipes, Treatment & Lift Stations
Water mains · Sewer lines · Lift stations · Treatment plants · Hydrants · Manholes
Civic Facilities
City hall · Libraries · Fire stations · Police · Courthouse · Community centers
Recreational Assets
Playgrounds · Athletic fields · Pools · Trails · Pavilions
Vehicles & Equipment
Plows · Sweepers · Refuse trucks · Fire apparatus · Ambulances
Drainage Network
Storm drains · Catch basins · Retention ponds · Culverts
Public Utilities & ROW
Streetlight network · Traffic control · Public Wi-Fi · Conduit
ASCE Condition Grade Methodology
B
Good — adequate for current and future demand
C
Mediocre — requires attention
D
Poor — significant deficiencies, at risk
The treemap reveals what most council presentations bury: transportation and water-wastewater together account for over 60 percent of municipal asset value, and both sit at C or D grades. These are the categories where deferred maintenance compounds fastest, and where SAP PM integration with a field-execution CMMS delivers the highest ROI. Every dollar deferred in pavement preservation today becomes four dollars of pavement replacement in five years—a multiplier that maps directly to GASB 34 condition reporting and council capital planning.
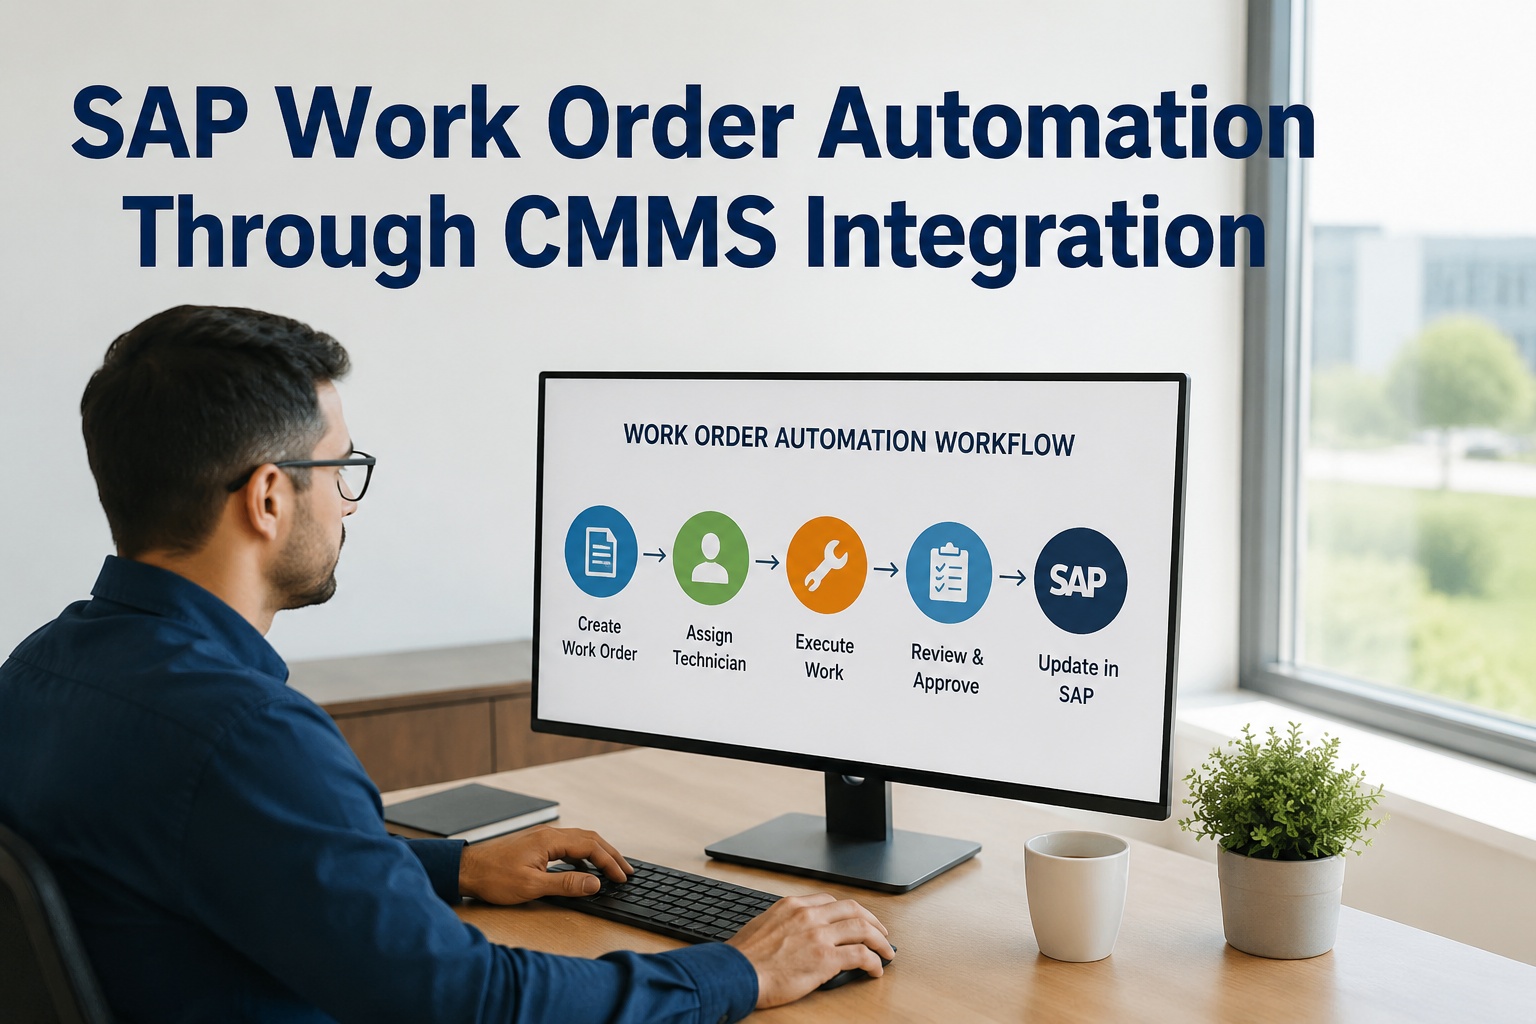
From Citizen 311 Request to SAP-Closed Work Order
Municipal maintenance has one structural element no industrial facility shares: the citizen as a primary work order initiator. A reported pothole, a broken streetlight, a leaking hydrant—all enter the system through 311 portals, mobile apps, or phone calls. The integration challenge is making that citizen input flow cleanly through to a SAP-posted, audit-ready closure. Here's what that workflow looks like when it's working.
T+0
Citizen Reports Issue
Pothole reported via 311 mobile app with GPS coordinates and photos. Confirmation receipt issued automatically with tracking number.
T+10m
Auto-Triage & SAP Sync
Request matched against asset GIS layer. Severity scored. Work order auto-created in CMMS with SAP PM functional location linkage and cost center.
T+30m
Crew Dispatch
Work order routed to nearest available crew by skill match and geography. Mobile alert sent with full asset history, materials list, and GIS map pin.
T+2h
Field Execution
Crew arrives on site, completes repair. Before/after photos, materials consumed, and labor hours captured on mobile. GPS confirms work location.
T+2.5h
SAP Posting & Citizen Notification
Labor and materials post to SAP cost center. GASB 34 asset record updated. Citizen receives automatic resolution notification with completion photo.
The traditional version of that same citizen request—phone call, paper ticket, supervisor assignment, end-of-week data entry—takes between five days and three weeks to close, with citizens calling back twice before resolution. Cities running integrated workflows close the same request in hours, with a complete audit trail that satisfies council inquiries, FOIA requests, and the federal grant documentation needed for FEMA, EPA, and DOT funding programs.
GASB 34 & Federal Grant-Ready Documentation
The financial accountability load on municipal maintenance is unlike anything in the private sector. Three overlapping documentation requirements—GASB infrastructure reporting, federal grant evidence, and EPA/DOT regulatory compliance—each demand timestamped, asset-linked maintenance records that no spreadsheet can produce reliably.
GASB
34 / 87 / 96 — Asset Reporting
Infrastructure capitalization, modified-approach condition reporting, lease and subscription accounting for the CAFR (Comprehensive Annual Financial Report).
Evidence required
Asset condition data · Depreciation schedules · Maintenance cost history · Capital additions
EPA
CMOM, NPDES & Stormwater
Capacity, Management, Operations, Maintenance for sanitary sewers; NPDES wastewater discharge; MS4 stormwater permits; lead service line replacement.
Evidence required
Inspection logs · Repair records · Overflow incident docs · Discharge monitoring
DOT
FHWA Bridges & FEMA Grants
Federal bridge inspection program (NBIS), pavement condition reporting, federal disaster grant pre-event maintenance evidence for FEMA reimbursement.
Evidence required
Biennial bridge inspections · Pavement condition indices · Pre-disaster maintenance trail
The single most consequential of these for municipal cash flow is FEMA grant eligibility. Federal disaster reimbursement requires documented pre-event maintenance of the affected asset; without it, the reimbursement gets denied and the city absorbs the full repair cost. Cities running integrated SAP PM and CMMS have this evidence automatically; cities running on spreadsheets and paper logs scramble for weeks and frequently lose the appeal. Public works directors ready to put grant-ready evidence on autopilot can Sign up free to begin auto-archiving GASB 34 and FEMA documentation.
See Municipal SAP PM Integration Running on Your Asset Portfolio
Walk through a live demo covering 311 service requests, GIS-mapped inspections, GASB 34 reporting, and SAP-integrated cost posting—on your own asset categories. 30 minutes, no commitment.
ROI: What Integration Returns at Municipal Scale
The financial case for SAP PM integration in municipal operations rests on three compounding factors: avoided emergency repairs (every $1 of preventive saves $4 of failure response), reclaimed federal grant dollars, and dramatic reductions in audit and reporting overhead. The numbers below come from operating data at U.S. cities with populations between 50,000 and 500,000.
Swipe to compare
$4
Saved per $1 of preventive maintenance (ASCE)
60–90 days
Typical implementation timeline including data import
The biggest single ROI lever isn't the labor savings—it's the recovered federal grant funding. A single denied FEMA reimbursement on a $4 million wastewater repair can erase a decade of CMMS investment. The cities running integrated systems don't lose those appeals because the pre-event maintenance documentation is intact and exportable in minutes. Public works directors ready to model the financial case for their city can Book a free demo to walk through projected savings on their asset portfolio.
Expert Perspective: Where Municipal CMMS Programs Succeed
The cities that get this right treat the citizen as the most important user of the maintenance system. When a 311 request flows into the same work order pipeline that produces GASB 34 reports and FEMA grant evidence, the politics of public works gets easier. Council members stop asking why their constituents are calling about potholes. Auditors stop demanding paper trails. The same data that closes a citizen complaint feeds the bond rating presentation. That alignment between operations and accountability is what distinguishes successful municipal CMMS programs from those that get shelved within two years.
Build for the Citizen, Not the Council
The first user of a municipal CMMS isn't the public works director—it's the citizen reporting a pothole. Mobile-first 311 portals with automatic status updates change citizen satisfaction within one quarter.
GIS Is the Spine, Not an Add-On
Every municipal asset has a location. GIS layers must drive work order assignment, crew routing, and condition reporting from day one—not bolted on as a year-two enhancement.
Treat Grant Documentation as Output
Federal grants are the highest-leverage funding source. Every work order should produce evidence that satisfies FEMA, EPA, and DOT documentation requirements automatically.
90-Day Path to Integrated Municipal Asset Management
Municipal CMMS implementations succeed when they're scoped for visible wins in the first quarter. The roadmap below is what mid-size U.S. cities consistently execute when they move from spreadsheet tracking to SAP-integrated public works management.
Days 1–20
Asset Import & SAP Mapping
Import existing asset registers from spreadsheets, GIS, and SAP PM. Validate functional location hierarchy. Configure GASB 34 condition fields and cost center linkage.
Days 21–45
311 & Mobile Field Go-Live
Activate citizen 311 portal with auto-triage. Deploy mobile work orders to public works crews. Validate round-trip from citizen request to closed work order in SAP.
Days 46–70
Department-Wide Rollout
Expand from pilot department to all public works divisions: streets, water, parks, fleet, facilities. Activate preventive maintenance schedules across all categories.
Days 71–90
Reporting & Compliance
Enable GASB 34, FEMA, EPA, and DOT evidence packs. Launch council reporting dashboard. Schedule quarterly capital planning review using condition data.
By day 90, cities executing this roadmap typically see 311 resolution times drop by 80 percent, PM compliance climb from the low 30s to the high 80s, and federal grant approval rates move from the low 60s to over 90 percent. Public works leaders ready to begin the asset import phase can Sign up free to start importing municipal assets to SAP PM this week.
Turn Municipal Maintenance Into a Defensible Public Record
Every 311 request closed. Every PM documented. Every dollar audit-ready. See SAP PM integrated with municipal CMMS running on your city's actual asset portfolio in a live walkthrough.
Frequently Asked Questions
Does SAP PM handle the full breadth of municipal assets—roads, pipes, parks, fleet?
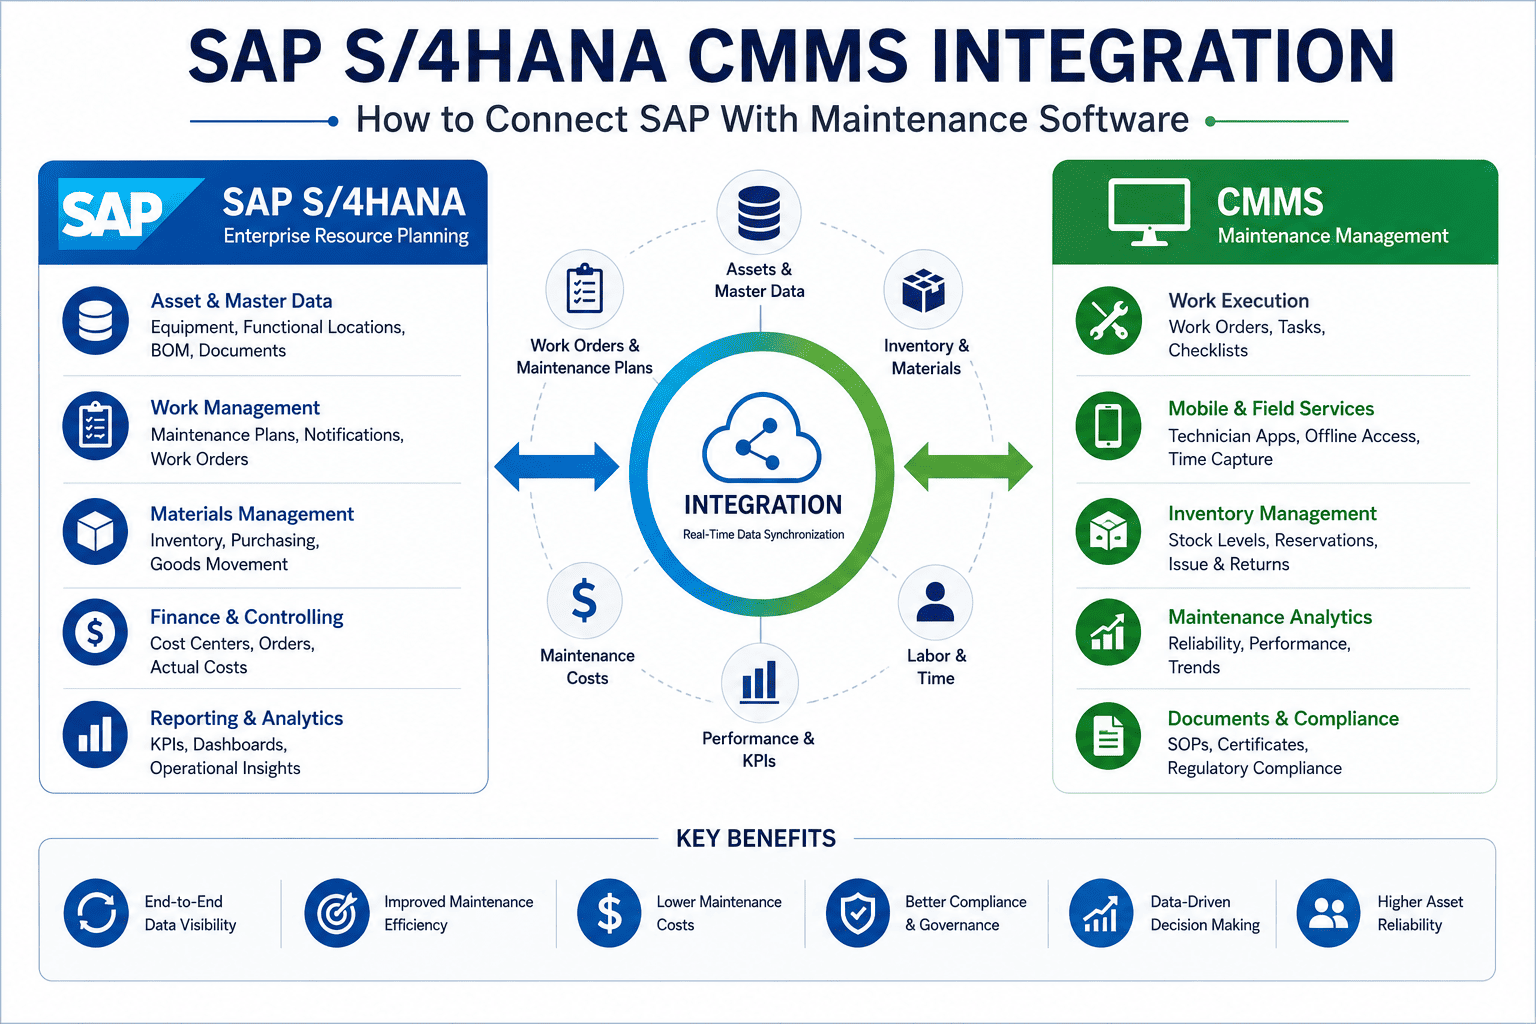
SAP PM provides excellent equipment master and financial governance for any asset category that has a functional location and cost center—which covers everything a municipality manages. What standard SAP PM doesn't include is the field-facing workflow for 311 requests, GIS-driven crew dispatch, mobile inspections, and GASB 34 condition reporting. These capabilities come from a CMMS layer that integrates with SAP PM via standard OData APIs while keeping SAP as the financial system of record.
How does GASB 34 compliance work in an integrated SAP-CMMS environment?
GASB 34 requires either depreciation-based accounting or the modified approach, which uses condition assessments to demonstrate that infrastructure is being preserved at or above an established condition level. The CMMS captures the condition data—pavement condition indices, bridge inspection results, pipe assessment scores—while SAP holds the financial structure. When the auditor arrives, the CAFR is generated from a combined data set that satisfies both the modified approach and traditional depreciation reporting requirements.
What's the impact on citizen satisfaction from integrating 311 with the work order system?
The largest measurable shift is in repeat-call rates. Cities running disconnected 311 portals see 40 percent or more of citizens calling back to ask status before resolution. Integrated systems push automatic status updates—request received, crew dispatched, repair complete with photo—that drop repeat calls below 8 percent. Citizen satisfaction surveys typically show 20 to 30 point improvements within the first six months of integrated operation.
How does the system support FEMA disaster recovery grant applications?
FEMA requires documented pre-event maintenance of affected assets for reimbursement approval. The CMMS automatically maintains this evidence as a byproduct of normal operations: every inspection, every PM task, every repair is timestamped and linked to the asset. When a disaster occurs, the grant application can export the complete pre-event maintenance trail for affected assets in a few clicks rather than the multi-week document scramble cities historically face. Approval rates typically jump from the low 60s to over 90 percent.
What's the typical implementation timeline for a mid-size U.S. city?
A focused phased implementation typically runs 60 to 90 days from kickoff to department-wide operation. The pilot department—usually streets or facilities—is live within four to five weeks. Remaining departments roll out in priority order through day 70. Compliance evidence automation (GASB 34, FEMA, EPA) is typically activated in the final 30 days. Cloud-based deployment eliminates the multi-year on-premise IT projects that historically delayed municipal CMMS adoption.