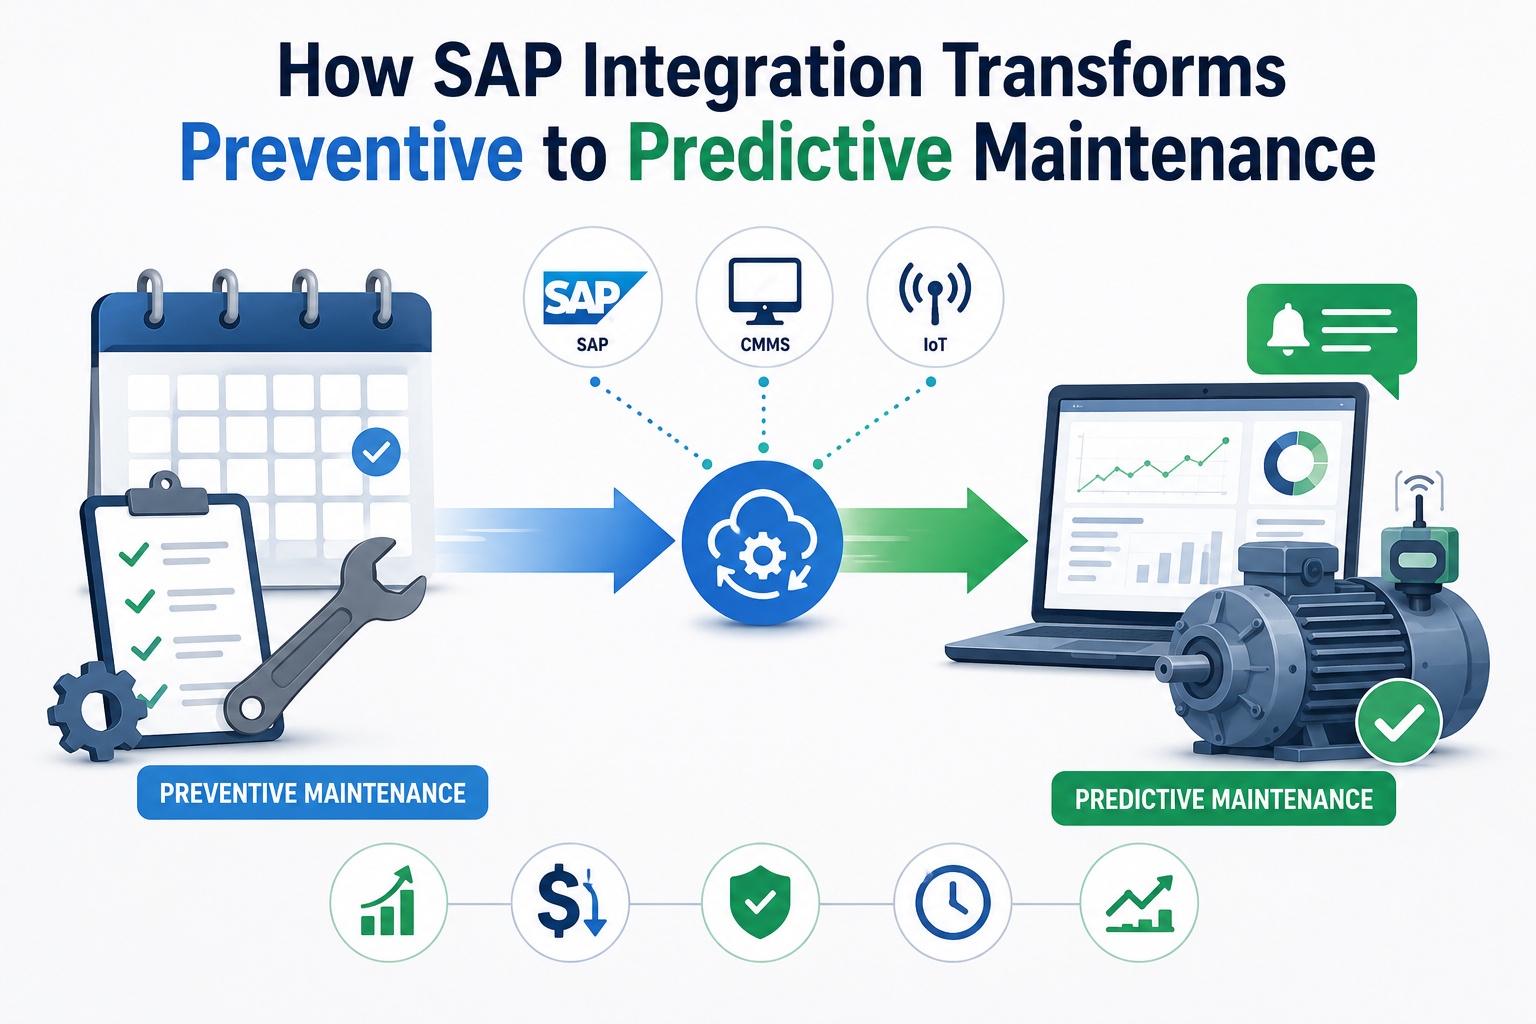
Preventive maintenance built on calendars and hour-meters dominated industrial maintenance for fifty years. It worked because the alternative was reactive failure. But "good enough" stopped being good enough when manufacturers started measuring what calendar-based PM actually costs: 30% of PM tasks performed too early, 20% performed too late, and downtime still consuming 5-10% of capacity. SAP-CMMS integration with real-time sensor data is what makes the move from preventive to predictive maintenance economically possible. This article maps the five-stage maturity evolution. Book a free demo to see predictive maintenance integration in action.
MAINTENANCE MATURITY REALITY
Five Stages Separate Reactive Maintenance From Predictive Excellence
30%
PM Tasks Done Too Early
20%
PM Tasks Done Too Late
70-85%
Downtime Reduction at Stage 4
Why "Preventive Maintenance Is Enough" Stopped Being True
For five decades, time-based preventive maintenance was the standard answer to "how should we maintain equipment?" Replace bearings at 5,000 hours. Change oil quarterly. Rebuild the pump every two years. The schedules came from manufacturer recommendations and field experience, and they reduced reactive failures dramatically compared to run-to-failure operations. The approach worked—until manufacturers began measuring what it actually cost.
Roughly 30% of calendar-based PM tasks happen too early (replacing components with significant remaining life); about 20% happen too late (after degradation has already caused secondary damage); and unplanned downtime still consumes 5-10% of total capacity in most facilities. The gap between "scheduled maintenance" and "actual equipment condition" creates massive waste in both directions. Maintenance leaders ready to assess their current maturity stage can Sign up free to assess your current maintenance maturity.
The 5-Stage Maintenance Maturity Evolution
The evolution below maps how maintenance practice has progressed from reactive run-to-failure through to AI-driven prescriptive optimization. Each stage represents a fundamental shift in what triggers maintenance action—from "equipment broke" to "equipment will probably break by Tuesday." SAP-CMMS integration is the architectural foundation that makes Stages 3-5 economically achievable.
5 STAGES · TRIGGER → DATA → SYSTEM → OUTCOME
Maintenance Maturity Evolution
LOW MATURITY
HIGH MATURITY
Reactive (Run-to-Failure)
TRIGGER: Equipment Fails
DATA REQUIRED
None proactive · failure reports captured after the fact
SYSTEM CAPABILITY
Basic work order system · paper logs · phone-based dispatch
OUTCOME
Highest unplanned cost · 70%+ downtime unexpected · secondary damage common
Preventive (Time-Based)
TRIGGER: Calendar / Hour-Meter
DATA REQUIRED
Equipment runtime · scheduled maintenance plans · OEM recommendations
SYSTEM CAPABILITY
CMMS with PM plans · SAP IP01/IP02 plans · scheduling via IP10
OUTCOME
Lower unplanned downtime · 30% over-maintenance waste · 20% under-maintenance gaps
Condition-Based (Signal-Triggered)
TRIGGER: Sensor Threshold Breach
DATA REQUIRED
Real-time sensor data · vibration · temperature · oil analysis · operating parameters
SYSTEM CAPABILITY
CMMS + IoT sensors + integration layer · automated work order triggers on alerts
OUTCOME
Maintenance when needed · 40-60% downtime reduction · waste cut significantly
Predictive (Failure Forecasting) ANCHOR · TARGET STATE
TRIGGER: ML Model Forecasts Failure
DATA REQUIRED
Sensor history · failure patterns · operating context · master data from SAP
SYSTEM CAPABILITY
SAP + CMMS + IoT + ML platform · failure models trained on equipment history
OUTCOME
Action before failure · 70-85% downtime reduction · maintenance economics optimized
Prescriptive (Automated Optimization)
TRIGGER: AI Optimizes Plan Automatically
DATA REQUIRED
All predictive inputs + cost data · parts availability · labor schedules · production plan
SYSTEM CAPABILITY
Full digital twin · embedded ML · automated workflows · decision optimization engine
OUTCOME
Optimal maintenance economics · 90%+ planned work · prescriptive recommendations
Most manufacturing operations sit between Stage 2 and Stage 3. The jump to Stage 4 (Predictive) requires integration architecture that wasn't economically feasible until SAP-CMMS-IoT integration matured over the past five years. Stage 5 (Prescriptive) is emerging now and will become the standard within ten years. Maintenance leaders ready to plan their progression can Sign up free to plan your stage-to-stage progression.
SEE IT IN PRACTICE
Watch Predictive Maintenance Architecture Live
30-minute demo showing the full predictive stack—SAP master data + CMMS workflow + IoT sensor streams + ML failure models—all connected and producing actionable forecasts.
The Data Architecture That Makes Predictive Possible
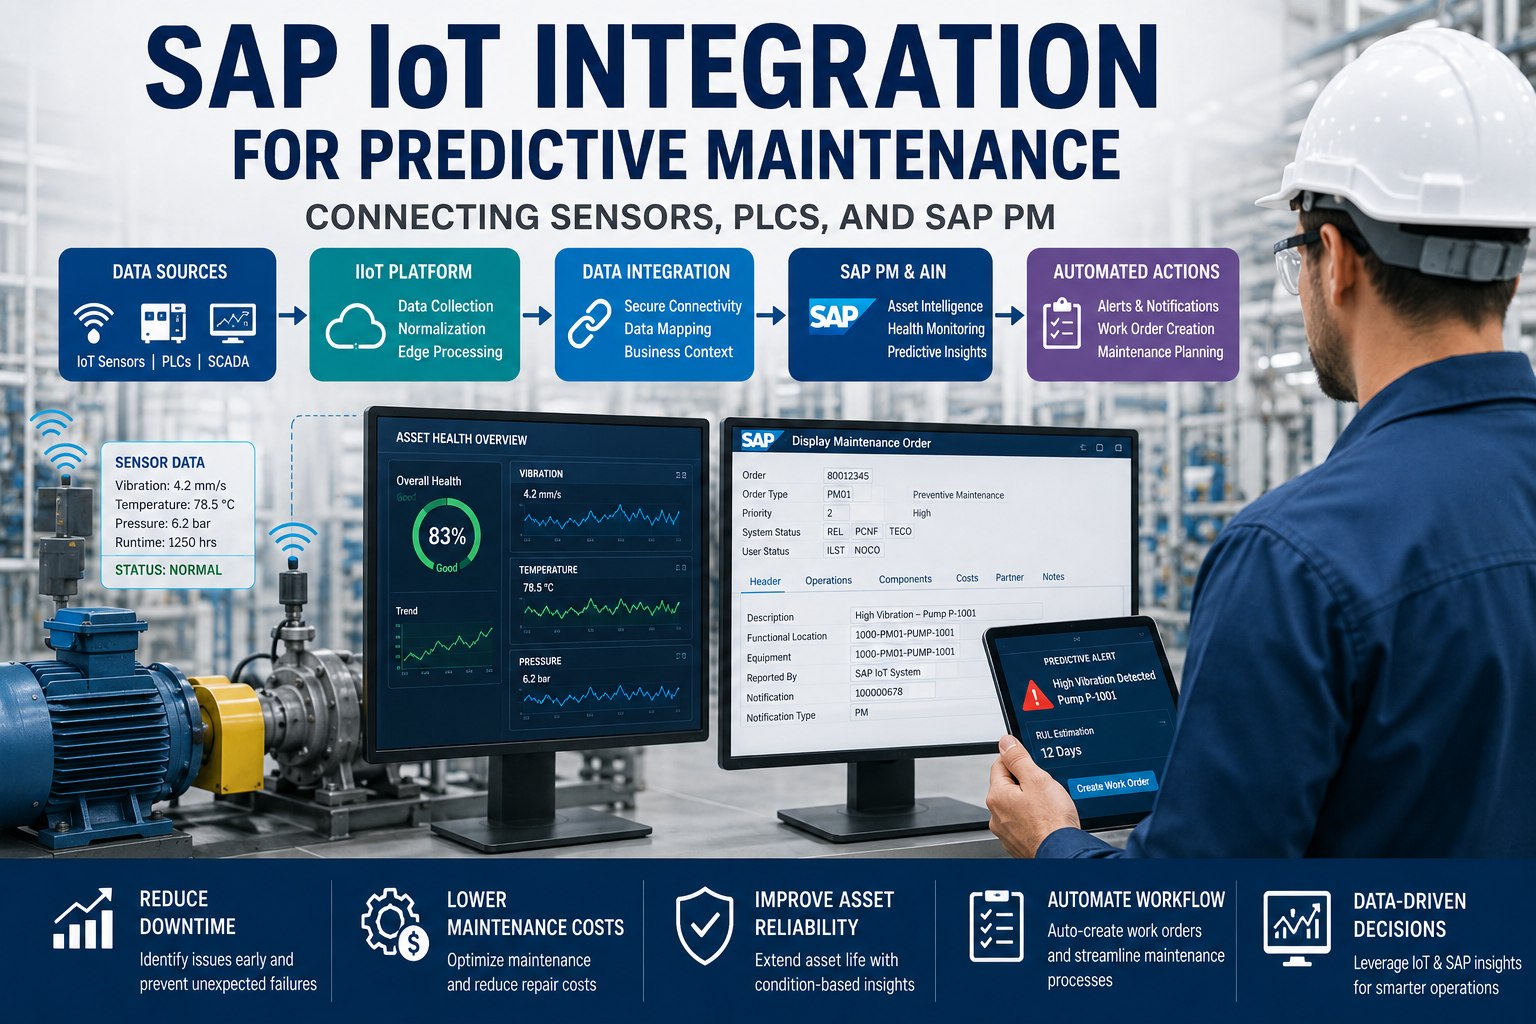
Stage 4 (Predictive) is not a software product—it's an architecture. Four data layers must connect for predictive maintenance to work economically. The layers are typically built in sequence; trying to add the ML layer before the foundation is in place reliably produces predictive systems that nobody trusts.
Layer 01 · Master Data
SAP PM
equipment + FLOCs
Clean equipment hierarchy, classifications, criticality—the foundation everything else builds on
Layer 02 · Work History
CMMS
failure + repair data
Years of work order history, failure modes, repair actions—what trains the ML models
Layer 03 · Sensor Telemetry
IoT
real-time signals
Continuous condition data—vibration, temperature, current, pressure, flow
Layer 04 · ML & Analytics
Models
failure forecasts
Pattern recognition, anomaly detection, remaining useful life estimates
The integration layer connecting these four data sources is what most organizations underestimate. Without disciplined integration, the ML layer receives inconsistent inputs and produces forecasts nobody acts on. Maintenance leaders ready to architect the data layers can Sign up free to architect your predictive data layers.
Common Failure Patterns That Predictive Maintenance Catches Early
The categories below cover the failure modes where predictive maintenance produces the largest gains over preventive. These are the patterns where calendar-based PM either misses problems entirely or catches them too late to prevent secondary damage.
Bearing Degradation
Vibration signatures shift weeks before audible failure. Preventive replacement misses early-life and late-life cases.
Motor Insulation Failure
Electrical signatures degrade gradually. Predictive catches insulation breakdown 30-90 days before motor failure.
Lubricant Contamination
Oil analysis trends reveal contamination weeks before damage. Calendar oil changes miss these cases entirely.
Performance Drift
Subtle efficiency loss across thousands of cycles. Predictive detects drift before measurable production impact.
ROI Comparison Across Maturity Stages
The performance delta between each stage compounds. Moving from Stage 2 to Stage 3 alone produces meaningful gains; moving from Stage 2 to Stage 4 produces transformational gains. The bars below show typical improvements at each progression step.
STAGE 2 (PREVENTIVE) vs STAGE 4 (PREDICTIVE)
Maturity Stage Performance Delta
Secondary Damage Events
−80%
Equipment Life Realization
+25 pts
Maintenance Budget Predictability
−80%
18-24 mo
Typical payback for Stage 2 → Stage 4 maturity progression
3-5x
5-year ROI multiple on integration architecture investment
The gains compound across dimensions. Reduced unplanned downtime feeds into higher equipment life realization; better PM targeting cuts secondary damage; budget predictability improves capital planning. Operations leaders ready to model their own stage progression can Book a free demo to model maturity stage progression.
Expert Perspective on Predictive Maintenance Adoption
"
The organizations that succeed at predictive maintenance share an unusual pattern: they invest in Stage 3 (Condition-Based) more deliberately than the path suggests they should. The textbook says Stage 3 is just a step toward Stage 4, but in practice Stage 3 is where teams learn what their sensor data actually means, which failure modes matter, and how their organization responds to data-driven alerts. Organizations that try to skip from Stage 2 directly to Stage 4 typically fail because they're trying to do machine learning before they've learned what the data is telling them. The disciplined path spends 12-18 months in Stage 3, builds operational fluency with sensor-driven maintenance, and then layers ML on top. The shortcut takes longer than the disciplined path.
01
Stage 3 Is Not a Stepping Stone
Stage 3 is where your organization learns what sensor data means and how to respond. Skip it and Stage 4 builds on weak foundations.
02
ML Without Domain Knowledge Fails
Machine learning needs domain experts who understand what good and bad equipment behavior looks like. Build that fluency in Stage 3.
03
Adoption Beats Algorithm Sophistication
A modest ML model that maintenance teams actually act on outperforms a sophisticated model that gets ignored. Adoption is the bottleneck.
90-Day Predictive Readiness Roadmap
The 90-day program below establishes the foundation that makes Stage 3 and Stage 4 progression possible. It runs before the ML investment, ensuring the data layers are ready to feed the models that come next.
90-DAY READINESS ROADMAP
From Current Stage to Predictive Foundation
DAYS 1–25
01
Current Stage Assessment
Audit existing maintenance practices. Identify current stage per equipment class. Map asset criticality to determine where Stage 4 produces highest value.
DAYS 26–50
02
Master Data & Integration Foundation
Clean SAP equipment master data. Establish CMMS-SAP integration. Validate work order and failure history quality for ML training.
DAYS 51–75
03
Sensor Pilot Deployment
Deploy sensors on 3-5 critical assets. Establish data pipelines. Begin Stage 3 condition-based monitoring. Train team on alert response.
DAYS 76–90
04
Stage 4 Readiness Validation
Verify data quality from pilot sensors. Identify ML use cases. Build business case for Stage 4 expansion. Plan 12-month progression.
EVOLVE YOUR PRACTICE
Move From Preventive Schedules to Predictive Intelligence
Five stages mapped. Data architecture defined. 90-day foundation roadmap. The disciplined path from calendar-based maintenance to ML-driven failure forecasting.
Frequently Asked Questions
What maturity stage is most manufacturing operations actually at today?
Industry surveys consistently show most manufacturing operations sit between Stage 2 (Preventive) and Stage 3 (Condition-Based), with the majority closer to Stage 2. Roughly 70% of organizations have established preventive maintenance programs but limited or fragmented sensor deployment. About 20% have meaningful Stage 3 capability on critical assets. Less than 10% have functioning Stage 4 (Predictive) programs at scale. The distribution skews lower for smaller operations and higher for capital-intensive industries (oil and gas, mining, power) where downtime costs justify earlier investment.
Do we need to deploy sensors on all equipment to do predictive maintenance?
No—and trying to do so reliably fails. The 80/20 rule applies: focus sensor deployment on the 20% of equipment that drives 80% of downtime cost or production risk. Critical assets, single-point-of-failure equipment, and equipment with long replacement lead times deserve sensor investment first. Lower-criticality equipment can stay at Stage 2 (Preventive) or move to Stage 3 (Condition-Based) using inspection rounds rather than continuous sensors. The economic answer is rarely "all equipment"—it's "the right equipment based on criticality and value at risk."
How long does it take to move from Stage 2 to Stage 4?
Realistic progression takes 18-36 months depending on starting maturity and scope. Months 1-6 typically focus on master data cleanup and integration foundation. Months 6-18 build Stage 3 capability with sensor deployment on critical assets and operational fluency with condition-based maintenance. Months 18-36 layer ML models on the established Stage 3 foundation, validate predictions, and expand scope. Organizations that compress this timeline reliably encounter data quality issues, adoption resistance, or model trust problems that erase the time saved. The progression rewards patience.
What's the difference between condition-based and predictive maintenance?
Condition-based maintenance (Stage 3) acts when a sensor reading crosses a predefined threshold—"vibration exceeded 0.5 inches per second, trigger inspection." Predictive maintenance (Stage 4) uses machine learning to forecast future failure based on patterns in sensor history—"this bearing will likely fail within 21 days based on the pattern of vibration progression we're seeing." Both use sensor data, but Stage 3 is reactive to current state while Stage 4 is anticipatory of future state. Stage 4 provides earlier warning and better planning lead time, but requires Stage 3 sensor infrastructure and historical data as its foundation.
Will predictive maintenance replace preventive maintenance entirely?
No. Even at mature Stage 4 operations, preventive maintenance remains the right approach for many tasks—lubrication, cleaning, safety inspections, regulatory compliance checks, and low-criticality assets where sensor investment isn't economically justified. The future is a portfolio approach: predictive maintenance for high-criticality assets with rich sensor data, condition-based for moderate-criticality assets with simpler sensors or inspection rounds, and preventive for low-criticality assets and compliance-driven tasks. The shift isn't replacing preventive; it's applying each approach where it produces the best economic outcome.