Top 10 Benefits of SAP–CMMS Integration for Plant Managers
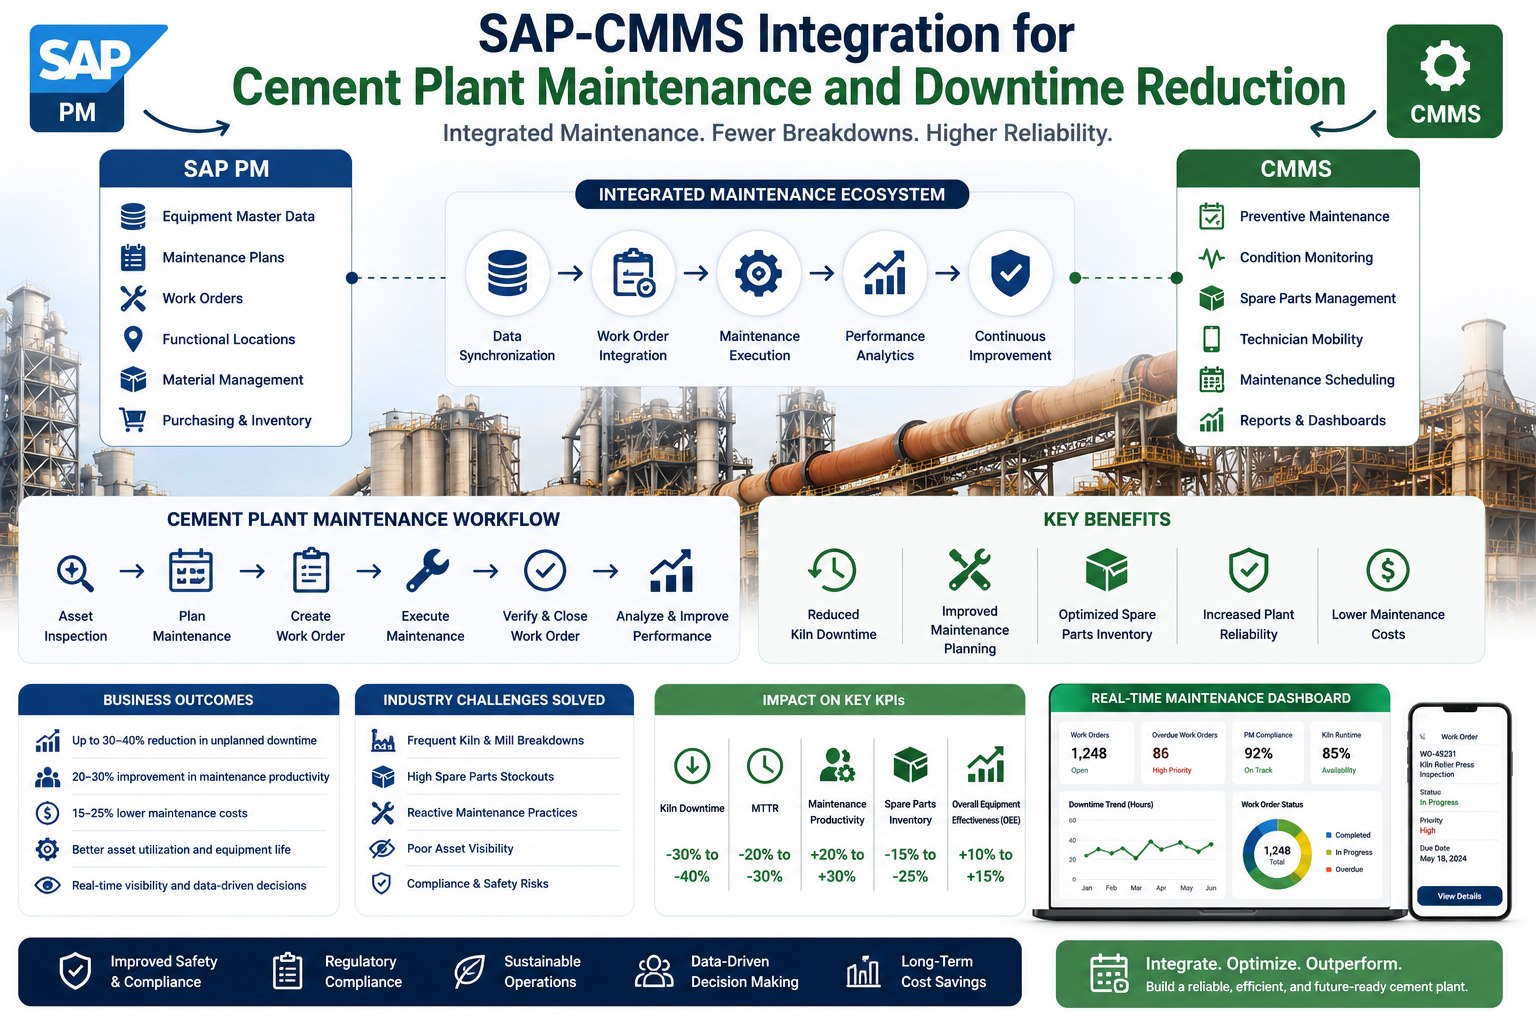
Plant managers don't buy integration software because the architecture is elegant—they buy it because the numbers move. SAP-CMMS integration is one of the few enterprise initiatives where the business case writes itself within the first year: unplanned downtime drops 30–50%, maintenance costs fall 15–25%, and budget forecasting variance compresses from ±30% to ±8%. Beyond the financial impact, operational and strategic benefits compound over time as integrated data drives predictive insight and cross-functional decisions. This guide walks through the ten measurable benefits, ranked by ROI velocity and total value, with the mechanism behind each.
PLANT MANAGER GUIDE
10 Measurable Benefits Plant Managers Actually See
Real numbers from real integrations—operational, financial, and strategic gains that compound from day one through year three.
30–50%Downtime cut
20%Cost reduction
12moTypical payback
Why Plant Managers Are Driving SAP-CMMS Integration Now
The economics shifted decisively in the last two years. Industrial automation made instrumentation affordable. SAP's API surface matured to the point where modern integrations actually work. AI analytics moved from theoretical to operational. The result is a window where the same investment that delivered marginal returns five years ago now delivers transformational ones. Plant managers who push this initiative are not chasing technology—they are responding to a measurable shift in what's possible. The ten benefits below are no longer aspirational; they are the standard outcome when the integration is executed properly.
The Three Benefit Categories
Every benefit falls into one of three categories based on how it shows up in plant operations. The categories matter for sequencing—operational benefits land fastest, financial benefits compound over months, and strategic benefits keep paying off year after year. Plant managers planning the rollout should expect to see them in roughly this order.
OPERATIONAL
Day-to-Day Improvements
4 benefits
Visible from week one. Downtime, work order efficiency, real-time visibility, and mobile execution—the gains plant managers feel immediately.
FINANCIAL
Bottom-Line Impact
3 benefits
Lower maintenance costs, optimized inventory, and tightened budget forecasting. These show up in CFO reports within 3–6 months of go-live.
STRATEGIC
Long-Term Advantages
3 benefits
Compliance posture, decision quality, and ROI compounding. These benefits keep delivering value year after year, growing in significance.
The split matters because plant managers communicating ROI to leadership need to know which numbers will land first and which take longer to fully realize. Plant teams scoping their own integration can sign up free to model the benefit timeline against their specific operational baseline.
The 10 Measurable Benefits
Each benefit below leads with the measurable metric—the headline number that lands in operational reports. The card then explains what that metric means for plant operations and the specific mechanism that produces it. The numbers come from industry benchmarks and real engagement data, not vendor marketing.
01
OPERATIONAL
30–50%
Unplanned Downtime Reduction
Critical assets stop failing without warning. Production schedules hold. The single largest dollar-value benefit for most plants.
AI analytics on integrated sensor and work order data predicts failures 14–60 days before they occur, converting unplanned events into scheduled work.
02
OPERATIONAL
Live
Real-Time Plant Visibility
Asset status, work order progress, parts on hand, and technician location—visible to leadership in sub-minute latency instead of yesterday's spreadsheet.
CMMS captures field events instantly via mobile devices and IoT sensors, then syncs bidirectionally with SAP. No more day-old data driving today's decisions.
03
OPERATIONAL
25–30%
Faster Mean Time to Repair
Technicians complete work orders faster because they arrive prepared—parts staged, history reviewed, instructions clear. Wrench-time goes up.
Mobile work orders pre-load asset history, parts requirements, and prior failure context. Technicians stop spending 30% of their day chasing information.
04
OPERATIONAL
95%+
Mobile Completion Rate
Work orders close in real time at the asset, with complete data—labor hours, parts consumed, root cause, photos. Paper backlogs disappear.
Purpose-built mobile interfaces designed for shop-floor conditions: gloves, glare, intermittent connectivity. Adoption follows usability.
05
FINANCIAL
15–25%
Total Maintenance Cost Reduction
Lower emergency repair premiums, less rework, fewer overtime hours. The cumulative cost impact shows up in maintenance cost-per-output metrics.
Predictive maintenance shifts work from emergency to planned. Planned work costs 3–5x less per hour than emergency response. The math compounds quickly.
06
FINANCIAL
15–25%
Spare Parts Inventory Reduction
Working capital tied up in parts inventory falls. Carrying costs drop. Long-tail obsolete spares get systematically retired.
Integrated SAP MM data plus AI consumption forecasts replace gut-feel stocking levels. Critical spares stay covered; bloat gets cut.
07
FINANCIAL
±8%
Budget Forecast Accuracy
Annual maintenance budgets land within 8% of plan instead of typical 30%+ variance. Finance starts trusting maintenance numbers.
SAP cost actuals plus AI-driven asset health forecasts replace spreadsheet projections. Monthly variance review catches drift before it compounds.
08
STRATEGIC
100%
Audit-Ready Compliance
Inspection records, calibration certificates, regulatory PMs all documented with full traceability. Audits move from week-long crises to half-day reviews.
Every work order, measurement, and maintenance action captured at the source with timestamp, technician, and asset context. SAP holds the financial layer; CMMS holds the evidence.
09
STRATEGIC
+20%
Decision Quality Lift
Cross-functional decisions—capital planning, vendor selection, organizational design—happen on real data instead of anecdote. Plant managers gain leadership credibility.
Unified asset performance data accessible to operations, maintenance, finance, and engineering in shared dashboards. One source of truth for the conversations that matter.
10
STRATEGIC
3–5x
Multi-Year ROI Compounding
First-year payback is just the beginning. Year-two and year-three returns multiply as more asset classes onboard and AI models accumulate training data.
Each new asset added to the integration extends the value of the existing investment. Fixed platform costs spread across more value-generating coverage.
The benefits compound. The 30% downtime reduction in year one becomes a 45% reduction by year three as more assets come under predictive coverage. Plant managers seeing this trajectory can book a free demo to model the multi-year benefit curve against their own plant's baseline metrics.
When Each Benefit Pays Off — The Value Timeline
Not every benefit lands on day one. Some are immediate (visibility, mobile UX). Some take a quarter to materialize (work order efficiency, compliance documentation). Others need months for the data and models to mature before paying off (predictive maintenance, budget forecast accuracy). The timeline below shows when each numbered benefit typically starts delivering measurable value.
Benefit Realization Timeline
Numbered dots reference the 10 benefits above
WEEK 1–4
Immediate
Visibility and mobile execution land as soon as the integration is live. Plant leadership sees the change in the first dashboard refresh.
02
04
MONTH 1–3
Quarter One
Work order efficiency improves as technicians adopt mobile workflows. Compliance documentation builds up. Early signs of cost shift visible.
03
08
MONTH 4–9
Mid-Term
AI models accumulate enough training data to deliver reliable predictions. Downtime drops, inventory optimization kicks in, cost reductions compound.
01
05
06
MONTH 12+
Long-Term
Budget forecast accuracy stabilizes. Strategic decision-making capability deepens. Multi-year ROI compounding becomes evident in year-over-year comparisons.
07
09
10
Half the benefits land within the first quarter. The high-value mid-term and long-term benefits build progressively from there.
The temporal pattern matters for setting executive expectations. Promising 30% downtime reduction in month one sets the project up to look like it's failing. Communicating that downtime reduction lands in months 4–9 keeps leadership patient through the period when models are training. Plant managers planning their integration narrative can sign up free to map their own benefit realization timeline against the specific scope they're considering.
Model These Benefits Against Your Plant's Numbers
A 30-minute working session walks through each of the ten benefits using your actual plant data—asset criticality, downtime cost, current maintenance budget—and produces a personalized benefit forecast you can take to leadership.
The ten benefits look impressive individually. They become compelling when summed for a representative plant. The calculation below uses realistic figures for a mid-sized industrial facility with a $12 million annual maintenance budget and roughly $4.2 million in unplanned downtime cost. Your numbers will differ; the structure transfers.
18% reduction × $2.4M parts inventory + carrying cost
$432,000
05
Emergency Repair Premium Reduction
Lower contractor rush rates & overtime
$310,000
08
Compliance & Audit Efficiency
Reduced audit prep, eliminated penalty exposure
$150,000
TOTAL ANNUAL VALUE
$3,298,000
~$650K
Typical first-year project cost
12 mo
Payback period
~5x
3-year cumulative return
The $3.3 million annual value is conservative for this plant size. Many facilities exceed it once predictive coverage extends across more asset classes and inventory optimization moves beyond critical spares. Plant managers ready to run the same math against their own numbers can book a free demo to walk through a personalized calculation with their actual maintenance budget and downtime cost data.
How to Validate These Numbers in Your Plant
Plant managers reading benefit projections should be skeptical—the gap between vendor claims and real outcomes is the source of every cynical operations director's hard-earned wariness. The four validation methods below help you stress-test the numbers against your own environment before committing budget.
A
Baseline Your Current Metrics for 30 Days
Pull MTTR, MTBF, unplanned downtime hours, and emergency repair costs from SAP and your current systems for the trailing 30 days. Without this baseline, you can't measure improvement—and you can't validate any future ROI claim.
B
Calculate Your Hourly Downtime Cost
Multiply your highest-impact asset's hourly throughput by margin per unit. Add labor cost during stoppage. Add cascading impact on downstream operations. The number that emerges—often $5K to $50K per hour—is the multiplier for every downtime reduction estimate.
C
Audit Your Reactive vs Planned Ratio
If reactive work is more than 35% of total maintenance time, predictive maintenance benefits will land closer to the high end of the range. If it's already below 25%, benefits are smaller. This single ratio tells you where you sit on the benefits curve.
D
Survey Technicians on Information Friction
Ask three questions: how much of your day do you spend looking for information, how often do you re-do work because of incomplete history, how many work orders close late because of missing parts. The honest answers are where your mobile and visibility benefits will materialize.
None of these validation methods take more than a week. Together they produce the credible baseline that converts integration projections from "the vendor said" to "our own numbers tell us." Plant managers wanting to run this validation before any commitment can sign up free to use the diagnostic worksheet built around the same four-method framework.
From Benefit Projection to Personalized Forecast
Generic ROI numbers are interesting. Numbers run against your specific plant—asset mix, downtime cost, current ratios—are actionable. A working session with our integration team produces both the calculation and the implementation roadmap that delivers it.
How quickly will I see ROI from SAP-CMMS integration?
Visibility and mobile execution benefits land within weeks of go-live. Quantifiable ROI on downtime and cost reduction typically materializes in months 4–9 as AI models accumulate training data and predictive maintenance starts catching failures. Most mid-sized industrial plants hit cumulative break-even on the project investment around month twelve, with the full annual run-rate of benefits visible by month eighteen. Year two onward, returns compound as coverage extends across more asset classes.
Which benefit produces the largest dollar value for most plants?
Unplanned downtime reduction is the largest single benefit for almost every industrial plant—often accounting for 40–60% of total annual value. The reason is mathematical: downtime cost per hour is typically multiples of labor or parts cost, and even modest percentage reductions compound to large dollar figures. Labor productivity gain comes second; parts inventory optimization third. Plants in highly capital-intensive industries (steel, cement, refining) tend to see the largest downtime dollar impact.
Do all of these benefits apply to every plant, or do some industries see different results?
All ten benefits apply broadly, but the magnitudes shift by industry. Heavy industry plants (steel, cement, chemicals) see outsized downtime reduction value because their hourly downtime cost is highest. Distribution and packaging operations see larger labor productivity gains. Regulated industries (pharma, nuclear, food) see compliance benefit weighted higher. The framework holds; the dollar split varies. The ten-benefit structure is designed to scale across industrial sectors.
How do I measure these benefits in my own environment after go-live?
Establish the baseline before integration starts—MTTR, MTBF, unplanned downtime hours, parts spend by category, audit prep time. Re-measure these quarterly post-launch. The integration platform itself provides much of the data through unified dashboards, but the discipline is making the measurement a regular leadership routine. Most plants formalize this as a quarterly business review of maintenance KPIs against the baseline.
What's the typical implementation cost versus annual benefit?
For a mid-sized industrial plant, first-year implementation costs typically run $400K–$900K depending on scope, sensor count, and SAP environment complexity. Annual benefits for that same plant typically run $2.5M–$5M once mature. Payback periods cluster around 12–18 months. Plants with higher downtime costs (heavy industry, continuous-process operations) see faster paybacks because the downtime reduction benefit alone often justifies the investment.