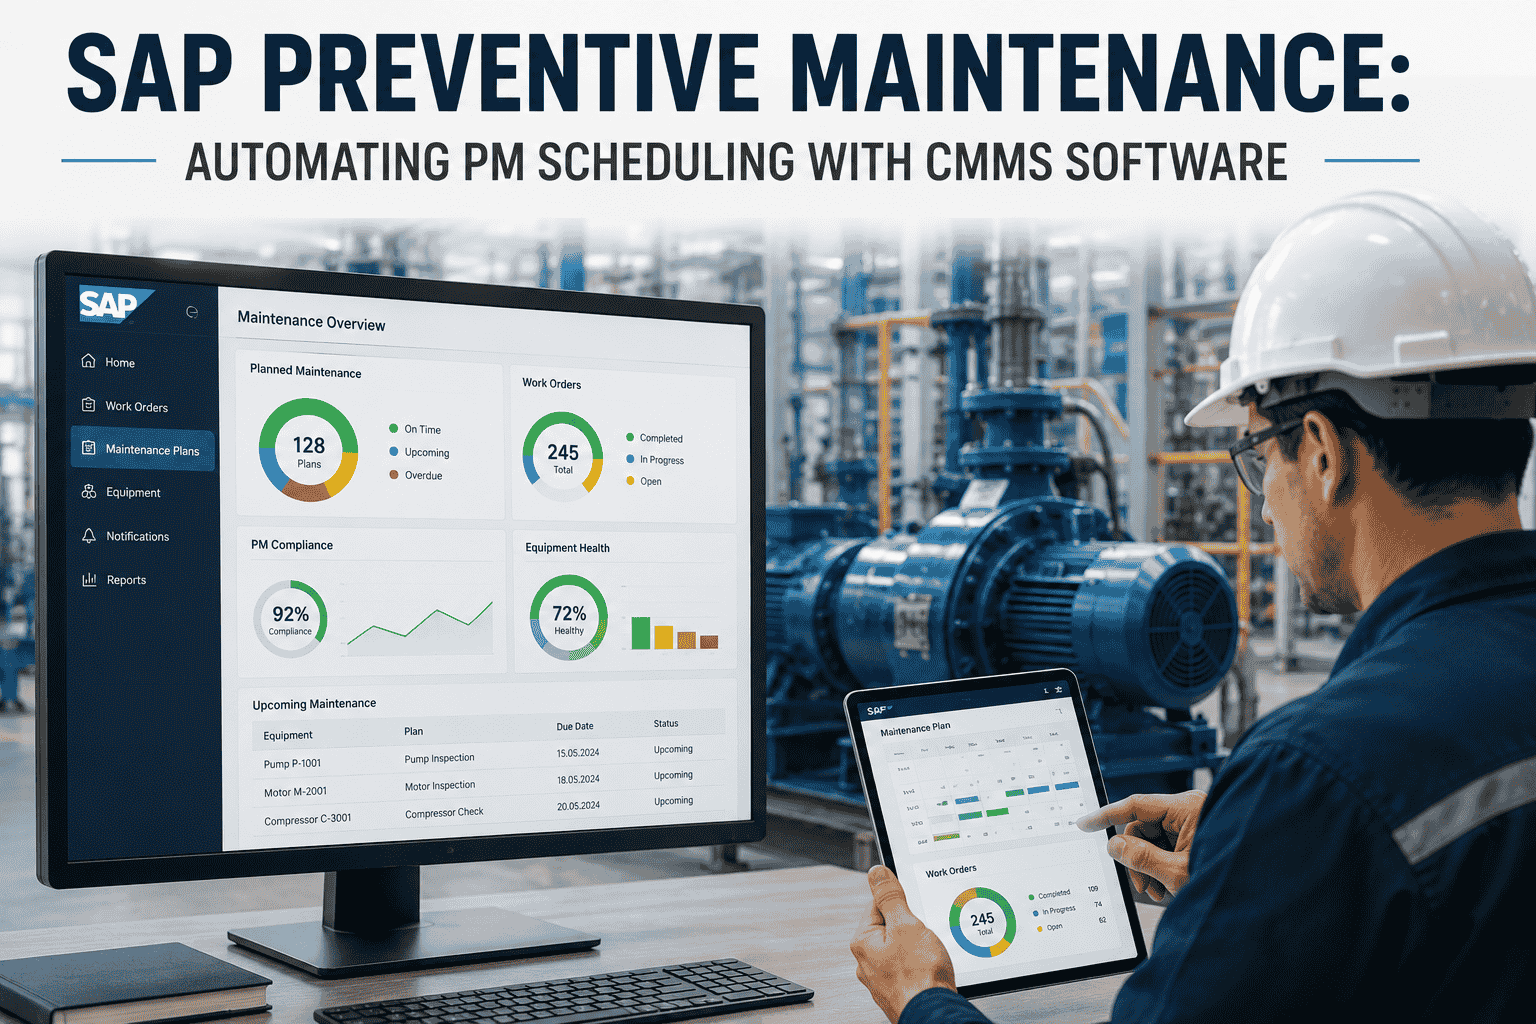
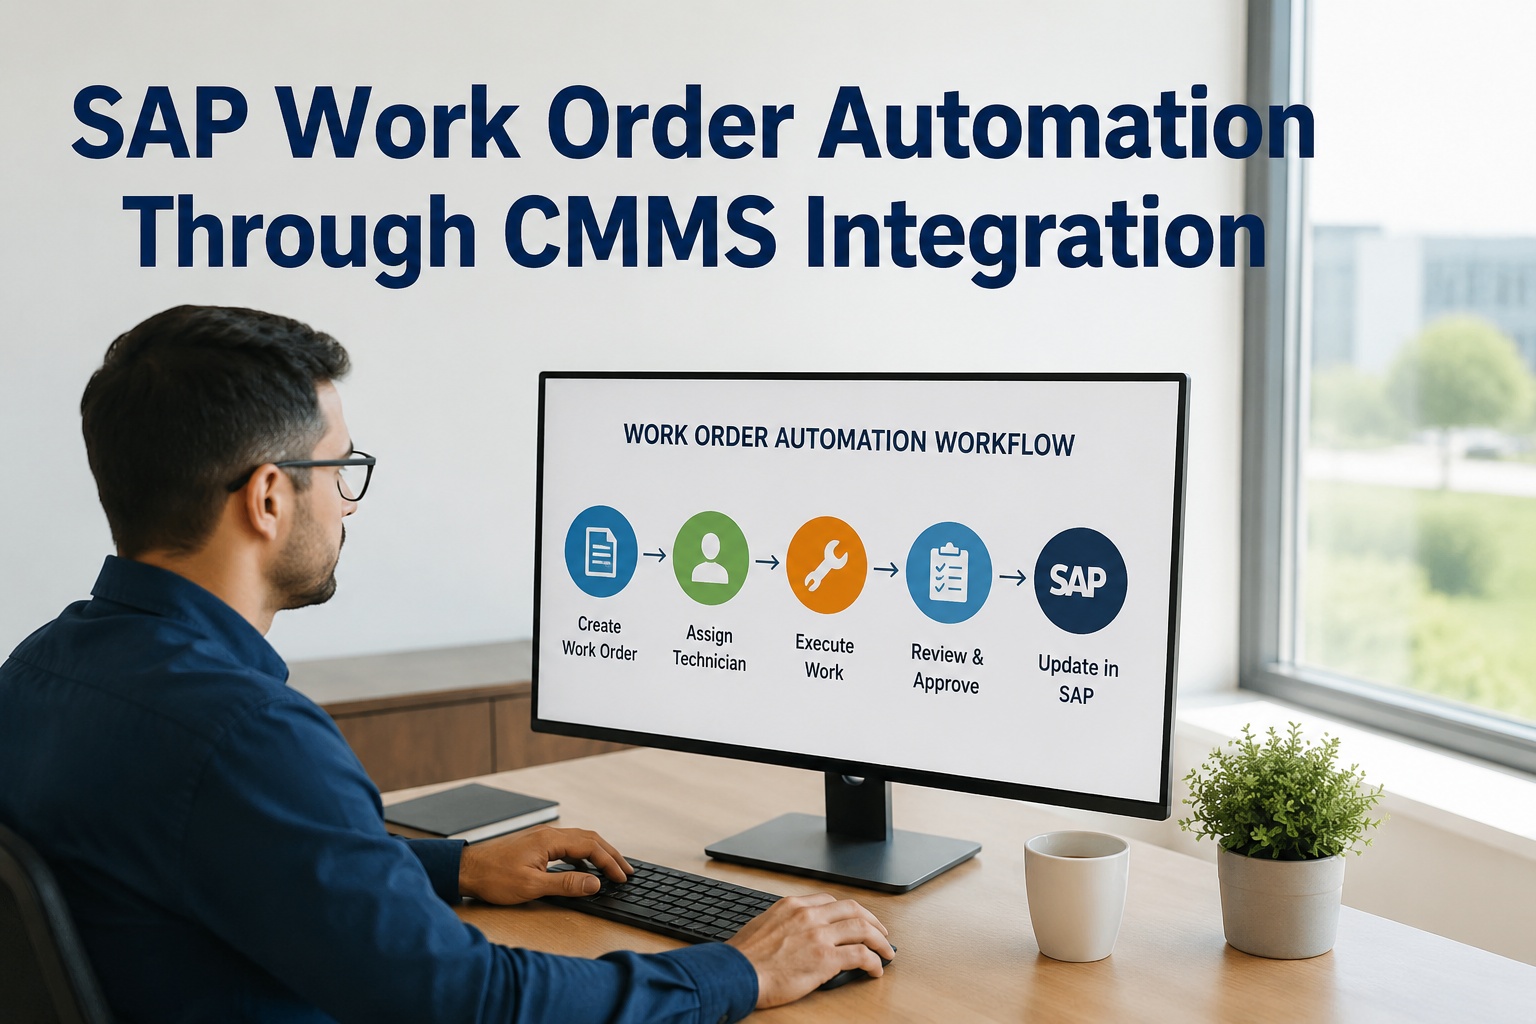
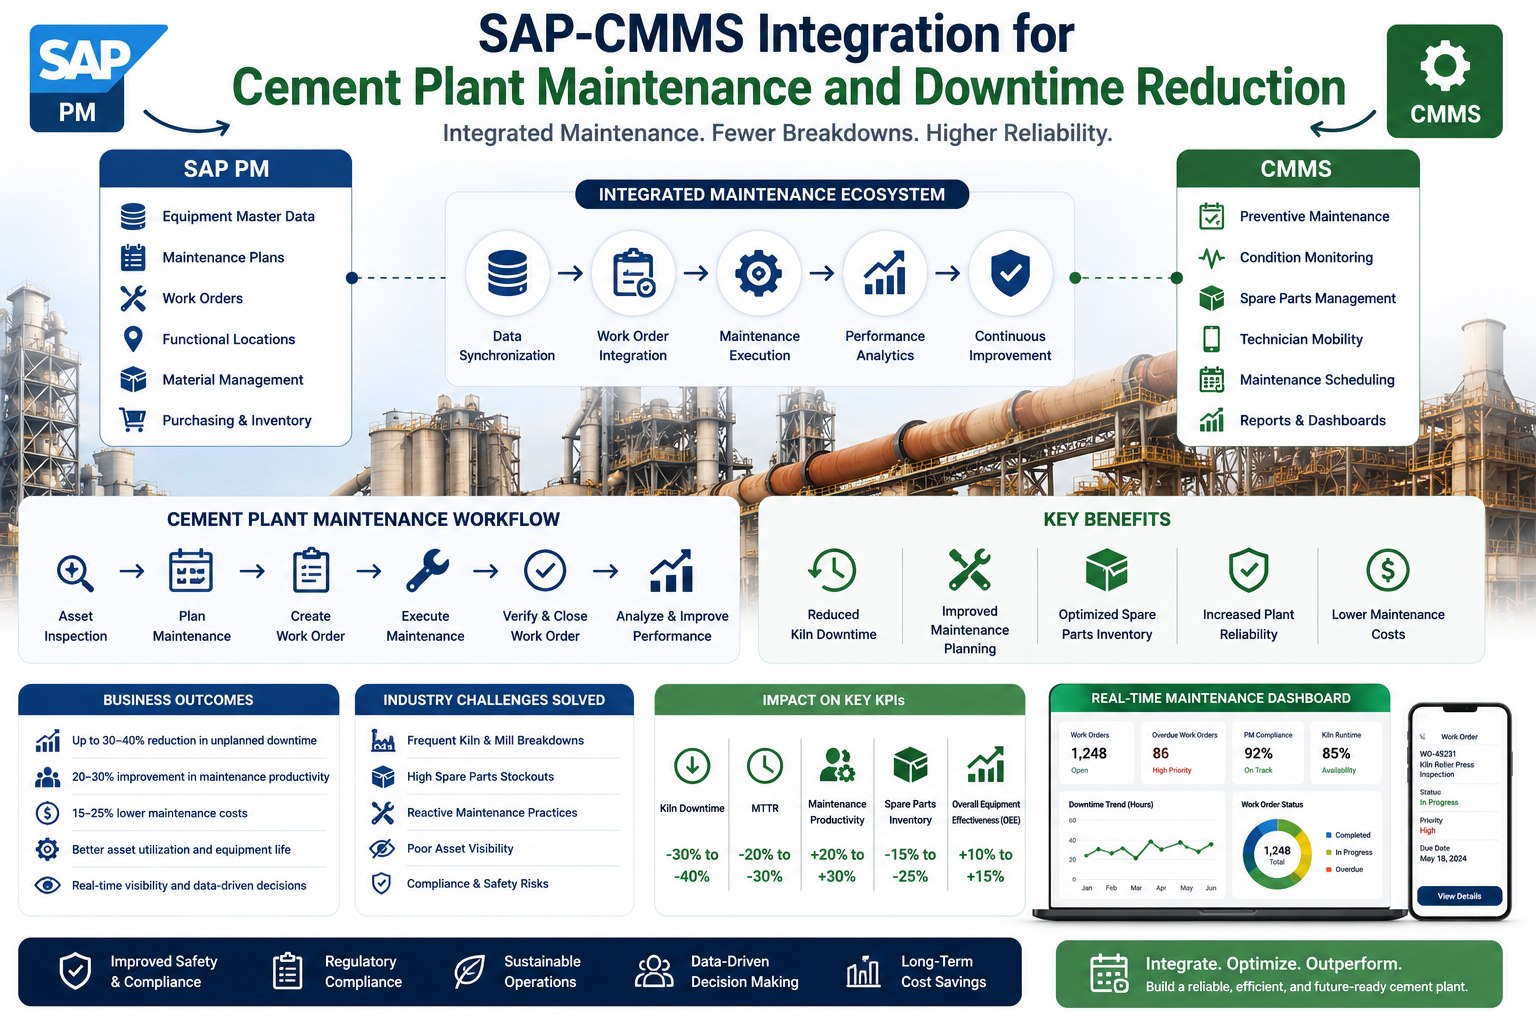
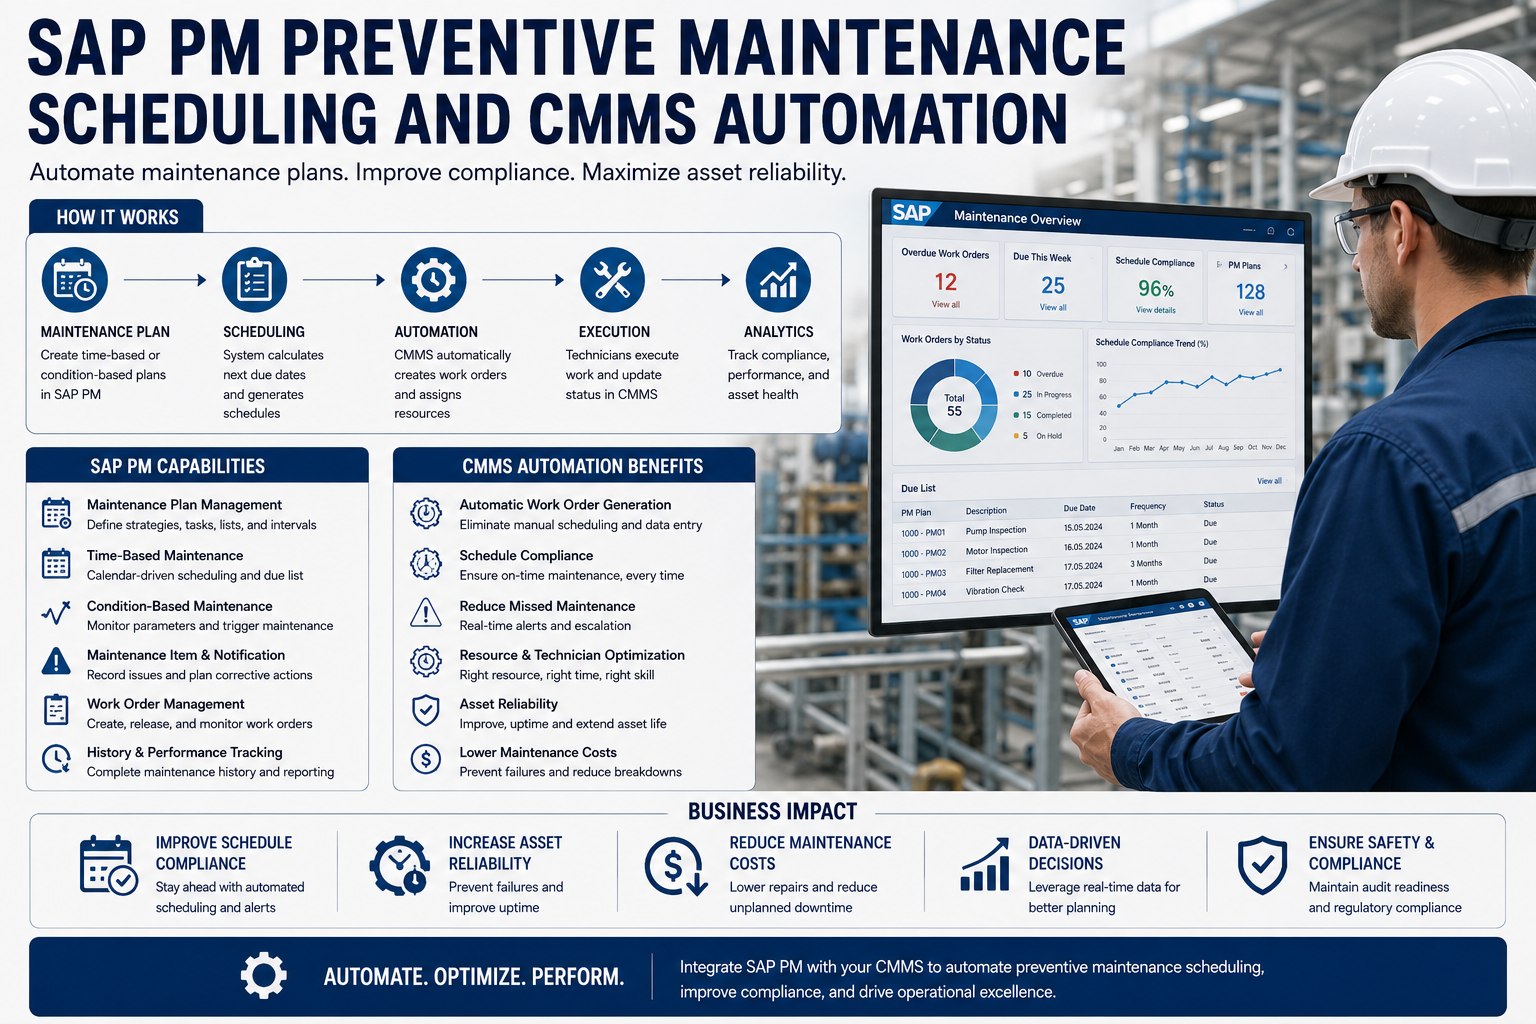
SAP Preventive Maintenance: Automating PM Scheduling with CMMS Software
Manual SAP PM scheduling caps your compliance around 70%—not because planners aren't trying, but because the math stops working at scale. Automation pushes compliance above 95% while cutting planner admin time by 60%. The mechanism is straightforward once you see it run, so book a free demo to watch automated PM in action against a real SAP environment.
IMPLEMENTATION GUIDE
Automating SAP Preventive Maintenance with CMMS Software
Why manual PM scheduling fails at scale, the four automation types every maintenance organization needs to know, and the lifecycle that makes it work.
95%+PM compliance
60%Planner time freed
4Automation types
Why Manual PM Scheduling Breaks Down at Scale
SAP PM is fully capable of managing preventive maintenance plans, task lists, and scheduling cycles. The system works. What doesn't scale is the human in the middle. A planner managing 500 assets across multiple PM strategies typically spends 50–60% of their day on administrative tasks: running IP30 deadline monitoring jobs, manually releasing the orders, chasing technicians for completion data, reconciling missed schedules. Add another 500 assets and the math breaks. Add condition-based PMs that depend on sensor data, and the math breaks faster. The result is the same in nearly every manual environment—compliance rates that stall in the 60–70% range, despite everyone working hard.
Manual vs Automated PM Operations
Where the operational difference shows up
Compliance Rate
60–70%
95%+
Planner Admin Time
50–60%
10–15%
PM Coverage Capacity
~500 assets
2000+ assets
Missed PMs / Month
15–25
0–2
Manual PM management
CMMS-automated
The numbers above are why maintenance leaders push for automation—not because they distrust their planners, but because the math doesn't work without it. A planner running 500 assets at 65% compliance is technically achieving more than the same planner running 2000 assets at 95% compliance, but the second scenario delivers vastly more equipment reliability for the same headcount. Teams ready to scope the same shift in their own operations can sign up free to baseline their current PM compliance against the four-automation framework laid out below.
The Four PM Automation Types — Decision Matrix
Not every asset needs the same automation approach. Time-based PMs are simple to automate but produce wasted work when applied to assets with variable duty cycles. Condition-based PMs are powerful but require sensor coverage that many older assets lack. Choosing the right automation type for each asset is the design decision that determines whether the PM program delivers reliability or just generates paperwork. The matrix below maps the four automation approaches to the asset profiles where each fits best.
01
Time-Based PM
Trigger
Calendar interval — every 30 days, quarterly, annually
Best For
Assets with consistent operating profile, regulatory inspections, lubrication and filter changes on predictable wear schedules.
SAP Implementation
Standard maintenance plan with strategy and cycle. IP10 generates calls. CMMS releases automatically.
Example
Monthly inspection of fire suppression systems, quarterly oil change on gearboxes, annual transformer testing.
02
Usage-Based PM
Trigger
Counter reading — operating hours, cycles, distance traveled, units produced
Best For
Equipment where wear correlates with usage rather than time—motors, rotating machinery, vehicles, conveyor belts running variable shifts.
SAP Implementation
Performance-based maintenance plan with measuring point. IK11 captures readings. Threshold triggers schedule.
Example
Motor bearing inspection every 4,000 operating hours, conveyor belt replacement after 10 million cycles, vehicle service every 25,000 miles.
03
Condition-Based PM
Trigger
Sensor threshold — vibration, temperature, pressure, current draw above limit
Best For
High-value or critical assets where failures produce degradation signatures detectable by sensors before breakdown.
SAP Implementation
Measurement-point-driven maintenance plan with threshold monitoring. CMMS receives sensor data and triggers SAP order generation when limit is crossed.
Example
Pump bearing replacement when vibration exceeds 4 mm/s, motor inspection when current draw rises 15% above baseline.
04
Predictive PM
Trigger
AI failure prediction — model forecasts remaining useful life
Best For
Critical assets with rich historical data and continuous sensor streams. The most expensive automation tier; only justified for highest-stakes equipment.
SAP Implementation
AI analytics layer running on integrated SAP + CMMS + sensor data emits prediction events that auto-generate work orders in SAP.
Example
Caster drive scheduled 21 days before predicted bearing failure, blast furnace blower replaced during planned outage rather than emergency.
Most plants run all four types simultaneously—time-based for inspections and consumables, usage-based for wear-driven components, condition-based for monitored critical assets, and predictive on the equipment where downtime is unacceptably expensive. The CMMS automation layer needs to handle all four without forcing them into a single model—otherwise high-value assets get treated like commodity equipment, and commodity equipment gets over-maintained.
The PM Automation Lifecycle
Preventive maintenance is not a project that finishes. It is a continuous cycle that improves with every iteration. The lifecycle below shows the six stages that any automated PM program runs through—and the closed loop where execution data feeds back into strategy refinement. Each stage produces inputs for the next; skip a stage and the program degrades quickly.
Continuous PM Automation Lifecycle
Six stages, one continuous cycle, compounding reliability gains
01
Define PM Strategy
For each asset class, decide which automation type fits (time, usage, condition, predictive). Set criticality scores. Define expected reliability targets.
SAP master data · Criticality matrix
02
Build Maintenance Plans
Configure SAP maintenance plans with task lists, cycles, materials, and labor requirements. Tie each plan to specific equipment or functional locations.
SAP IP01 · IA01 · Task lists
03
Automated Scheduling
CMMS continuously polls SAP for upcoming PMs, balances capacity against work backlog, and pre-stages parts and labor for the next planning horizon.
CMMS scheduler · IP30 · Capacity engine
06
Analyze & Refine
Compliance, MTBF, parts consumption, and labor data flow back into strategy review. Adjust intervals, retire ineffective PMs, expand high-value coverage.
MCI3 · MCI8 · Analytics dashboards
05
Mobile Execution
Technicians receive work orders on mobile, complete tasks at the asset, capture readings and photos, close work orders with full data on-site.
Mobile app · IW41 · IK11
04
Work Order Release
When trigger conditions are met, the integration auto-creates the SAP work order, releases it, and pushes the assignment to the technician's mobile device.
SAP order generation · Mobile push
Stage 06 feeds directly back into Stage 01—the cycle is continuous, and each iteration tunes the program toward higher reliability with less effort.
The closed loop is what separates mature PM programs from compliance-checkbox exercises. Teams that treat PM automation as a one-time setup hit a ceiling around 80% compliance. Teams that run the full lifecycle—including the analyze-and-refine stage that most skip—routinely hold compliance above 95% while expanding coverage. Maintenance organizations ready to operationalize the full cycle can sign up free to run the lifecycle diagnostic against their current PM program.
See PM Automation Running Against Your SAP Environment
A 30-minute working session walks through all four automation types, the lifecycle implementation, and the SAP connector configuration—mapped to your specific asset mix, maintenance strategies, and compliance targets.
Implementation Roadmap — From Manual to Automated PMs
The path from a manual PM program to a fully automated one runs about 16 weeks for a typical mid-sized plant. The roadmap below sequences the work so each phase produces something usable on its own, ROI starts compounding before the full rollout finishes, and risk stays contained. Skipping phases is the single most common cause of stalled implementations.
01
Week 1–2
Asset Criticality & Data Audit
Score every asset on criticality (production impact × failure consequence). Identify the top 20% that drive 80% of reliability risk. Audit SAP master data quality for these assets—equipment records, functional locations, BOMs, measuring points.
Deliverable: Asset criticality matrix & data readiness report
02
Week 3–4
PM Strategy Design Per Asset Class
For each critical asset class, decide the right automation type (time, usage, condition, or predictive). Define intervals, thresholds, and task lists. Document expected compliance and reliability targets so the program has measurable goals.
Deliverable: Strategy matrix mapping asset class to automation approach
03
Week 5–8
SAP-CMMS Integration Setup
Configure the connector between SAP PM and the CMMS. Map equipment records, functional locations, and cost centers. Set up bidirectional sync for work orders, maintenance plans, and measurement documents. Test edge cases before pilot.
Deliverable: Working integration with verified data flow
04
Week 9–12
Pilot With One Asset Class
Activate automation for a single critical asset class—often rotating equipment or motors. Run for 60 days. Monitor compliance, completion rates, and technician feedback. Refine workflows based on real friction before expanding scope.
Deliverable: Validated automation workflow with measurable compliance lift
05
Week 13–16
Plant-Wide Rollout
Expand to all critical asset classes in waves. Onboard remaining technicians to mobile workflows. Activate condition-based and predictive automation tiers where sensor coverage allows. Begin the continuous analyze-and-refine cycle.
Deliverable: Production-running automated PM program at 90%+ compliance
The phased approach matters because each stage produces something usable—plants that try to compress all five into a single sprint typically get stuck at the integration setup stage with no pilot data to guide refinement. Maintenance teams scoping their own roadmap can sign up free to map the 16-week plan against their plant's specific asset mix and SAP configuration.
The PM Automation Planning Checklist
Before activating automation, four readiness areas need verification. The checklist below covers the essential items that determine whether automation deploys cleanly or surfaces problems at go-live. Plants that complete this checklist before launching typically deliver projects 30–40% faster than those that don't—mostly because they avoid discovering data and configuration gaps mid-rollout.
A
Asset & Data Readiness
Equipment master records complete with criticality scores assigned
Functional location hierarchy reconciled and current
Historical work order data accessible for top 100 assets
Asset BOMs current and validated against actual installations
Operating-hours counters and measuring points configured for usage-based PMs
B
PM Plan Configuration
Standard task lists (IA01) built for the top 10 asset classes
Maintenance strategies defined (time, usage, condition, predictive) per asset
Trigger thresholds documented with the engineering rationale behind each
Planner group assignments mapped for every active maintenance plan
Required parts pre-staged in MM with reservations against PM orders
C
Integration & Workflow
SAP connector configured with field-level ownership rules documented
Bidirectional sync tested for work orders, master data, and measurements
Mobile workflows designed and tested on actual shop-floor devices
Auto-release rules configured (which PMs need approval, which auto-release)
D
Go-Live Readiness
Technicians trained on mobile workflows with hands-on practice
Supervisors briefed on dashboards and exception handling
Rollback plan documented in case of critical sync issues
Eighteen items, four categories. Plants that walk through this checklist before activating automation rarely encounter the show-stoppers that derail less-prepared projects. Maintenance leaders ready to run the checklist against their own environment can book a free demo to walk through the readiness assessment with our PM automation specialists.
Make Your PM Program Run Itself
Oxmaint connects to SAP PM, automates the four PM types across your asset base, and runs the full lifecycle from strategy through analytics—keeping SAP as the system of record while giving your maintenance team the mobile and automation layer that compliance actually requires.
How long does it take to automate PM scheduling for a typical industrial plant?
A focused implementation runs about 16 weeks from kickoff to plant-wide go-live: 2 weeks for asset criticality and data audit, 2 weeks for PM strategy design, 4 weeks for SAP-CMMS integration setup, 4 weeks for pilot with one asset class, and 4 weeks for plant-wide rollout. Larger or more complex environments can stretch to 22–26 weeks. The biggest timeline variable is master data quality—plants with significant data clean-up needs add 4–8 weeks to the front of the project.
Do I need to abandon SAP PM to run an automated CMMS layer?
No. The architecture preserves SAP PM as the system of record—maintenance plans, task lists, financial postings, and cost rollups all continue to live in SAP. The CMMS layer adds automation, mobile execution, sensor integration, and the analytics that SAP was not built to deliver natively. Bidirectional sync keeps both systems consistent, so the maintenance organization gets enhanced capability without losing SAP investment.
Which PM automation type should I start with?
Time-based automation is the right starting point for most plants—it is simplest to configure, covers the largest number of assets, and produces measurable compliance gains within 60 days. Usage-based automation comes next, layered onto assets where counters already exist. Condition-based and predictive automation require sensor coverage and typically deploy in waves once basic automation is stable. Trying to launch all four types simultaneously usually slows the project without delivering proportional value.
What does the integration look like architecturally—API-based, middleware, or custom?
Modern integrations primarily use SAP OData APIs for master data, work order, and measurement document sync, with the CMMS handling automation logic, mobile execution, and analytics. For older SAP environments, RFC and IDoc interfaces may supplement OData where needed. The CMMS automation layer typically runs on dedicated on-premises hardware to keep latency low and operational data inside the plant network—important for real-time PM triggering and sensor data processing.
How do I measure success after PM automation goes live?
Four core metrics: PM compliance rate (target 95%+), planner administrative time (target 60% reduction from baseline), missed PMs per month (target near zero), and MTBF on covered assets (expect 15–25% improvement within twelve months). Track these monthly during the first six months, then quarterly. Compliance rates above 95% with stable or improving MTBF is the signature of a healthy automated PM program—and the validation that the four-type strategy is sized correctly for the asset base.