sap-cmms-integration-roi

SAP Integration ROI: How to Calculate CMMS Payback and Cost Savings


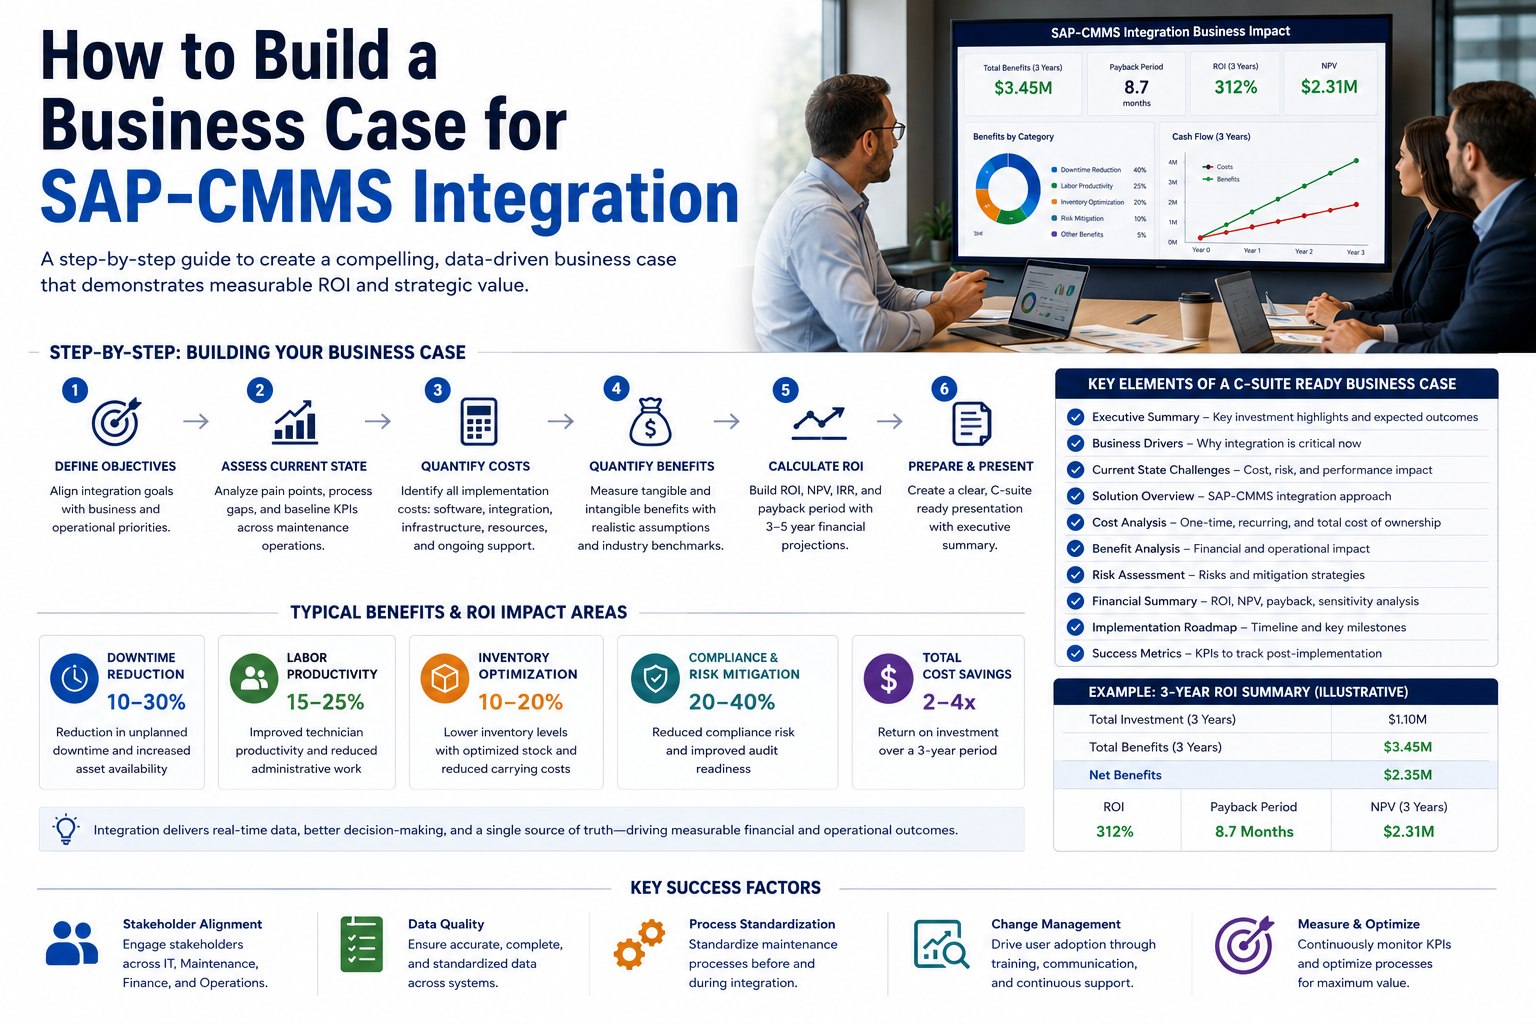
Every SAP-CMMS integration business case gets the same first question from finance: "Show me the math." Most maintenance directors describe benefits but can't quantify them in a format a CFO will sign. The result is integration programs stalled in committee for 18 months while emergency repairs keep happening. The plants that get funded build their case around five quantifiable savings levers, model payback against a realistic adoption curve, and show defensible numbers that survive procurement scrutiny. The math, done right, is rarely close. Book a free demo to walk through ROI on your plant's numbers.

SAP-CMMS Integration ROI Benchmarks
The Numbers Finance Departments Actually Approve
300–500%
Typical ROI within 18-24 months for SAP-integrated CMMS deployments
Source: CMMS ROI benchmark research
6–9 mo
Payback period for plants with high emergency repair baseline
Source: Industry research
10×
5-year cumulative ROI documented in U.S. DOE manufacturing programs
Source: U.S. Department of Energy
40–60%
Unplanned downtime reduction—the largest single savings lever
Source: CMMS benchmark studies

Why SAP-CMMS Integration ROI Math Is Different From Software ROI

Most enterprise software ROI calculations focus on labor productivity—how many hours people save with the new tool. SAP-CMMS integration ROI is structurally different because labor savings are typically the smallest of the value streams it produces. The biggest lever is downtime reduction, which doesn't show up as a software efficiency metric—it shows up as revenue protected. The second-biggest is inventory optimization, which releases working capital from the balance sheet, not from operating expense. The combined picture is closer to a capital-investment ROI than a typical software ROI, and that's why generic software calculators systematically understate the case.

The plants that get funded approach the math differently: they start with the baseline cost of inaction—what their plant loses today through unplanned downtime, emergency procurement, manual reporting, and compliance exposure—and then quantify how integration reduces each of those line items. The total is rarely close, which is why successful business cases come in at four to ten times return on investment, not the 20-30 percent improvements that small operational software typically produces. Teams ready to model this against their actual baseline can Sign up free to start capturing baseline data the ROI calculation requires.

The Five Savings Levers That Build CMMS ROI

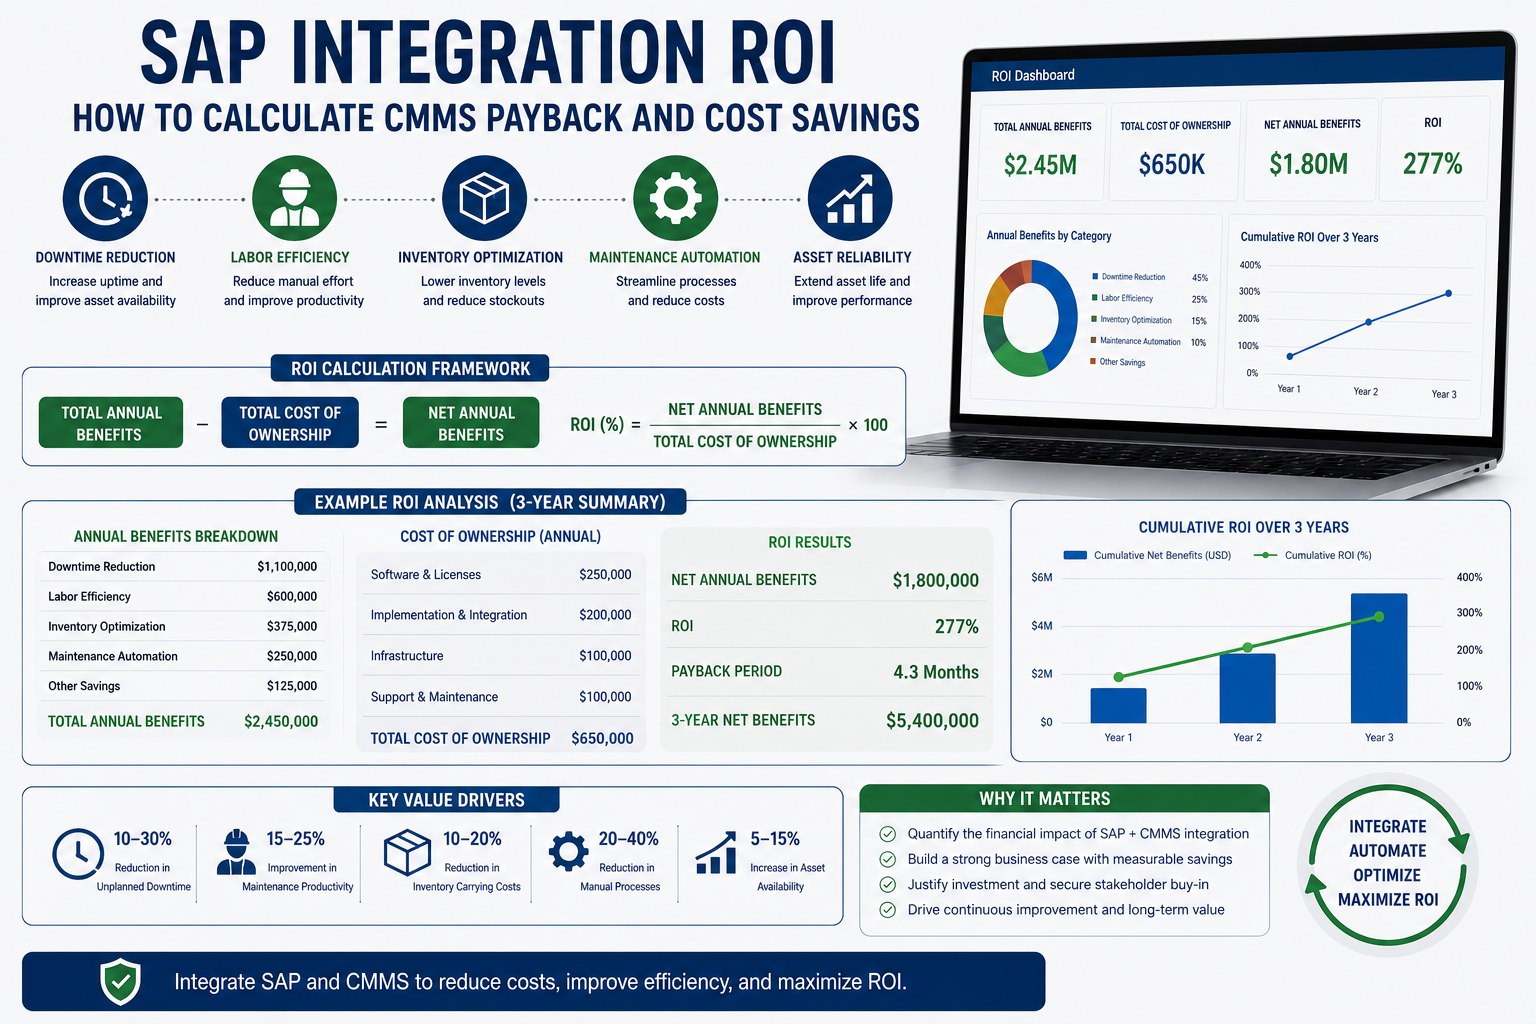
The visualization below shows how annual savings build up across the five categories that account for virtually all SAP-CMMS integration value. The numbers reflect a worked example for a mid-size manufacturing plant generating roughly $50 million in annual output, with a $4 million maintenance budget and 12 to 18 technicians. The five-lever framework scales linearly—larger plants see larger numbers in each category, but the proportional breakdown stays remarkably consistent.

Annual Savings Build-Up · $50M Plant Worked Example
Five quantifiable savings streams · Conservative assumptions · CFO-defensible math
01
Downtime Reduction
$1.5M
53% of total
500 hrs unplanned downtime × $2,000/hr × 40-60% reduction through predictive workflows
02
Labor Productivity
$480K
17% of total
15 techs × $50/hr burdened × 15% wrench-time gain from mobile work orders and routing
03
Inventory Optimization
$420K
15% of total
$2.8M MRO inventory × 15% carrying-cost release via ABC-VED classification and EWM sync
04
Asset Life Extension
$260K
9% of total
CapEx deferral from 20-40% longer asset life on critical equipment ($1.3M / 5-yr × 20%)
05
Compliance Avoidance
$190K
7% of total
Avoided OSHA penalties, audit prep labor, and compliance-driven downtime risk premium
$2.85M
Annual Savings
$420K
Year-1 Investment
5.3 mo
Payback Period
579%
Year-1 ROI

The dominance of downtime reduction in the buildup is the single most important insight for any business case. Plants that focus their ROI narrative on labor savings—the most visible category—undersell the case by 60 to 70 percent. The CFO conversation needs to lead with the downtime number, because that's where the revenue protection lives. Teams ready to baseline their own downtime exposure can Sign up free to start tracking actual downtime cost from the first work order.

The 18-Month Payback Curve: When Each Lever Activates

The five levers don't all activate on day one. The payback curve has a predictable rhythm: quick wins in the first 90 days from emergency procurement and labor efficiency, deeper wins through months 4-12 as PM compliance improves and inventory normalizes, and compounding returns from month 13 onwards as asset life extension and predictive patterns mature.

When Each Lever Lands: 18-Month Realization Curve
Months 0–3
Quick Wins
Labor Productivity Inventory (initial) Downtime Asset Life Compliance
~$420K realized — payback complete
Months 4–9
Core Returns
Labor Productivity Inventory Downtime Compliance Asset Life
~$1.8M cumulative — 3.3× return
Months 10–18
Compounding Value
Labor Productivity Inventory Downtime Compliance Asset Life
~$4.2M cumulative — 9.5× return
Asset life extension takes longest to quantify because it requires 12-18 months of comparative data to demonstrate CapEx deferrals defensibly to finance.

The shape of the curve is as important as the total. Finance leaders evaluating multi-year programs care about when savings start accruing, not just total accrual. Showing the quick-win phase in months 0-3 creates credibility for the larger numbers that land later. Teams ready to model their own 18-month curve can Book a free demo to walk through projected payback on their plant's numbers.

See Your Plant's ROI Calculated in Real Numbers
Walk through your own baseline data—downtime hours, technician count, inventory value, audit history—and watch the five-lever model produce a defensible business case ready for CFO review. 30 minutes, your numbers.

ROI Math vs Reality: What Plants Actually Capture

Theoretical models are useful only if real plants achieve real numbers. The data below comes from documented operating outcomes at manufacturers and process plants that completed SAP-CMMS integration over the past 36 months. The pattern is consistent: conservative business cases consistently undershoot actual realized value.

Business Case Assumptions vs Realized Outcomes (12-Month Average)
Swipe to compare
Metric Conservative Business Case Actual Realized Variance
Unplanned downtime reduction 30% 42% +12 pts
Inventory carrying cost reduction 10% 18% +8 pts
Labor productivity gain 10% 15–22% +5–12 pts
Payback period 12 months 5–8 months −40%
Year-1 ROI 180% 400–680% +2-4×
Total savings exceed projection by — 50–100% Material
$5–$15 Returned per $1 invested across documented outcomes
30–60 days Until first measurable cost differences appear

The reason conservative business cases consistently undershoot is that they typically count only two or three of the five levers—usually downtime and labor, sometimes inventory. The full five-lever framework captures categories that traditional ROI templates miss entirely, particularly compliance avoidance and asset life extension. Building the case with all five levers produces numbers that match documented realized outcomes rather than the underwhelming projections that get challenged by finance review.

Expert Perspective: Building a Business Case That Gets Funded

The fastest way to get a CMMS budget approved is to lead with the cost of inaction. Most maintenance directors lead with the cost of software, and they lose the room before they finish the second slide. The conversation has to start with what the plant loses today—500 hours of unplanned downtime times $2,000 an hour is a million dollars right there. Once finance is looking at that number, everything else becomes leverage against it. A $400,000 investment that recovers $2.8 million is an obvious yes. The same investment described as "$400,000 in maintenance software" is an obvious no. Same dollar amount, different framing, opposite outcome.

Lead With the Cost of Inaction
The first number on the first slide should be what current operations cost, not what new software costs. Anchoring on the baseline changes every subsequent calculation from "expense" to "ROI."
Separate Hard Savings From Cost Avoidance
Hard savings are reductions in real spending—overtime, emergency orders, parts. Cost avoidance is preventing future spending. Both belong in the case, but distinguish them clearly. CFOs trust the case more when you don't blend them.
Show the 5-Year Picture
A 1-year payback is the headline; the 5-year cumulative ROI is the story. Year 2 and 3 returns are bigger than Year 1 because the predictive capabilities mature and the asset life extension data becomes defensible.

How to Build Your Own Defensible Business Case

The roadmap below is the four-phase approach that successful maintenance leaders execute when they need to build a business case that survives CFO review, board challenge, and procurement scrutiny. The full cycle takes 30 to 45 days from baseline collection to executive presentation.

From Baseline to Approval: 4-Phase Business Case Build
The exact sequence that gets integration budgets funded
Phase 1 · Days 1–10
Capture Baseline
Document current downtime hours, overtime spend, emergency procurement frequency, audit prep time, compliance exposure. This is the measurement anchor for every future savings claim.
Phase 2 · Days 11–20
Model the Five Levers
Apply conservative industry benchmarks to baseline. Calculate each savings stream with documented assumptions. Build best-case, base-case, and worst-case scenarios.
Phase 3 · Days 21–30
Build the Financial Story
Calculate payback period and 3-year cumulative value. Distinguish hard savings from cost avoidance. Build a 1-page executive summary and a detailed appendix.
Phase 4 · Days 31–45
Present & Defend
Present to CFO and procurement. Anticipate the "what if savings are 50% of projection" question—show the case still works. Secure approval. Lock in baseline tracking from day 1 of implementation.

The plants that get budget approved aren't the ones with the best technology—they're the ones with the best business case. The five-lever framework, applied honestly to baseline data, produces numbers that consistently survive scrutiny because they reflect what comparable plants have actually achieved. Teams ready to start their baseline capture can Sign up free to begin capturing the data their ROI case will require.
Build a Business Case That Gets Funded the First Time
Stop pitching maintenance software. Start presenting documented ROI from five quantified savings levers, modeled against your own baseline. See how the framework runs on real numbers in 30 minutes.

Frequently Asked Questions

What's the standard formula for calculating SAP-CMMS integration ROI?
The standard formula is ROI = (Total Annual Savings − Annual Investment) ÷ Annual Investment × 100. Total Annual Savings sums the five levers: downtime reduction (typically 45-55% of total), labor productivity gain (15-20%), inventory carrying cost release (12-18%), asset life extension (8-12%), and compliance avoidance (5-10%). Annual Investment includes software licensing, integration consulting, and internal labor for deployment. The mistake to avoid is stopping at labor savings alone—that lever typically captures only 25-35% of the total value.
How long should the payback period realistically be?
For a mid-size manufacturing plant with high baseline emergency repair activity, payback typically lands in the 5 to 8 month range when measured against full five-lever savings. Conservative business cases often model 12-month payback to leave margin for execution risk, which is a reasonable approach for board presentations. The plants that achieve fastest payback are the ones with the highest unplanned downtime baselines—because they have the most savings headroom in the largest savings category.
Should I use hard savings or cost avoidance in the business case?
Both, but distinguish them clearly. Hard savings are reductions in actual current spending: fewer overtime hours, lower emergency procurement, reduced contractor labor. Cost avoidance is preventing future expenditure that hasn't happened yet: an equipment failure that didn't occur, a compliance penalty that didn't land, a CapEx replacement deferred by extended asset life. CFOs trust the case more when hard savings and cost avoidance are presented in separate columns rather than blended into a single total.
How do I baseline my plant if I don't have good historical data?
Start with what's measurable: pull six months of work order history from SAP PM, identify emergency vs planned work, capture overtime spend, and estimate downtime hours by reviewing production records. Even imperfect baseline data produces a defensible case if assumptions are clearly documented and benchmarks are conservative. The best approach is starting baseline data capture in parallel with business case development—by the time the CFO meeting happens, you have 30-45 days of cleaner data to support the projections.
What's the biggest mistake plants make in CMMS ROI calculations?
Two mistakes consistently kill business cases. The first is counting only one or two savings levers—usually labor and obvious inventory—which captures 30-40% of the actual value and produces underwhelming ROI numbers that don't justify investment. The second is leading with the cost of software rather than the cost of inaction. Reframing the same investment as "$400,000 to recover $2.8 million in current losses" instead of "$400,000 in maintenance software" produces opposite outcomes in the same procurement meeting.


Share This Story, Choose Your Platform!