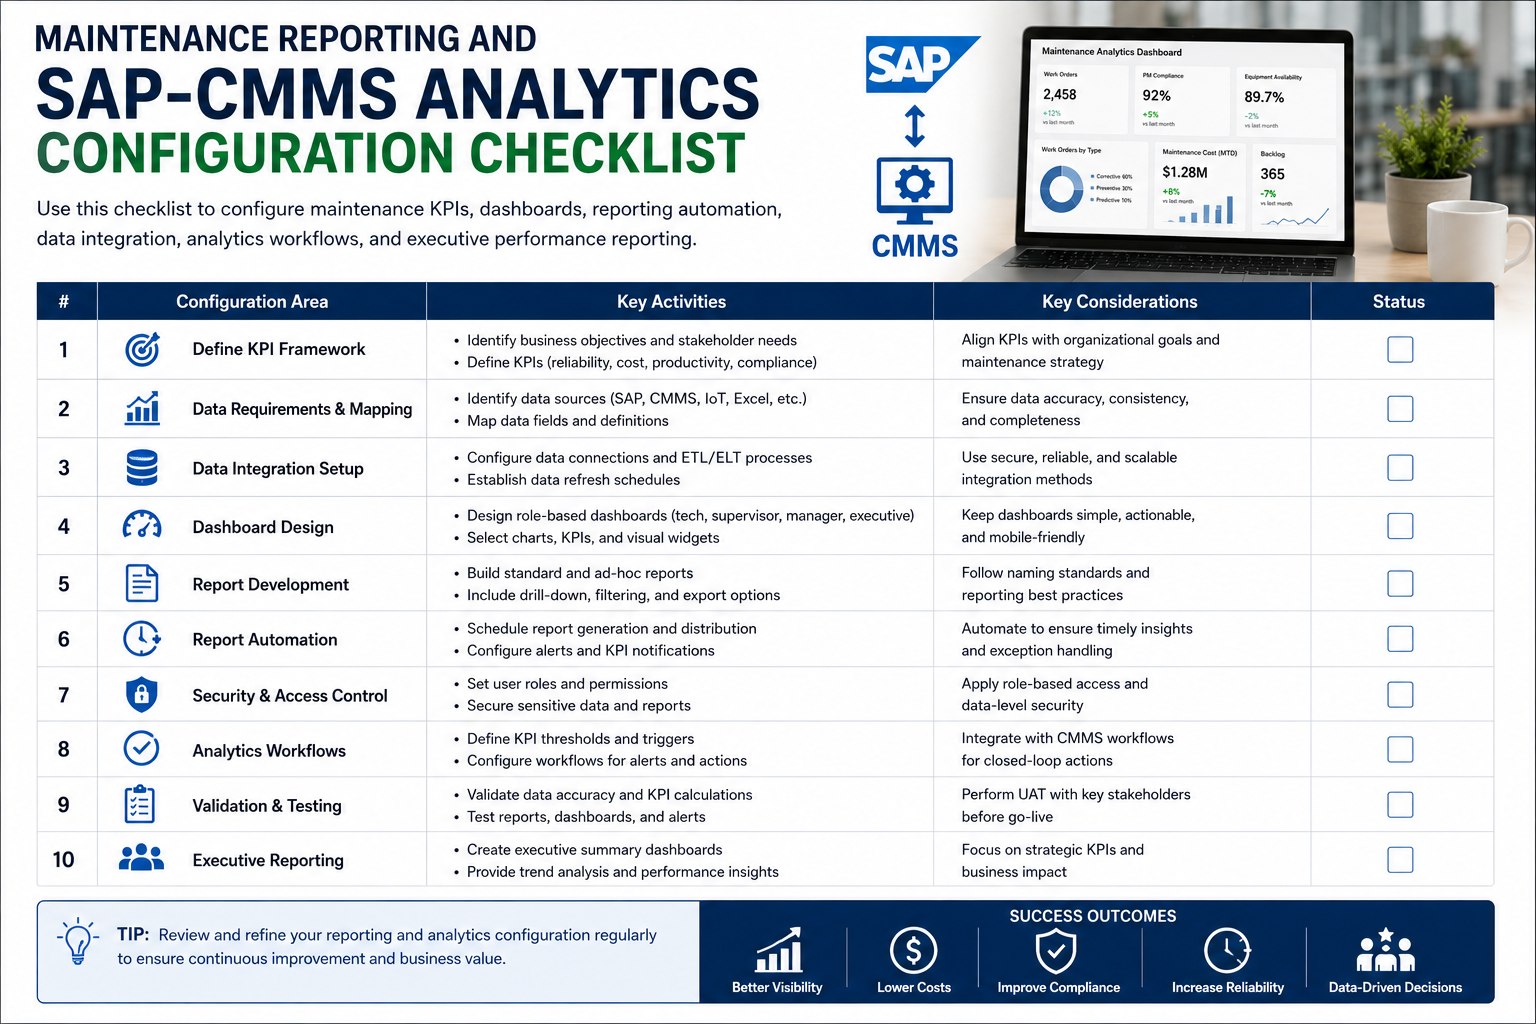
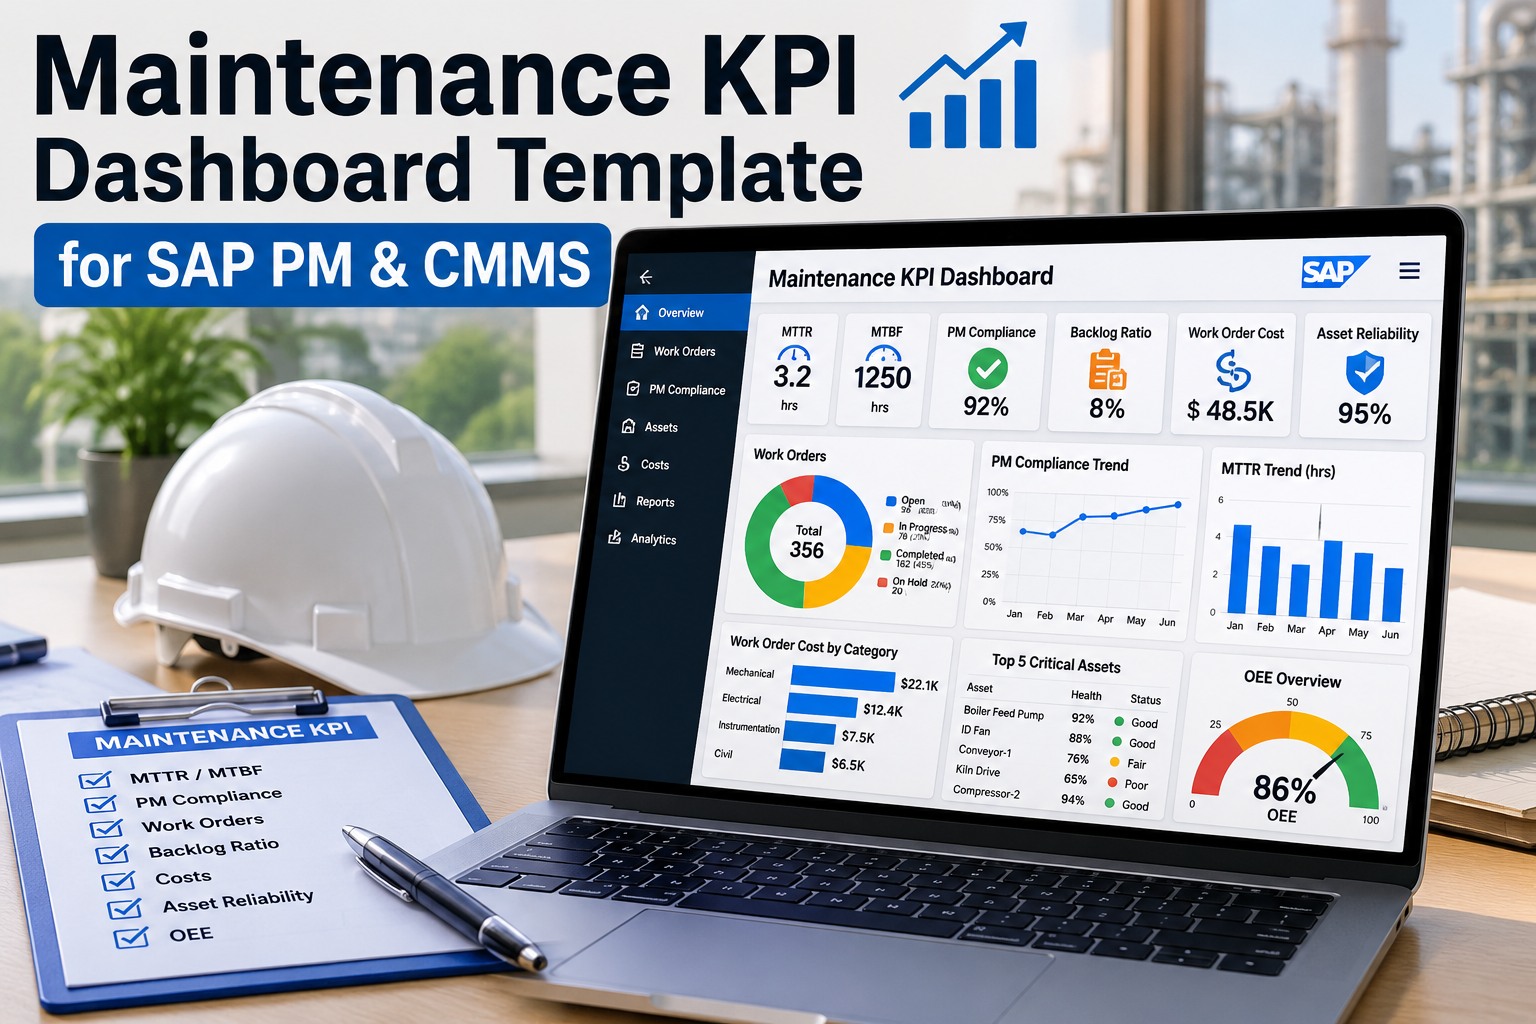
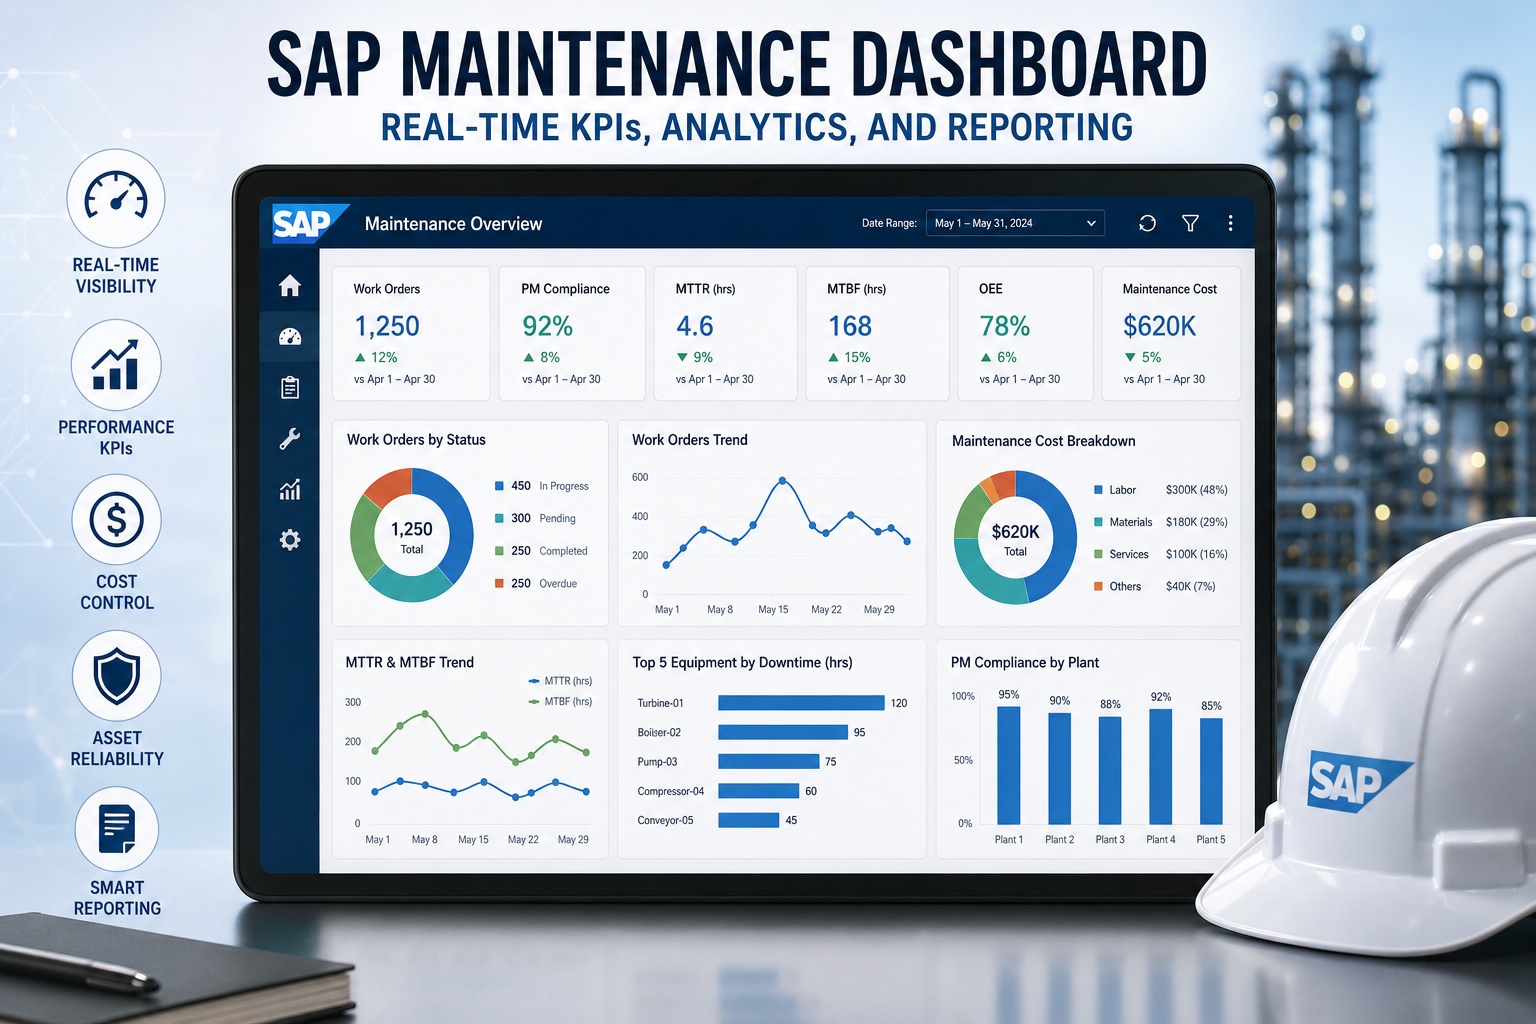
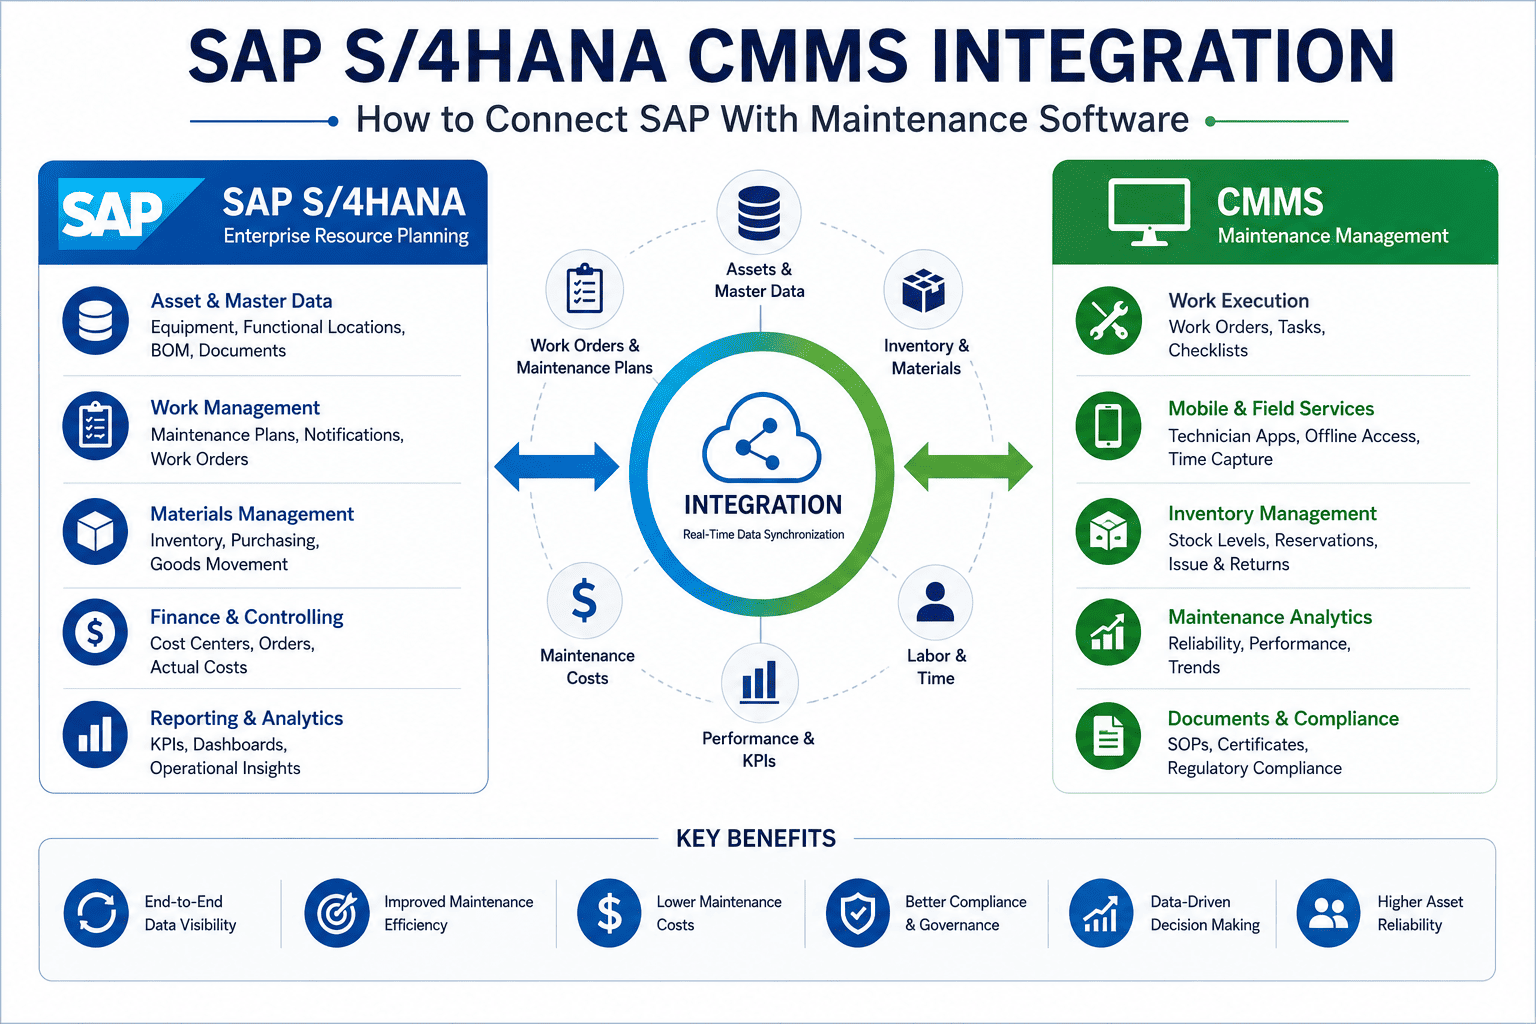
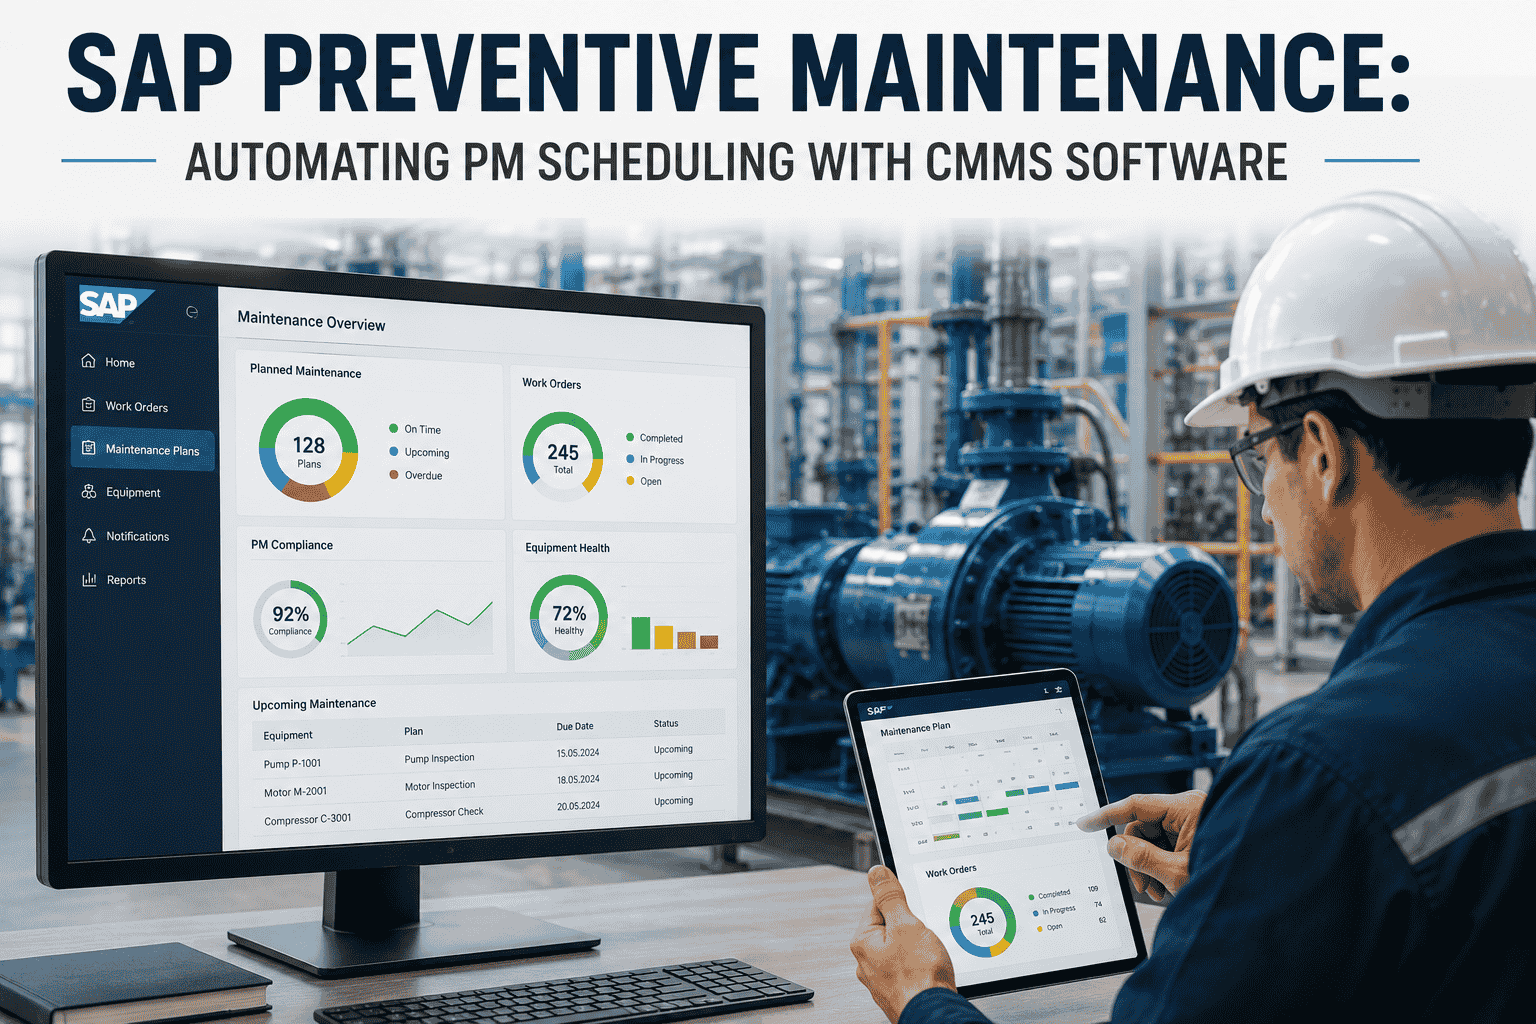
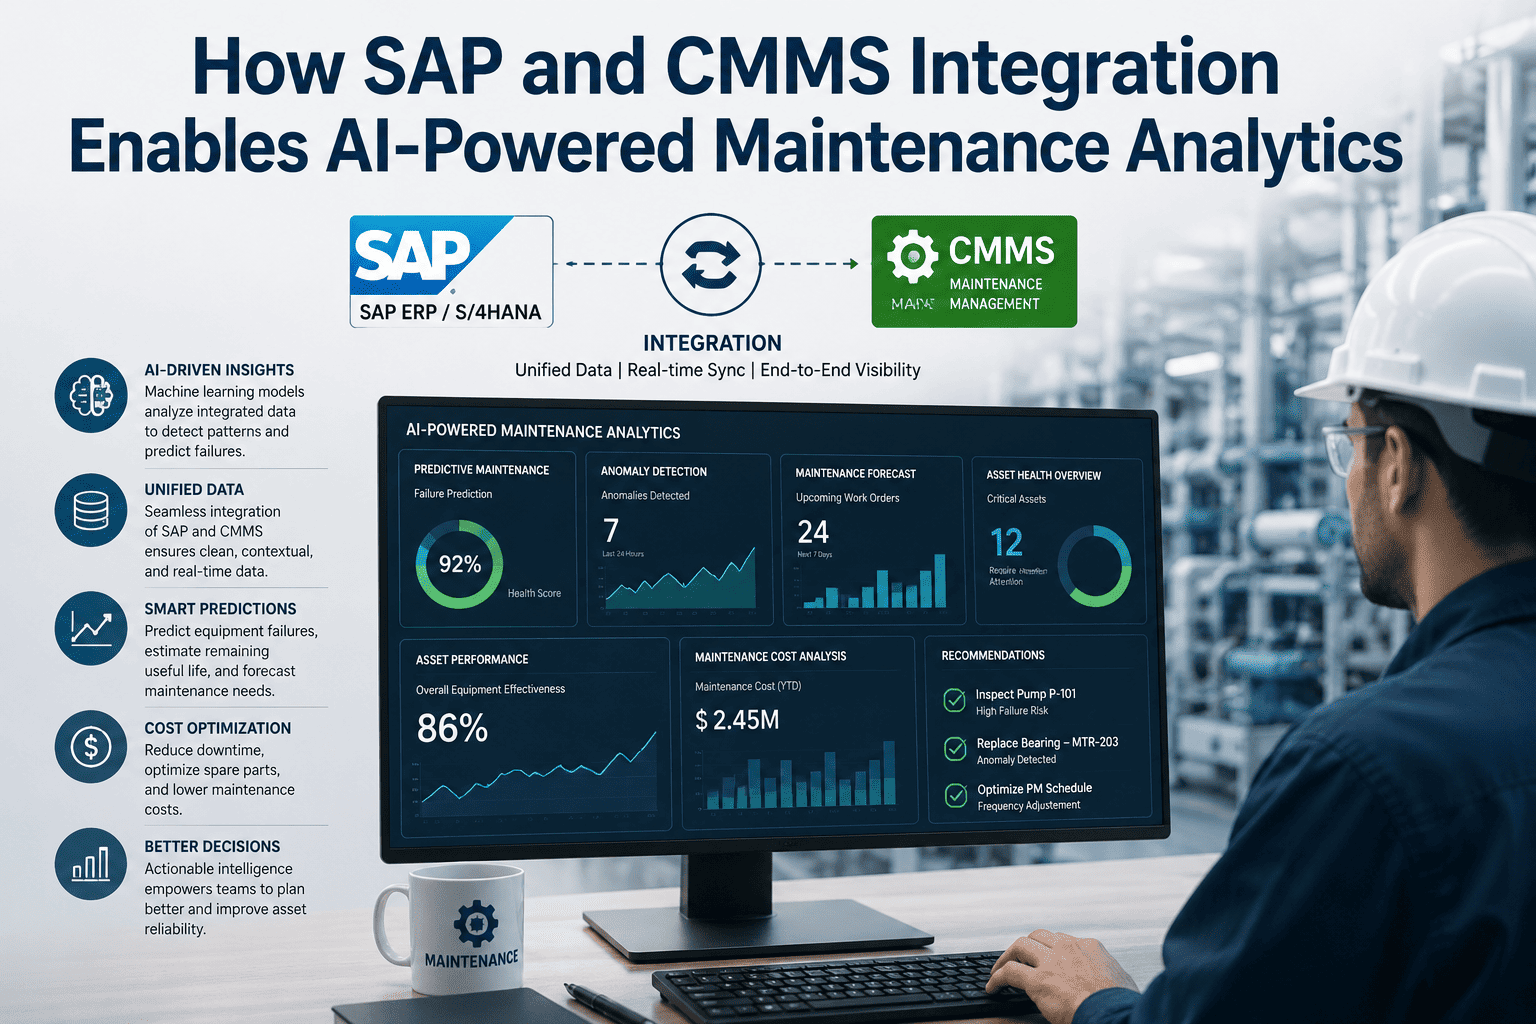
Maintenance Reporting and SAP-CMMS Analytics Configuration Checklist
Most SAP-CMMS analytics implementations produce dashboards that nobody trusts and reports that nobody reads. The cause isn't tool selection or data quality—it's configuration discipline. Maintenance reporting succeeds when six configuration layers are built sequentially: data integration foundation, master data hygiene, KPI definition, dashboard visualization, automation, and governance. Skip any layer and the analytics output becomes unreliable. This checklist gives you the specific configuration criteria at each layer so your maintenance reporting actually drives decisions instead of generating noise. Book a free demo to see configured analytics in production.
REPORTING CONFIGURATION REALITY
Why Most Maintenance Analytics Programs Underperform Their Tools
6
Configuration Layers
18
Configuration Criteria
70%
Programs With Trust Gaps
3x
Adoption With Discipline
Why Maintenance Reporting Configuration Determines Analytics Value
Every maintenance reporting program eventually faces the same moment: a senior leader questions a number on a dashboard, the reporting team can't quickly explain where it came from, and trust evaporates. Once a dashboard loses credibility, recovering it takes 6-12 months of consistent reliability—if it can be recovered at all. The cause traces back to configuration: data lineage gaps, undefined calculations, inconsistent master data, automated reports nobody validates.
Configuration discipline isn't about more tools or bigger budgets. It's about sequential build-up of six layers, each one validated before the next is added. Maintenance leaders ready to assess current configuration maturity can Sign up free to assess your current reporting configuration maturity.
Where Most Maintenance Reporting Implementations Fall Short
Four failure modes account for nearly all underperforming reporting implementations. Each one ties back to a missing or skipped configuration layer. Recognizing them in your own environment is the first step toward fixing them.
Dashboards Nobody Trusts
Data lineage gaps and conflicting numbers between reports. Leaders question one figure, lose faith in all of them.
Reports Nobody Reads
Automated distribution lands in inboxes that never open them. The reports exist as compliance theater, not decision support.
KPIs Without Decisions
Metrics that track activity without triggering action. If nobody changes behavior based on the number, it isn't a KPI.
Configuration Drift
Dashboards built during implementation, never maintained. Equipment changes, processes evolve, the dashboard quietly goes stale.
The 6-Layer SAP-CMMS Analytics Configuration Stack
The configuration stack below builds maintenance reporting in the order that produces reliable analytics. Each layer depends on the layers below it being correctly configured first. Skip a layer and everything above it inherits the gap. Work through the criteria in sequence and apply the same discipline across every dashboard you build.
6 LAYERS · 18 CRITERIA · SEQUENTIAL BUILD
Analytics Configuration Stack
Foundation at the bottom · Strategic outputs at the top
PHASE A · Foundation
PHASE B · Logic & Display
PHASE C · Operations
06
LAYER · TOP
Governance & Continuous Improvement
Maintain the analytics system as the operation evolves
Quarterly KPI review process established with operational stakeholders
Dashboard usage analytics tracked to identify views that drive decisions
Continuous improvement cadence captures user feedback and prioritizes refinements
05
LAYER
Automation & Distribution
Push reports and alerts to the right people on the right schedule
Scheduled report distribution configured by role with appropriate cadence
Threshold-based alerts trigger notifications for KPI excursions and anomalies
Mobile push notifications enabled for time-sensitive operational events
04
LAYER
Dashboard Visualization
Build the views that serve daily, weekly, and monthly decision rhythms
Operational dashboard (daily) shows current WOs, urgent notifications, equipment alarms
Tactical dashboard (weekly) shows backlog, compliance trends, planning health
Targets and threshold bands set per KPI with leadership sign-off
Calculation methodology peer-reviewed for accuracy and audit defensibility
02
LAYER
Master Data Hygiene
Ensure equipment hierarchy, classifications, and coding are reporting-ready
Functional location hierarchy reviewed with no orphan equipment
Equipment classifications standardized across plants and consistent with reporting needs
Cost center and order type mapping validated against finance system
01
FOUNDATION
Data Integration Foundation ANCHOR · EVERYTHING DEPENDS
Connect SAP PM, CMMS, sensors, and mobile data into one unified flow
SAP PM master data sync (equipment, FLOCs, cost centers) configured and validated
CMMS-to-SAP bidirectional connector tested with WO status, cost roll-up, parts consumption
Sensor and IoT data streams normalized into common timestamps and units
6Configuration Layers
18Specific Criteria
3Phase Groupings
01Foundation Anchor
The discipline is sequential: never start configuring Layer 03 until Layer 02 is complete; never start Layer 04 until Layer 03 is complete. Skipping ahead produces dashboards that work in demos but break when stakeholders ask hard questions during real operational decisions—and once that credibility is lost, recovering it takes far longer than building it correctly the first time would have.
SEE IT IN PRACTICE
Watch the Configuration Stack Running on Real Architecture
30-minute walkthrough showing all six layers configured against real SAP PM data with executive dashboards rendering in real time.
The KPI Definition Framework Every Configuration Should Use
A well-configured KPI has six components defined before it appears on a dashboard. Missing any component produces metrics that look professional but fail under scrutiny. Apply this framework to every KPI in your reporting program.
Formula
Clear
repeatable math
Exact calculation documented; same input produces same output every time
Source
Specific
systems & fields
Which SAP table, which field, which CMMS data point feeds the calculation
Target
Banded
with thresholds
Target value plus green/yellow/red bands defining performance states
Cadence
Defined
refresh schedule
Real-time, hourly, daily, or weekly—matched to decision rhythm
Two additional components round out the framework: Owner (the person accountable for the metric and any required action) and Decision Trigger (what specific action the metric is supposed to prompt). KPIs missing these last two components remain interesting numbers rather than decision drivers. Reporting leaders ready to audit existing KPIs against the framework can Sign up free to audit current KPIs against the 6-component framework.
ROI of Properly Configured Maintenance Reporting
The performance delta between disciplined configuration and ad-hoc reporting shows up in every dimension that matters: data quality, user adoption, decision speed, and the proportion of metrics that actually drive operational change.
AD-HOC REPORTING vs DISCIPLINED CONFIGURATION
Analytics Program Performance Delta
Dashboard Trust Score
30%
85%+
+55 pts
Report Open Rate
15%
70%+
+55 pts
Decision Speed
2-3 days
Same-day
−80%
Actionable KPI Share
20%
75%+
+55 pts
Configuration Drift
High
Minimal
−80%
3-6 mo
Typical payback period for disciplined configuration vs ad-hoc approach
3x
User adoption rate with disciplined configuration vs ad-hoc
The compounding effect: each dimension reinforces the others. Trusted dashboards get opened, leading to faster decisions, which validate the KPI selection, which drives further refinement. Reporting leaders ready to model their analytics program payback can Book a free demo to model your analytics program payback.
Expert Perspective on Configuration Discipline
"
The reporting programs I've watched genuinely succeed share a property that surprises new analytics leaders: they configure fewer dashboards than the ones that fail. Failed programs try to build everything at once—operational dashboards, tactical reports, executive summaries, mobile views, alerts, KPI scorecards—all in parallel during implementation. Successful programs build Layer 01 perfectly, validate it, then build Layer 02 on top of that validated foundation. By month six they have three rock-solid dashboards that leaders trust completely. By month twelve they have twelve. By month twenty-four they're the analytics function everyone else benchmarks. The discipline of doing fewer things well beats the velocity of doing many things badly every time.
01
Sequential Beats Parallel
Build layer by layer, validating each before adding the next. Parallel builds during implementation produce fragile dependencies that surface as crises.
02
Trust Is the Currency
A dashboard that nobody trusts has zero value regardless of technical sophistication. Configure for trustworthiness before configuring for richness.
03
Owners Make Metrics Matter
Every KPI needs a named human owner who acts on it. Unowned metrics produce activity reports rather than performance levers.
90-Day Implementation Sequence
The 90-day sequence below produces the first three trustworthy dashboards by day 90, with the remaining layers ready for build-out. Each phase has a specific deliverable that validates progress before moving forward.
90-DAY CONFIGURATION ROADMAP
Sequential Build-Out of the Analytics Stack
DAYS 1–25
01
Layer 01 + 02: Foundation
Data integration validated. Master data hygiene completed. Single source of truth established and signed off by stakeholders.
DAYS 26–50
02
Layer 03: KPI Definition
Core KPIs documented with formulas, targets, bands. Peer review completed. Leadership sign-off on metric portfolio.
DAYS 51–75
03
Layer 04: First Three Dashboards
Operational, tactical, and executive dashboards built. User testing with each persona group. Validation against benchmark numbers.
DAYS 76–90
04
Layer 05 + 06: Operations
Automation configured. Distribution lists active. Governance cadence established. First quarterly review scheduled.
By day 90, the foundation and first three dashboards are operational and trusted. The remaining build-out follows the same discipline applied to additional KPIs, additional personas, and additional decision rhythms. Analytics leaders ready to begin sequential build-out can Sign up free to begin Layer 01 configuration this week.
BUILD THE STACK
Configure Analytics Your Maintenance Organization Actually Trusts
Six layers. Eighteen criteria. Sequential discipline. The configuration approach that produces dashboards leaders use to make decisions.
How long does the full 6-layer configuration typically take?
A disciplined sequential build for a single-plant maintenance organization typically reaches operational analytics (Layers 01-04) within 90 days, with automation and governance (Layers 05-06) operational by month six. Multi-site organizations follow the same cadence for the first plant, then scale the proven configuration to additional sites in 4-6 weeks each. Teams that try to compress this below 90 days for the foundation typically end up with the trust problems described earlier—the time invested in proper Layer 01 and Layer 02 work prevents months of remediation later.
What KPIs should we configure first?
Start with five core KPIs that cover the maintenance value chain: PM Compliance (preventive maintenance discipline), Schedule Adherence (planning quality), MTBF/MTTR (reliability indicators), Maintenance Cost Variance (financial control), and Equipment Availability (operational outcome). These five cover demand, supply, reliability, cost, and outcome. Additional KPIs add value only after these five are trusted and acted upon. Adding KPIs before the core five are validated dilutes attention and reduces the chance any single metric drives behavior change.
How do we handle reporting across multiple SAP plants with different master data?
Multi-plant reporting requires explicit harmonization at Layer 02 (Master Data Hygiene). The pattern that works: establish a corporate master data dictionary that defines equipment classifications, cost center mappings, and order type categorizations consistently across plants. Each plant maps its local data to corporate categories during integration. Reports are built against corporate categories, ensuring cross-plant comparison validity. Plants that resist harmonization can keep local detail in addition to corporate categories, but corporate reporting always uses harmonized data. The harmonization effort is usually 4-8 weeks for a multi-plant organization but pays back permanently.
Should executive dashboards pull from SAP or from the CMMS?
Both, depending on the metric. Financial KPIs (cost variance, budget burn) should pull from SAP because SAP is the system of record for financial data. Operational KPIs (current backlog, daily WO completion) should pull from CMMS because CMMS has the real-time field execution data. Reliability KPIs (MTBF, MTTR) can pull from either system once both are integrated, with the choice driven by data quality and audit defensibility requirements. The integrated architecture makes the source decision invisible to the dashboard consumer while preserving the right source-of-truth for each metric category.
How do we prevent configuration drift over time?
Drift prevention requires Layer 06 (Governance) to be actively maintained, not just documented. The mechanisms that work: quarterly KPI review with the operational stakeholders who use the metrics; dashboard usage analytics flagging unused views for retirement; equipment change management triggering automatic master data review; and a named analytics product owner accountable for the reporting portfolio overall. Programs without active governance reliably drift within 12-18 months. Programs with active governance can run essentially indefinitely with continuous low-overhead refinement.