sap-pm-preventive-maintenance-scheduling

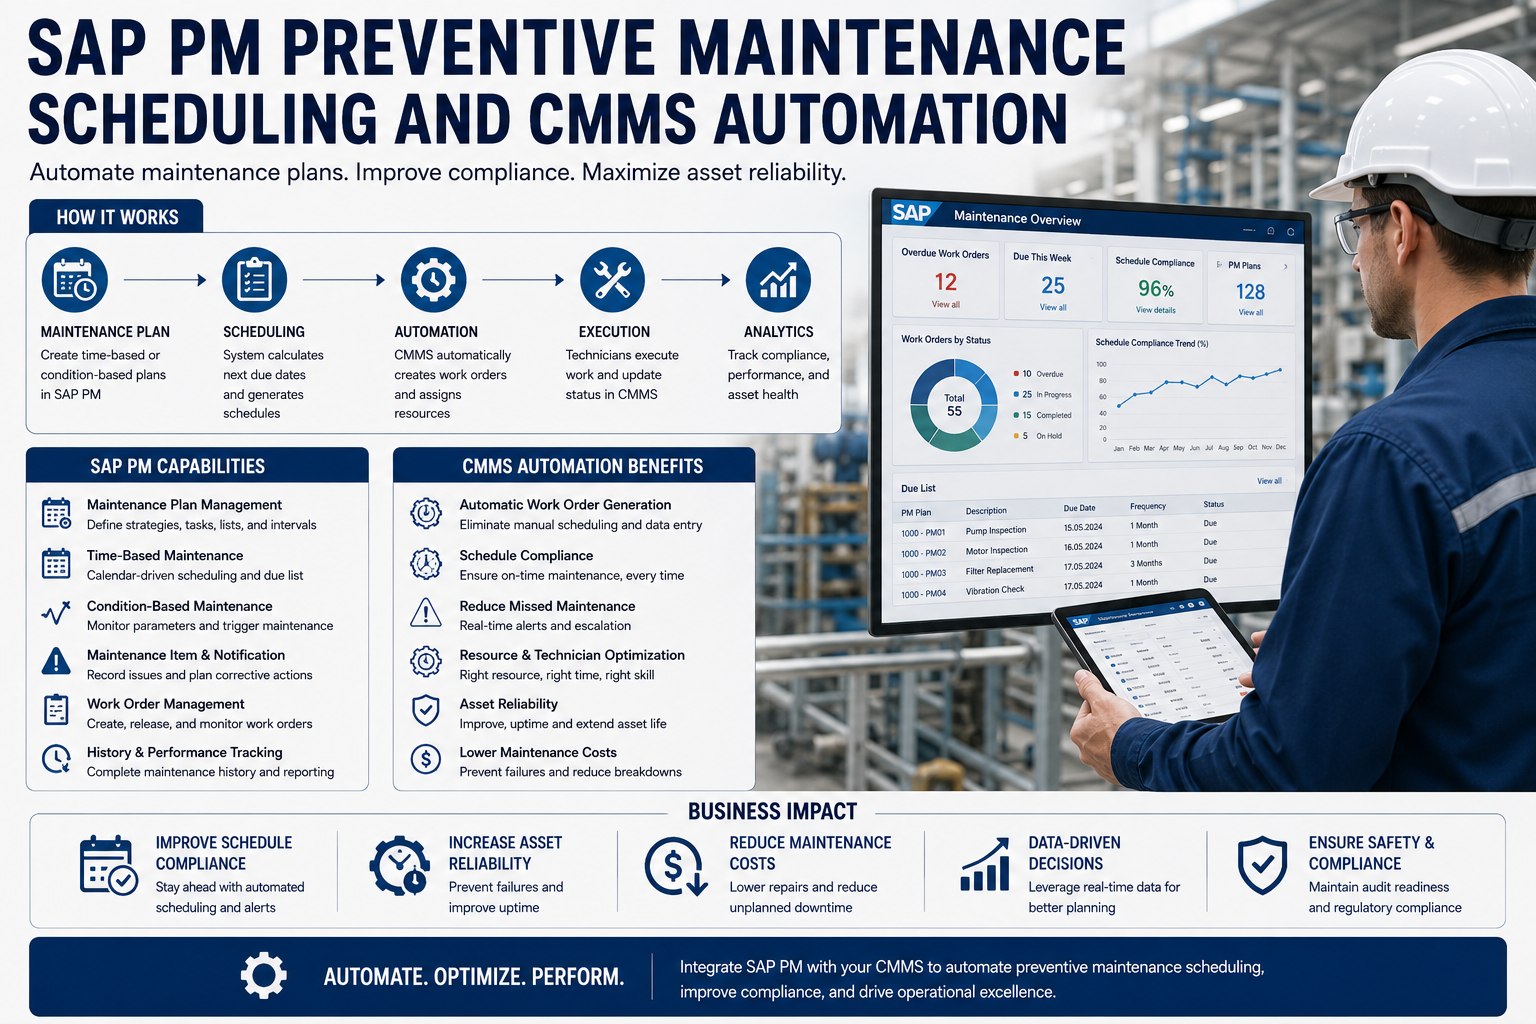
SAP PM Preventive Maintenance Scheduling and CMMS Automation


Every missed preventive maintenance task is a slow-motion failure that hasn't happened yet. A monthly bearing inspection skipped in March doesn't trigger an alarm—it just rearranges the odds of an unplanned breakdown in June. Plants running SAP PM have the right scheduling backbone, yet schedule compliance industry-wide still averages 75 to 80 percent, short of the 90 percent world-class benchmark. The gap rarely comes from missing plans in SAP. It comes from how plans get scheduled, dispatched, and confirmed—and automating that loop turns SAP PM from a planning tool into a reliability machine.

PM Scheduling, 2026 Benchmarks
The Numbers That Define a Mature PM Program
90%
Schedule compliance considered world-class for PM programs
Source: MaintainX / Fiix benchmarks
75–80%
Industry average PM schedule compliance across manufacturers
Source: emaint / Fiix
545%
Average ROI for every dollar spent on preventive maintenance
Source: Jones Lang LaSalle study
34.2%
Of all OEE efficiency losses come from unplanned downtime
Source: Godlan 2024 benchmark study

Why SAP PM Scheduling Breaks Down at Scale

SAP PM gives planners everything they need on paper. Maintenance plans live in IP41 and IP42. Deadline monitoring runs through IP30. Work orders dispatch through IW31. The infrastructure is solid. What breaks down is the human layer between the plan and the wrench. A planner schedules a monthly bearing inspection. SAP generates the order on the call date. The order prints to a queue. A supervisor assigns it to a technician at shift handover. The technician notes it on a clipboard, gets pulled into an emergency repair, and never circles back. The order sits in IW38 as "released" for three weeks until someone closes it with a vague confirmation.

Multiply that pattern across a plant with 400 active maintenance plans and the math goes bad quickly. The plans exist. The orders generate. The execution gap is where compliance gets lost. According to industry research, plants operating below 85 percent schedule compliance see a measurable rise in breakdown frequency within 60 to 90 days—because every late PM compounds the probability of the failure it was designed to prevent. Maintenance teams ready to close that loop can Sign up free to connect SAP PM plans to mobile execution in days, not months.

The Three Engines of PM Scheduling

SAP PM scheduling isn't one logic—it's three parallel engines, each suited to a different type of asset and degradation pattern. World-class maintenance programs run all three simultaneously, with the right engine assigned to the right equipment. A modern CMMS sits in front of these three engines and converts them into the same mobile work order experience for technicians, so the field never has to know which scheduling logic triggered the task.

Three Scheduling Engines → One Automated Work Order Pipeline
How time, counters, and condition data converge into field-ready tasks
Engine 1
Time-Based
Calendar interval
Fixed cycles independent of asset usage. SAP scheduling indicators: Time, Time–Key Date, Time–Factory Calendar.
Monthly lubrication, quarterly inspection, annual certification
Engine 2
8462
Counter-Based
Usage / runtime
Triggers tied to operating hours, cycles, or production units logged via measurement documents in SAP.
Every 500 operating hours, every 10,000 cycles, every 1M units
Engine 3
Condition-Based
Sensor threshold
Triggered by measurement points—vibration, temperature, pressure, oil analysis crossing predefined thresholds.
Vibration > 7.1 mm/s, oil particle count above ISO 18/16/13
Central Scheduling Engine
PM Plan + IP30 Deadline Monitoring
SAP PM plan with task list assigned
Lead time + scheduling indicator applied
Order auto-generated on call date
CMMS pushes to mobile technician
Output 1
Mobile Work Order
Pushed to technician's device with task list, parts, photos required
Output 2
Compliance Log
Timestamped completion record auto-archived for audit
Output 3
SAP Confirmation
Hours, parts, and costs posted back to SAP automatically

The biggest wins come from running all three engines in parallel. A spiral mixer might be on a time-based plan for lubrication, a counter-based plan for belt replacement at 2,000 operating hours, and a condition-based plan that triggers if vibration crosses a threshold. SAP PM supports all three. The CMMS makes sure all three end up as a single, prioritized work queue for the technician on shift. Plants ready to map this three-engine model onto their own critical assets can Book a free demo to see the engines running on a sample asset hierarchy.

What Automated Work Order Generation Looks Like

The mechanical promise of SAP PM is that you set up the plan once and the system handles the rest. In practice, what happens after IP30 runs is where most programs lose visibility. Here's what a fully automated cycle looks like—from deadline monitoring at midnight to a closed work order with confirmed hours back in SAP, end of shift.

A Full PM Cycle in 8 Hours, Zero Manual Steps
00:00
IP30 Runs
Deadline monitoring executes overnight against all active maintenance plans. Eligible plans generate maintenance orders within lead-time window.
06:30
CMMS Sync
CMMS pulls new orders from SAP via OData. Orders enriched with task list steps, asset history, photos, and recent inspection findings.
07:00
Auto-Dispatch
Orders auto-assigned by skill match, certification, location, and load. Technician receives mobile alert with full job package before walking to the asset.
10:30
Field Execution
Technician completes checklist on mobile. Photos uploaded. Measurement readings recorded. Parts scanned and consumed from SAP MM in real time.
11:45
Auto-Confirm
Time confirmation, parts goods movement, and order completion post to SAP. Cost center charged. Next call date recalculated. Compliance log archived.

The traditional version of that same cycle—printed orders, clipboard execution, paper sign-off, end-of-week data entry—routinely takes three to five business days and loses 20 to 30 percent of work orders to incomplete confirmations. Plants ready to see the automated cycle running against their own SAP environment can Book a free demo to walk through a live PM automation workflow.

The Schedule Compliance Problem (And the 10% Rule)

Industry consensus has converged on a simple measurement standard: a PM task is considered "on time" if it's completed within 10 percent of its scheduled interval. A monthly PM must close within three days of the due date. A quarterly PM gets a nine-day window. Without this rule, teams chronically defer late tasks until they complete them just before the next cycle starts—technically not missed, but reliability-wise just as risky as never doing them at all.

The 10% Rule: Compliance Tiers Visualized
A PM is "on time" only if completed within 10% of its interval
90%+
World-Class
Proactive maintenance culture, predictable reliability
80–89%
Good
Above-average program, room to optimize scheduling
70–79%
Fair (Industry Avg)
Most plants—measurable breakdown risk emerging
Below 70%
Poor
Significant failure risk, reactive firefighting dominates
Below 85% compliance, expect a measurable rise in breakdown frequency within 60–90 days. Every late PM is compounding risk on the books.

Most maintenance teams overestimate their compliance by 15 to 20 points because they're measuring task closure, not on-time closure. The fastest path to honest measurement—and to actually improving it—is automation: when the system generates the order, dispatches it, and closes it, the timestamp data is real. Teams ready to start measuring true compliance can Sign up free to see actual PM compliance against the 10% rule in real time.

Stop Losing PM Work Orders Between SAP and the Shop Floor
See how automated SAP PM scheduling delivers mobile work orders, captures real completion data, and pushes confirmations back to SAP without a single manual handoff. A live walkthrough on your own asset hierarchy in 30 minutes.

Manual vs Automated: The Side-by-Side That Settles It

The business case for PM automation rarely lives in one big number. It lives in the small frictions that compound across hundreds of work orders every month. The comparison below uses operating data from plants that moved from SAP-PM-only execution to SAP PM connected to an automated CMMS layer.

Manual SAP PM Execution vs. Automated CMMS Pipeline
Swipe to compare
Metric Manual Execution Automated Pipeline Shift
PM schedule compliance 72% 93% +21 pts
Avg. time from order create → tech alert 6–18 hrs < 5 min −99%
Work orders closed same day 43% 88% +45 pts
Incomplete confirmations / month 22–30% < 3% −90%
Planner hours / week on scheduling admin 14–18 hrs 3–4 hrs −75%
Unplanned downtime trend (12-mo) Baseline Down 28–42% Material
3–5× Reactive maintenance cost vs. preventive (lifecycle)
$50B Annual industrial downtime cost (Deloitte)

Expert Perspective: What World-Class PM Programs Do Differently

The plants hitting 90% schedule compliance aren't the ones with the most maintenance plans. They're the ones with the most honest measurement, the cleanest handoff between planner and technician, and the discipline to use all three scheduling engines instead of forcing everything onto a time-based calendar. SAP PM gives you that flexibility on day one. Whether you actually use it comes down to how the work flows after the order is generated. That's where automation earns its keep.

Measure to the 10% Rule, Not to Closure
Counting a "completed" PM that closed three weeks late is self-deception. The 10% rule is the only honest compliance number. Most teams discover they're 15 points lower than they thought.
Match the Engine to the Asset
High-cycle equipment belongs on counter-based plans. Calendar-driven items stay time-based. Critical rotating equipment moves to condition-based. Mismatched scheduling logic is the #1 source of over- and under-maintenance.
Automate the Handoff, Not the Decision
Let SAP and the CMMS handle order generation, dispatch, parts staging, and confirmation. Keep the planner focused on strategy, RCM, and exception handling—not on chasing closures in IW38.

A 60-Day Path to 90% Schedule Compliance

Most plants don't need a multi-year transformation to hit world-class compliance. They need 60 focused days. The roadmap below is what teams actually execute when they move from "we have SAP PM" to "our SAP PM runs itself."

60-Day PM Automation Path
From manual chase to measurable 90% compliance
Days 1–10
Baseline & Audit
Pull current SAP PM plans from IP19/IP24. Measure true compliance against the 10% rule. Categorize each plan by engine type. Identify orphaned plans and duplicates.
Days 11–25
Connect & Mirror
Connect CMMS to SAP PM via OData. Mirror plans, task lists, and equipment hierarchy. Validate IP30 deadline monitoring triggers CMMS sync correctly.
Days 26–45
Pilot Automation
Activate mobile dispatch on one production line or unit. Validate round-trip confirmation. Train technicians and planners. Measure pilot compliance weekly.
Days 46–60
Scale & Optimize
Roll out to remaining lines. Activate condition-based engine on critical assets. Enable real-time compliance dashboards. Quarterly cadence for strategy review.

By day 60, teams executing this roadmap typically see compliance climb from 70-something percent to the high 80s, with the trajectory pointing at the 90 percent benchmark within another quarter. Teams ready to start the baseline audit can Sign up free to begin measuring true compliance against the 10% rule this week.
Make SAP PM Generate Work Orders That Actually Get Done
Your maintenance plans are already in SAP. The next step is putting them on autopilot—real mobile execution, real compliance data, real reliability gains. See it running against your own asset hierarchy.

Frequently Asked Questions

Does automating PM scheduling mean we replace SAP PM?
No. SAP PM remains the system of record for maintenance plans, task lists, equipment master data, and cost postings. Automation happens through a CMMS layer that connects to SAP via standard OData APIs, mirrors the plans, handles mobile execution, and posts confirmations back to SAP. Everything financial, audit-related, and master data continues to live in SAP exactly as it does today.
How is PM schedule compliance actually calculated?
Schedule compliance is the number of preventive maintenance work orders completed on or before their due date, divided by the total number of preventive maintenance tasks scheduled in that period, multiplied by 100. World-class plants apply the 10% rule: a monthly PM must close within three days of due date, a quarterly PM within nine days, an annual PM within 36 days. Only PM tasks count—not reactive or emergency work orders.
When should I use time-based vs counter-based vs condition-based plans?
Use time-based plans for assets where degradation is calendar-driven regardless of use—lubrication, regulatory inspections, certifications. Use counter-based plans for assets where wear is directly proportional to runtime or cycles—gas turbines, conveyor belts, presses. Use condition-based plans for critical rotating equipment where sensor data reveals degradation patterns earlier than a calendar or counter would—pumps, compressors, motors, bearings.
How long until we see measurable compliance improvement?
Pilot units typically show measurable compliance gains within four to six weeks of activating mobile dispatch and automated confirmation. Plant-wide rollouts hitting world-class 90% compliance generally take three to four months from kickoff—not because the technology takes that long, but because culture change and shift-to-shift consistency need time to stabilize. The fastest gains come from removing the manual handoff between order generation and field execution.
What does PM automation realistically cost vs. the ROI?
Industry research from Jones Lang LaSalle shows an average ROI of 545% per dollar spent on preventive maintenance, driven primarily by avoiding the 3-to-5x cost multiplier of reactive maintenance. For a mid-size plant, the cost of a CMMS automation layer is typically recovered through the first 12 months of reduced unplanned downtime alone, with compliance gains, planner productivity, and avoided emergency callouts compounding on top.


Share This Story, Choose Your Platform!