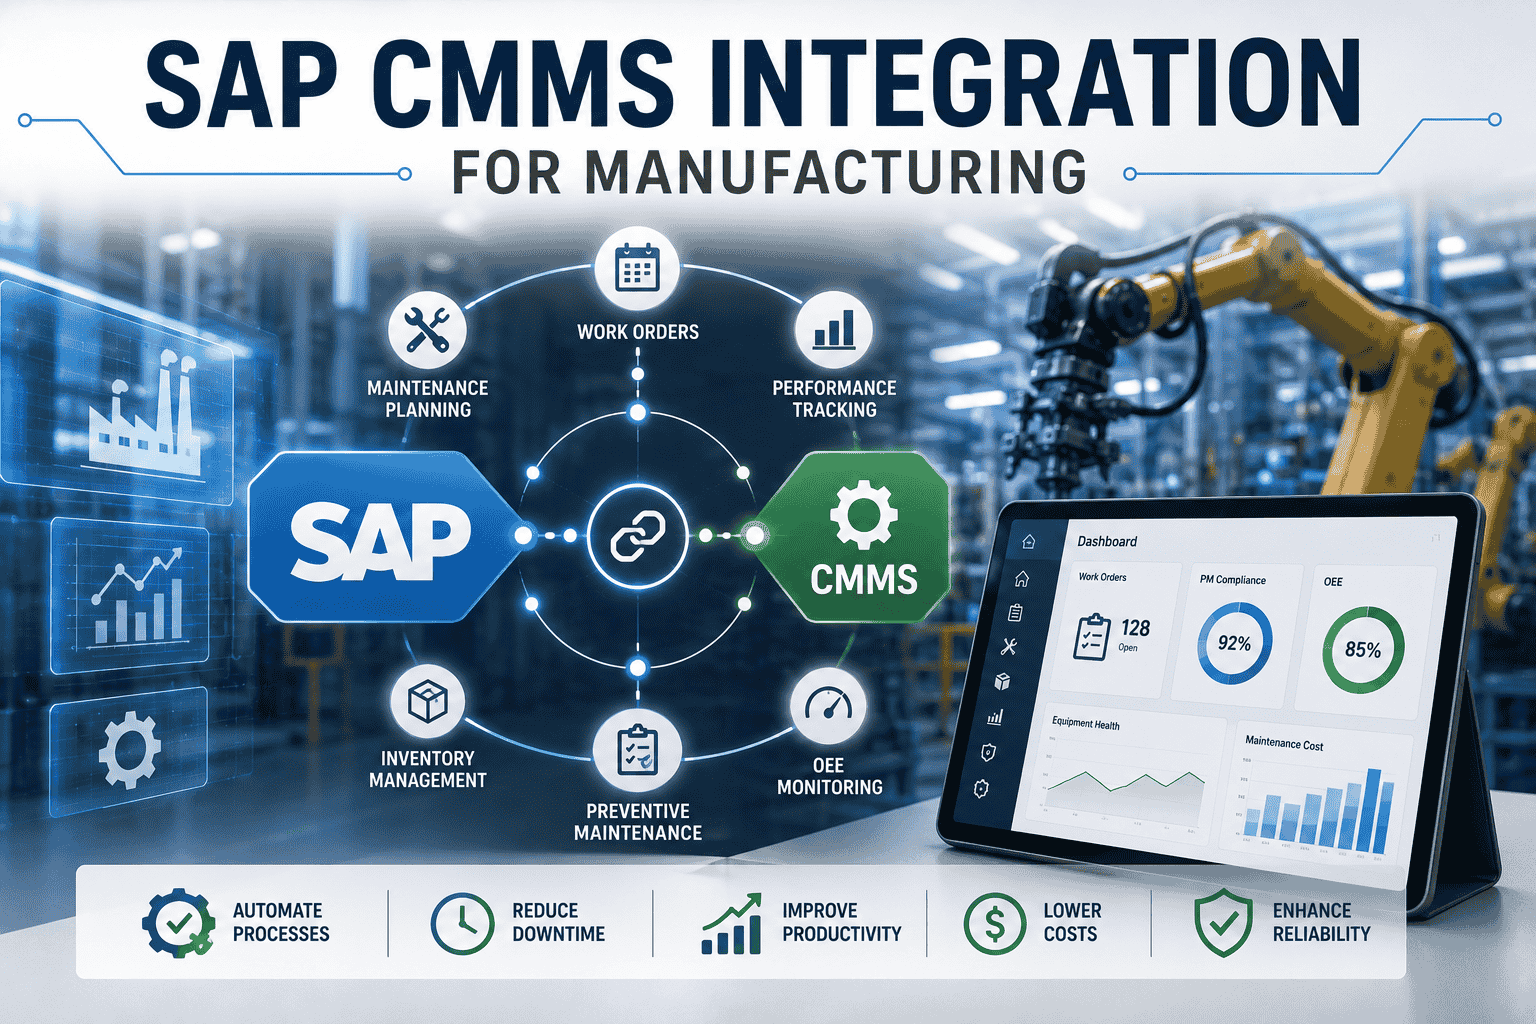
SAP PP and PM Integration for Production and Maintenance Scheduling
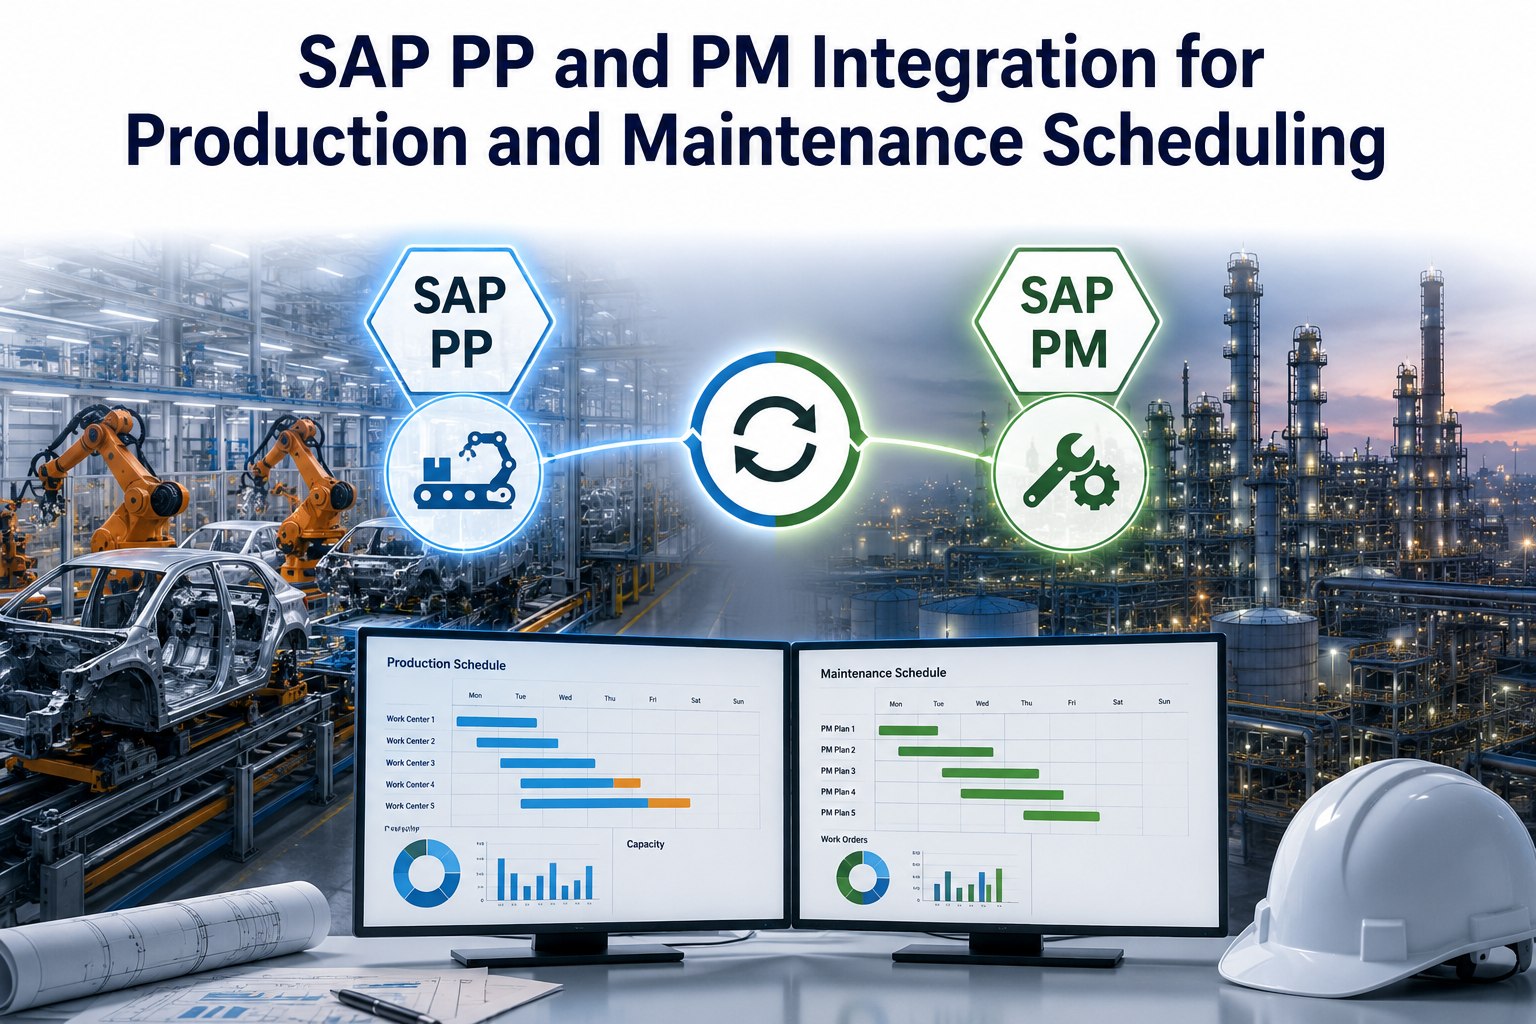
Two schedules govern every plant: production that says "this line runs Tuesday at 6 AM" and maintenance that says "this line needs eight hours of preventive work Tuesday afternoon." When those schedules live in disconnected SAP modules, they collide on the shop floor instead of in the planning office. Production fights maintenance for downtime windows. Best-in-class manufacturers solve this by linking SAP PP and SAP PM at the work-center level, so one calendar reserves the windows maintenance needs. Teams ready to see it working can Book a free demo to walk through aligned PP-PM scheduling.
PP–PM Alignment Benchmarks, 2026
The Numbers That Justify Integration
3.5%
Unplanned downtime at best-in-class manufacturers (vs 12% industry average)
Source: Aberdeen Group
20–40%
Reduction in scheduling conflicts within Q1 of formal PP–PM coordination
Source: Industry research
30%
Downtime reduction with preventive maintenance integrated into production planning
Source: McKinsey
85%+
World-class OEE benchmark for discrete manufacturing (90%+ continuous process)
Source: TeepTrak 2026 benchmark
Why Production and Maintenance Schedules Collide
The mechanics of the conflict are simple. Production planners work in MRP and the production order screen, focused on delivery commitments and capacity. Maintenance planners work in IP30, IW31, and IW38, focused on equipment health and PM compliance. Both touch the same work centers and the same functional locations, but neither sees the other's schedule until the morning of the conflict. Production builds a five-day run for the high-margin product line. Maintenance schedules eight hours of bearing replacement on day three. Nobody discovers the clash until the production supervisor walks past the asset and sees a maintenance crew unbolting the guards.
The cost of this disconnect compounds across every shift. According to Aberdeen Group research, top-quartile manufacturers run at 3.5 percent unplanned downtime versus 12 percent for average performers—a gap that comes down to communication and alignment more than technology or talent. The plants closing that gap aren't doing it through better meetings. They're doing it by making SAP PP and SAP PM literally share the same capacity calendar. Plants ready to start aligning the two schedules can Sign up free to see PP and PM in one unified planning view.
The Real Cost of One Schedule Clash
The economics of a single scheduling conflict are uglier than most plants admit. The breakdown below uses median figures from discrete manufacturing operations running production lines in the $200K–$400K per shift output range.
Anatomy of a Schedule Clash: Where the Money Goes
One avoidable conflict on one production line, one shift
Lost Production Output
4–8 hours of unplanned downtime on a $250K/shift line
$31K–$62K
Overtime Labor
Catching up missed throughput on the next shift, 1.5x rate
Late delivery fees, chargebacks, escalation handling
$3K–$15K
Total Cost of One Clash
From a single avoidable PP–PM scheduling collision
$40K–$91K
Now multiply that across 30 to 80 conflicts per quarter at a typical multi-line plant. The numbers reach seven figures fast—and these aren't catastrophic failures, just routine clashes that an integrated calendar would have prevented in the planning phase. The fix isn't more meetings. It's making the two schedules literally see each other inside SAP.
What Integrated PP–PM Scheduling Looks Like
The visual below is what changes when SAP PP and SAP PM share the same work-center capacity calendar. On the left: a week of siloed planning, where production runs into maintenance conflicts and unplanned breakdowns. On the right: the same week with integrated PP–PM scheduling, where maintenance windows are reserved in capacity calculations before production orders ever get scheduled.
One Week, Two Worlds: Siloed vs Integrated Scheduling
A typical 3-line plant, Monday through Friday
Without Integration
Siloed PP and PM
MonTueWedThuFri
Line A
Production Run
Clash
Production
Line B
Prod
PM
Production
Conflict
Line C
PM
Production
Breakdown
62%Avg Availability
3Conflicts / Week
With Integration
SAP PP + SAP PM Aligned
MonTueWedThuFri
Line A
Production Run
PM
Production Run
Line B
Production
PM
Prod
Line C
PM
Production Run
91%Avg Availability
0Conflicts / Week
Production Order
Planned Maintenance
Scheduling Clash
Unplanned Breakdown
The shift looks subtle but the economic impact is enormous. In the integrated week, every maintenance window is pre-booked into PP capacity calculations through SAP's work center and factory calendar mechanism. Production orders flow around them. There are no clashes because the conflict was resolved 30 days earlier when the maintenance plan generated its order.
Where SAP PP and SAP PM Actually Connect
SAP gives you the integration points natively—most plants just don't use them. The five touchpoints below are where PP and PM either flow together cleanly or hand each other broken data. Getting these right is what separates plants that report 91 percent availability from those stuck at 62 percent.
Five Integration Touchpoints to Configure Correctly
01
Work Center / PRT Linkage
Production work centers must be linked to PM equipment via Production Resource Tools. This is what lets PM downtime show up in PP capacity calculations.
Effect: Maintenance reduces available capacity automatically
02
Shared Factory Calendar
Both modules read from the same factory calendar—working days, shifts, holidays, planned shutdowns. One calendar, two consumers.
Effect: PM windows align with production calendar rules
03
PM Order to PPDS Downtime
SAP PM orders post their planned duration into the PPDS resource downtime tab. The DS board sees maintenance as a hard scheduling constraint.
Effect: Production scheduler can't accidentally book over PM
04
Counter Readings From Production
Operating hours and cycle counts from PP confirmations feed PM measurement documents. Counter-based PM triggers fire on actual usage, not estimates.
Effect: PM intervals match real runtime, not the calendar
05
Status Reporting Loop
Wait, Scheduled-Down, and Maintenance-in-Process statuses sync between PM and the MES/PP layer. The production team sees real-time asset state.
Effect: No surprises when production tries to restart a line
The biggest unlock is touchpoint #3—the PM order to PPDS downtime sync. Plants that get this one right report eliminating 80 to 90 percent of their scheduling conflicts in the first quarter. Teams ready to audit their own touchpoints can Sign up free to map current PP and PM data flows in their plant.
See PP and PM Sharing One Capacity Calendar
Watch how an integrated CMMS layer brings SAP PP production orders and SAP PM maintenance plans into a single, conflict-free schedule. Live walkthrough on your asset hierarchy, 30 minutes.
The financial math on PP–PM integration is unusually clean. You're either preventing scheduling conflicts or absorbing them—there's no middle option. The numbers below come from operating data at discrete manufacturers running multi-line plants in the 200 to 800 employee range after they moved from siloed to integrated planning.
Siloed vs Integrated PP–PM: 12-Month Operating Results
Swipe to compare
Operating Metric
Siloed Planning
Integrated PP–PM
Shift
Unplanned downtime rate
12%
3.5%
−71%
Schedule conflicts per quarter
30–80
2–6
−90%
Overall Equipment Effectiveness
62–72%
85–91%
+15–20 pts
Production schedule adherence
74%
94%
+20 pts
PM compliance rate
71%
93%
+22 pts
Inventory stock levels
Baseline
Down 10–25%
Material
5–20%Labor productivity gain (Deloitte)
5–15%Facility downtime reduction (Deloitte)
For a mid-size discrete plant doing $40M to $80M in annual output, moving from siloed to integrated PP–PM scheduling typically delivers between $1.2M and $3.5M in annualized benefit—roughly split between recovered production hours, lower overtime, reduced inventory carry, and avoided OTIF penalties. Plant managers ready to model their own numbers can Book a free demo to walk through ROI specific to their line configuration.
Expert Perspective: From Two Schedules to One
The plants that solve this don't add a new system. They use what SAP already gives them—the work center linkage, the factory calendar, the PRT mechanism—and they treat the production schedule and the maintenance schedule as two views of the same capacity reality. The cultural shift is bigger than the technical one. When a production planner can see PM windows reserved on the capacity board, the conversation changes from "we need this line" to "we have these windows—let's optimize around them." The arguments stop. The throughput goes up.
Reserve, Don't Negotiate
Maintenance windows belong in capacity calculations before production orders get scheduled—not after. Reserving the window is the only way to avoid the daily fight.
Match Counter Data to Reality
If PM intervals trigger on calendar dates but production runs vary, you're over-maintaining low-use assets and under-maintaining high-use ones. Pipe PP counter readings into PM measurement documents.
Pick One Shared KPI
OEE is the most common shared metric because both teams influence it. When OEE shows up on both production and maintenance dashboards, behavior changes within a quarter.
The 90-Day Path to Integrated Planning
The technical work is straightforward; the cultural work takes a little longer. Plants that execute this roadmap typically see measurable conflict reduction by week six and approach world-class availability by the end of the quarter.
90-Day PP–PM Integration Roadmap
From two schedules to one, by the end of next quarter
Days 1–15
Audit & Map
Inventory work centers, PRT assignments, and active PM plans. Identify which assets are linked correctly between PP and PM. Flag the gaps.
Days 16–35
Configure Touchpoints
Activate PM-to-PPDS downtime sync. Establish shared factory calendar. Wire counter readings from PP confirmations into PM measurement documents.
Days 36–60
Pilot & Validate
Run integrated planning on one production line. Joint weekly planning meeting between PP and PM leadership. Measure conflicts and OEE weekly.
Days 61–90
Scale Plant-Wide
Roll out to all production lines. Activate shared OEE dashboard. Establish quarterly capacity review cadence. Target 90%+ schedule adherence.
Your SAP PP and SAP PM are already paid for. The next step is connecting them to a maintenance execution layer that turns two competing schedules into one shared capacity calendar. See it running on your asset hierarchy.
Do we need SAP PPDS to integrate PP and PM, or can standard PP do it?
Standard SAP PP can handle the core integration through work center capacity, factory calendar sharing, and PRT linkage. PPDS adds the more sophisticated capability of treating PM orders as hard downtime constraints on the detailed scheduling board, which is valuable for complex multi-line plants with tight scheduling tolerances. Most discrete manufacturers start with standard PP integration and add PPDS later if their scheduling complexity warrants it.
What's the difference between siloed and integrated PP–PM planning in practice?
In siloed planning, production planners look at capacity availability without knowing about scheduled maintenance, and maintenance planners look at PM compliance without knowing about production commitments. Conflicts surface on the shop floor. In integrated planning, both modules read from the same capacity calendar—maintenance windows are reserved before production orders get scheduled, so the conflict gets resolved 30 days before it would otherwise happen.
How long does PP–PM integration take to implement?
For a single-plant integration with standard SAP PP and PM, expect 60 to 90 days from kickoff to plant-wide go-live. The technical configuration—work center linkage, factory calendar sharing, PRT setup—typically takes 15 to 30 days. The remainder is pilot validation on one production line, training, and rollout to remaining lines. Plants with PPDS or with non-standard work center configurations may need an additional 30 to 45 days.
Which KPIs should we use to measure PP–PM integration success?
The four most useful are OEE (the shared metric across both teams), schedule adherence (percentage of production orders completed on planned dates), PM compliance using the 10% rule (PM tasks completed within 10% of scheduled interval), and unplanned downtime rate. Best-in-class plants run at 85%+ OEE, 94%+ schedule adherence, 90%+ PM compliance, and below 4% unplanned downtime. Measure all four weekly during the first 90 days.
Does PP–PM integration require replacing our existing SAP setup?
No. PP–PM integration uses native SAP functionality that already exists in both ECC and S/4HANA environments. The technical work is configuration, not customization—linking work centers to PM equipment, activating PRT functionality, syncing factory calendars, and configuring PM-to-PPDS downtime exchange. A modern CMMS layer on top of SAP makes the integration visible to planners and technicians through mobile interfaces and unified dashboards, but the underlying SAP modules stay exactly as they are.