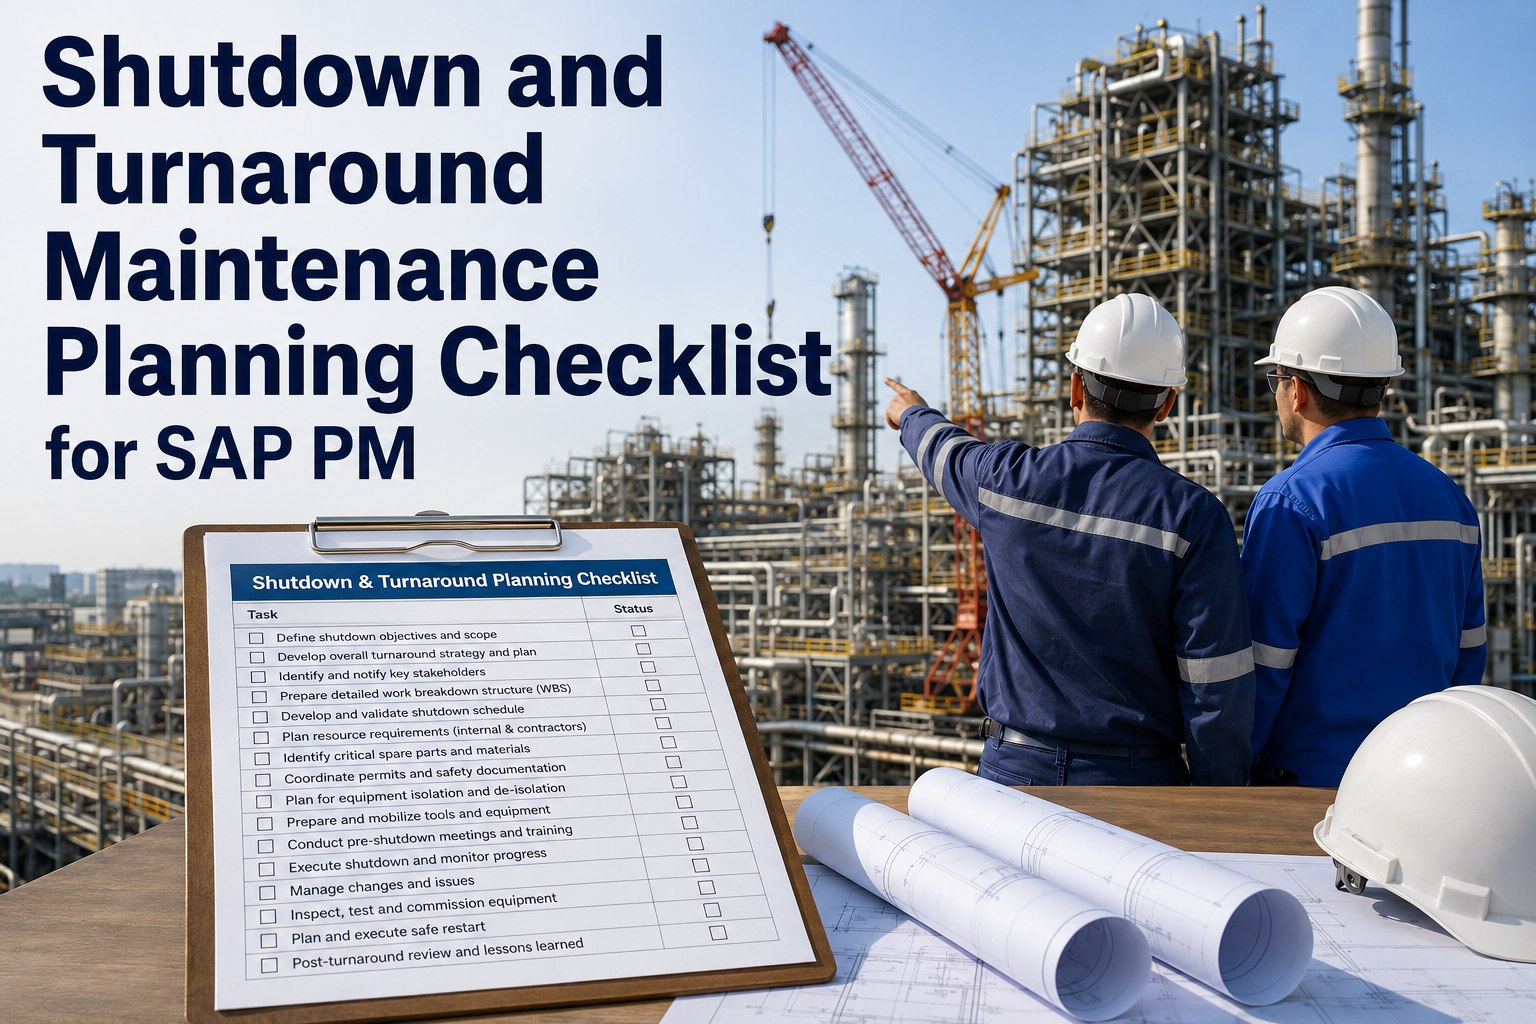
shutdown-turnaround-planning-checklist

Shutdown and Turnaround Maintenance Planning Checklist for SAP PM


Major refinery turnarounds run $50 to $250 million with units offline 30-60 days, and a single day of delay typically costs $1-5M in lost production. The industry data is consistent: more than half run over budget, sixty percent run late. The variable that separates successful turnarounds from disasters isn't execution skill—it's the discipline of pre-TA planning that started 18 months before the shutdown. This 30-item checklist covers what disciplined teams verify across six pre-shutdown phases. Book a free demo to walk through turnaround planning on your facility.

Turnaround Economics & Performance Reality
The Stakes Behind Every Major Shutdown
$50-250M
Typical refinery turnaround cost range, with petrochemical TARs reaching $500M+
Source: Industry TAR benchmarks
50%+
Of major turnarounds run over budget; 60% run late against original schedule
Source: AP Networks / Solomon benchmarks
$1-5M+
Cost of a single day of delay during execution of a major TAR
Source: Lost production calculations
18 mo
Standard pre-TA planning horizon for major refinery and petrochemical turnarounds
Source: TAR planning best practice

Why Turnarounds Live or Die in Planning

Turnaround failure modes are remarkably consistent across industries. The schedule slipped because long-lead parts didn't arrive when needed. The budget blew because scope grew during execution from items that should have been frozen six months earlier. The safety incident happened because the permit-to-work matrix wasn't aligned with the actual work being executed. The restart was delayed because Operations and Maintenance weren't aligned on the shutdown sequence. None of these are execution failures. They're planning failures that surfaced during execution—and execution is the wrong place to fix them, because by then the only options are expensive ones.

The disciplined turnaround organizations treat the 18 months before T+0 as the most consequential window in the entire project. The work is frontloaded into strategic scoping, detailed planning, procurement coordination, and staging discipline. By the time the shutdown moment arrives, the major risks have been retired in advance and the execution team is working a plan that was stress-tested over the previous year and a half. Maintenance and turnaround leaders ready to apply this discipline can Sign up free to begin pre-TA planning audit on the next scheduled shutdown.

The T-Minus Shutdown Planning Checklist

The checklist below is organized as a countdown to the shutdown moment (T+0), with each phase representing one specific window in the pre-TA timeline. The earlier phases set the strategic boundaries; the later phases compress as execution approaches. Work the phases in sequence—skipping or delaying earlier phases collapses later phases into compressed timeframes that produce predictable execution problems.

T-Minus Shutdown Planning · 6 Phases · 30 Items
From strategic scoping through execution and restart
T−18 mo
T−12 mo
T−6 mo
T−3 mo
T−1 mo
T−1 wk
T+0 · SHUTDOWN
Startup
P1
Strategic Scoping
T−18 to T−12 months · 5 items
  • Steering committee chartered & business case approved by leadership
  • Initial scope of work defined by unit, area, and reliability priority
  • Budget envelope established with contingency reserve documented
  • High-level duration target set against historic benchmarks (Solomon, AP Networks)
  • Long-lead procurement items identified (9-18 month lead times catalogued)
P2
Detailed Planning
T−12 to T−6 months · 5 items
  • Work list frozen with risk-ranked scope and explicit sponsor sign-off
  • Detailed task estimates by trade and area developed with crew sizing
  • Critical path schedule built in SAP PM and Primavera with float analysis
  • Contractor scope packages drafted and tendered to qualified vendors
  • Reliability-based scope challenge sessions completed (kill bad scope early)
P3
Procurement & Contractor Mobilization
T−6 to T−3 months · 5 items
  • Long-lead parts on order with verified delivery dates & expediting
  • Contractor contracts awarded with mobilization clauses & KPIs
  • Specialty tooling and rigging plans confirmed with lift studies signed
  • Permit-to-work matrix drafted by area with isolation boundaries
  • Safety orientation programs designed for site & contractor onboarding
P4
Pre-TA Staging
T−3 to T−1 month · 5 items
  • Materials staging in designated lay-down yards with bill-of-material traceability
  • Permits & JSA (Job Safety Analysis) packages compiled per work order
  • Contractor crews credentialed & site-onboarded per safety standard
  • Final scope freeze with formal change control discipline activated
  • Communication plan & daily meeting cadence published to all stakeholders
P5
Final Mobilization
T−1 week to T+0 · 5 items · critical window
  • Crew assignments confirmed shift-by-shift with backup-tech designations
  • Daily execution war room activated with KPI dashboards live
  • Isolation lists verified by Operations, Maintenance, and Safety
  • Backup parts inventory verified on-site with expediting hotline activated
  • Shutdown sequence rehearsed and signed off by Operations leadership
T+0 · SHUTDOWN EVENT
P6
Execution & Restart
T+0 to Startup · 5 items · execution discipline
  • Daily progress vs critical path tracked with float consumption metrics
  • Discovered work logged with change board review & sponsor approval
  • Quality assurance hold points enforced before downstream activity
  • Pre-Startup Safety Review (PSSR) completed with documented sign-off
  • Phased restart sequence executed by Operations with hold-point verification
30
Total Items
6
Sequential Phases
18 mo
Planning Horizon
P5+P6
Highest-Stake Phases

The two highest-stake phases are P5 (Final Mobilization) and P6 (Execution & Restart)—the windows where any earlier-phase failure becomes visible and most expensive to correct. A scope item that wasn't risk-ranked in P2 surfaces in P6 as discovered work with a million-dollar change order. A long-lead part that wasn't expedited in P3 surfaces in P5 as a critical path delay. The discipline of executing each phase fully and on time is what prevents the cascading failures that produce the schedule slippage and cost overrun the industry consistently reports. TAR planning leaders ready to operationalize this checklist on a current shutdown can Sign up free to track phase-by-phase completion on a live turnaround.

Three Planning Gaps That Cost Turnarounds Millions

Three planning failure modes account for the majority of TAR cost overruns and schedule slippages. Each is preventable through disciplined execution of the checklist phases—and expensive only because they're typically caught during execution rather than during planning.

Three Planning Gaps That Drive TAR Cost & Schedule Failures
Gap 1
Scope Creep During Execution
Scope items added or expanded after T-1 month freeze, typically during execution as discovered work or scope additions that "we should also do while we're in there." Typical impact: 15-30% budget overrun and 1-3 weeks of schedule slippage on a major refinery TAR.
Prevented By
P2 items 1-2 (scope freeze with risk ranking) and P4 item 4 (final scope freeze with change control discipline) executed and signed off
Gap 2
Long-Lead Material Slippage
Specialty alloys, custom vessels, and long-lead spares delivered late or to wrong specification. Typical impact: critical path activities delayed, cascade through dependent work, total schedule slip of 1-2 weeks per material-late event.
Prevented By
P1 item 5 (long-lead identification 18 months out) and P3 item 1 (orders placed with verified delivery and expediting) executed with discipline
Gap 3
Permit & Isolation Misalignment
Permit-to-work matrices that don't match actual scope, isolation lists with errors, or JSA packages that don't cover the work being executed. Typical impact: safety incidents, stop-work orders, and remediation activities that can cost $500K-$2M per incident.
Prevented By
P3 item 4 (permit matrix by area) and P4 item 2 (JSA packages per work order) and P5 item 3 (isolation verification) all completed

The unifying pattern across all three gaps: each is the consequence of an earlier-phase item that wasn't completed fully or wasn't signed off rigorously. The cost of an item slipping is exponentially higher each phase it carries unaddressed. The checklist exists specifically to enforce phase-gate discipline that prevents this compounding. TAR managers ready to assess current planning completeness can Sign up free to run a phase-gate diagnostic on the current planning state.

See Phase-Gate Turnaround Planning on a Live TAR
Walk through phase-by-phase planning execution on an actual refinery or petrochemical turnaround with all 30 items tracked, owners assigned, and phase-gate sign-offs documented. 30-minute walkthrough.

From Planning to Execution: The Final 30 Days

The final 30 days before T+0 is the highest-tension window in the entire turnaround project. Every gap from earlier phases becomes either resolved or carried into execution as risk. The cadence below is what disciplined organizations follow in the final pre-shutdown weeks.

Final 30-Day Pre-Shutdown Cadence
The compressed window where planning becomes execution-ready
Days T−30 to T−21
Scope Lock & Material Verification
Final scope freeze enforced. All materials verified on-site or with confirmed delivery. Late-arriving items escalated to executive level with documented mitigation.
Days T−20 to T−11
Permit & Crew Onboarding
JSA packages finalized per work order. Contractor crews credentialed, oriented, and assigned. Permit-to-work systems tested with sample work orders.
Days T−10 to T−4
Rehearsal & Verification
Shutdown sequence rehearsed with Operations leadership. Isolation walks completed area-by-area. War room and KPI dashboards validated.
Days T−3 to T+0
Mobilization & Cutover
Final readiness review. All Critical items signed. Shutdown sequence executed per plan. Execution war room operates 24/7 from T+0.

By T+0, every item on the 30-item checklist has either been completed and signed off, or has been formally accepted as a managed risk with documented mitigation. That documentation is what separates a turnaround that executes cleanly from one that produces the cost overruns and schedule slippages the industry chronically reports. TAR leaders ready to walk this final cadence on their own shutdown timeline can Book a free demo to map the final-30-day cadence to current TAR dates.

Expert Perspective: What Distinguishes Predictable Turnarounds

The turnarounds I've seen execute predictably share a property that often surprises new TAR managers: they treat phase-gate discipline as inviolable. Each phase has explicit completion criteria, an accountable owner, and a sign-off that means something. Phase 2 doesn't start before Phase 1 closes. Phase 4 doesn't relax the freeze established in Phase 2. Scope additions in Phase 5 require executive sponsor approval with documented business case—not "well, while we're in there" justification. The turnarounds that overrun on cost and schedule almost always trace to a phase that closed without genuine completion—items deferred to a later phase, scope freezes held loosely, sign-offs given without underlying evidence. The discipline isn't sexy. It's not innovative. It's just the patient enforcement of phase-gate criteria over an 18-month planning horizon, and it's what separates predictable turnarounds from career-ending ones.
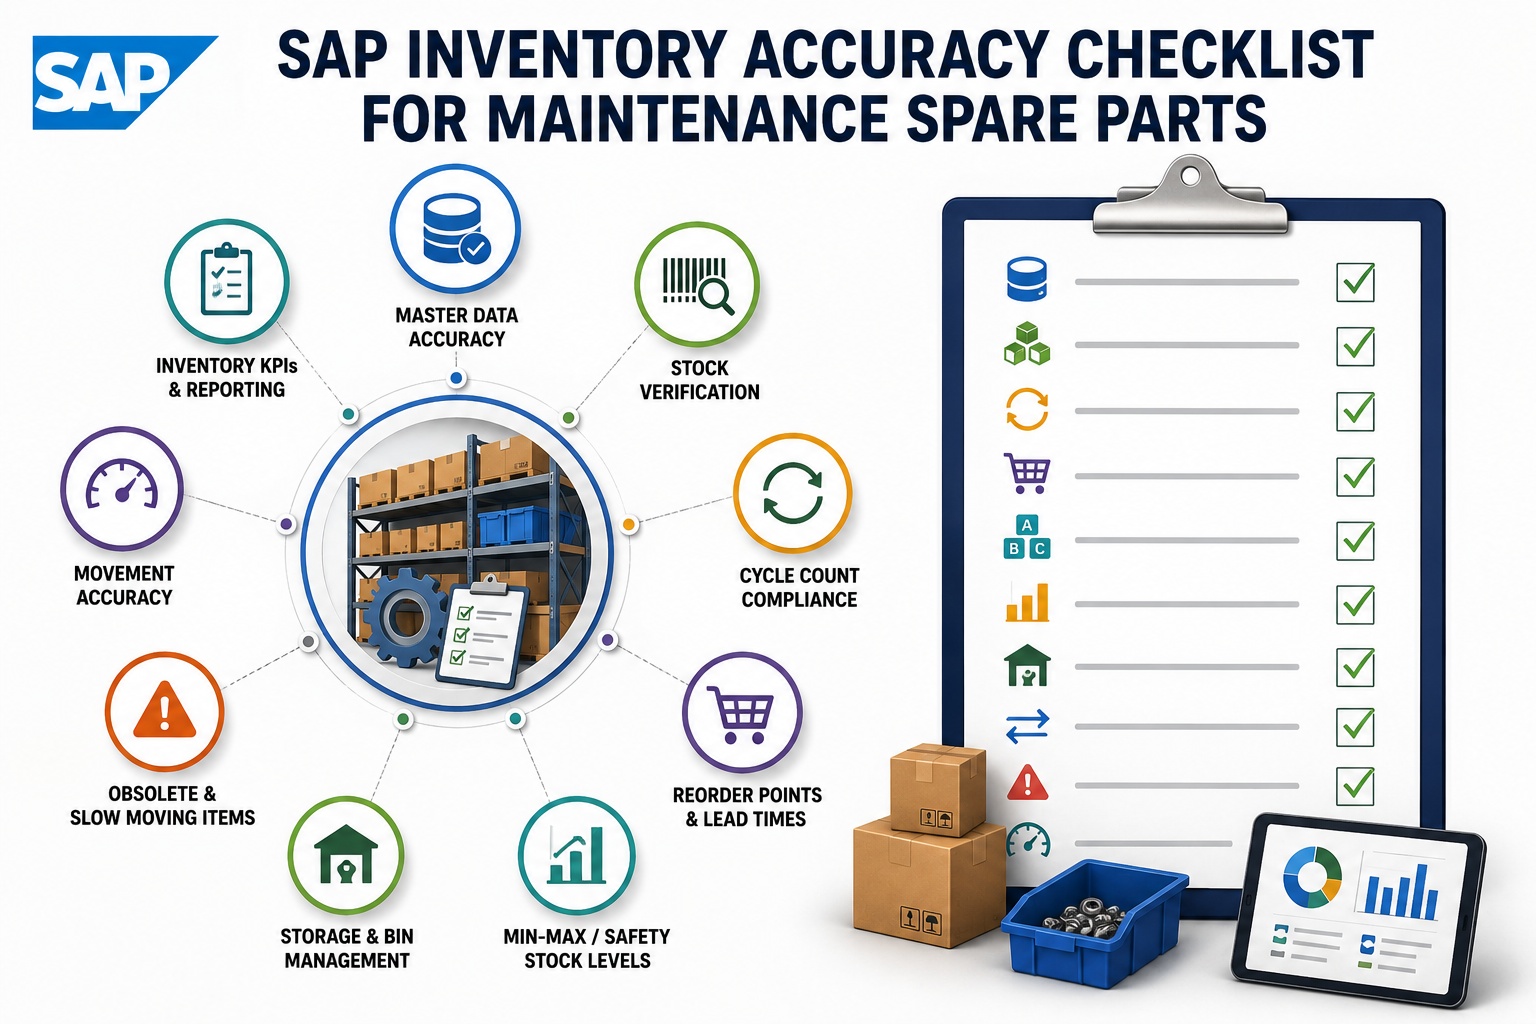

Phase Gates Are Inviolable
Each phase has explicit completion criteria. Phase 2 doesn't start until Phase 1 closes with sign-off from named owners. Skipping or partially completing phases is how predictable failures begin.
Scope Freezes Mean Freeze
The Phase 2 scope freeze and the Phase 4 final freeze are governance events, not procedural formalities. Scope additions after freeze require executive sponsor approval with documented business case.
Kill Bad Scope Early
Reliability-based scope challenge sessions in Phase 2 retire 15-25% of initial work list items that don't pass cost-benefit review. Killing scope early prevents it from consuming budget and schedule during execution.
Make Your Next Turnaround the One That Came in On Plan
Six phases. Thirty items. Phase-gate discipline that holds across 18 months of planning. See the framework running on a live refinery or petrochemical turnaround.

Frequently Asked Questions

When should planning actually start for a major turnaround?
The industry-standard answer is 18 to 24 months before the planned shutdown date for major refinery and petrochemical TARs. For mid-size turnarounds (8-21 day durations on smaller units), 12 months is typically adequate. For minor shutdowns under a week, 4-6 months can work. The principle: the planning horizon should accommodate the longest-lead procurement item plus a meaningful buffer. If a specialty alloy vessel has an 18-month lead time, the planning has to start 18 months before T+0—anything shorter forces compromises that surface as execution problems.
What's the right way to handle scope additions during execution?
A disciplined change control process treats execution-phase scope additions as governance decisions, not operational accommodations. Each proposed addition is documented with cost estimate, schedule impact, and business case. A change board (typically including TAR manager, operations representative, and sponsor) approves or rejects. Approved additions are added to the schedule with explicit float consumption. The mistake to avoid: accepting scope additions informally because "we're already here." That pattern produces the cost and schedule overruns the industry chronically reports.
How does SAP PM support turnaround planning specifically?
SAP PM provides the work order, notification, and equipment master infrastructure that anchors TAR planning to the broader maintenance program. Work orders for TAR scope link to the same equipment masters and cost centers as routine maintenance, enabling cost comparability and reliability trending across shutdowns. Integration with Primavera or other schedule tools handles the critical path scheduling that SAP PM doesn't do natively. The combination—SAP PM for asset linkage and cost management, Primavera for schedule, CMMS for mobile execution—is the standard architecture for major TAR programs.
What KPIs should we track during turnaround execution?
The headline KPIs are schedule performance index (planned vs actual progress on critical path), cost performance index (planned vs actual spend), and safety performance (recordable incidents per million hours). Secondary KPIs include discovered work as a percentage of planned scope (target: under 10 percent), permit-to-work compliance (target: 100 percent of work orders with valid permit), and contractor productivity benchmarks. The strongest single indicator of TAR health is critical path float consumption rate—if float is being consumed faster than calendar time is passing, the project is slipping and corrective action is required.
How do we conduct an effective post-TA review?
A disciplined post-TA review is conducted within 30-45 days of restart, while memories are fresh and key participants are available. The review covers what worked, what didn't, what we'd do differently, and quantitative outcomes against plan. Each finding is documented with corrective action, owner, and target completion. The findings feed forward into the next TAR cycle—the 18-month planning for the next shutdown should reference and address the prior shutdown's documented findings. Without this feedback loop, the same issues recur across multiple TAR cycles, which is the pattern documented in industry benchmarks of underperforming TAR programs.


Share This Story, Choose Your Platform!