Top SAP PM Reports Every Maintenance Manager Should Use
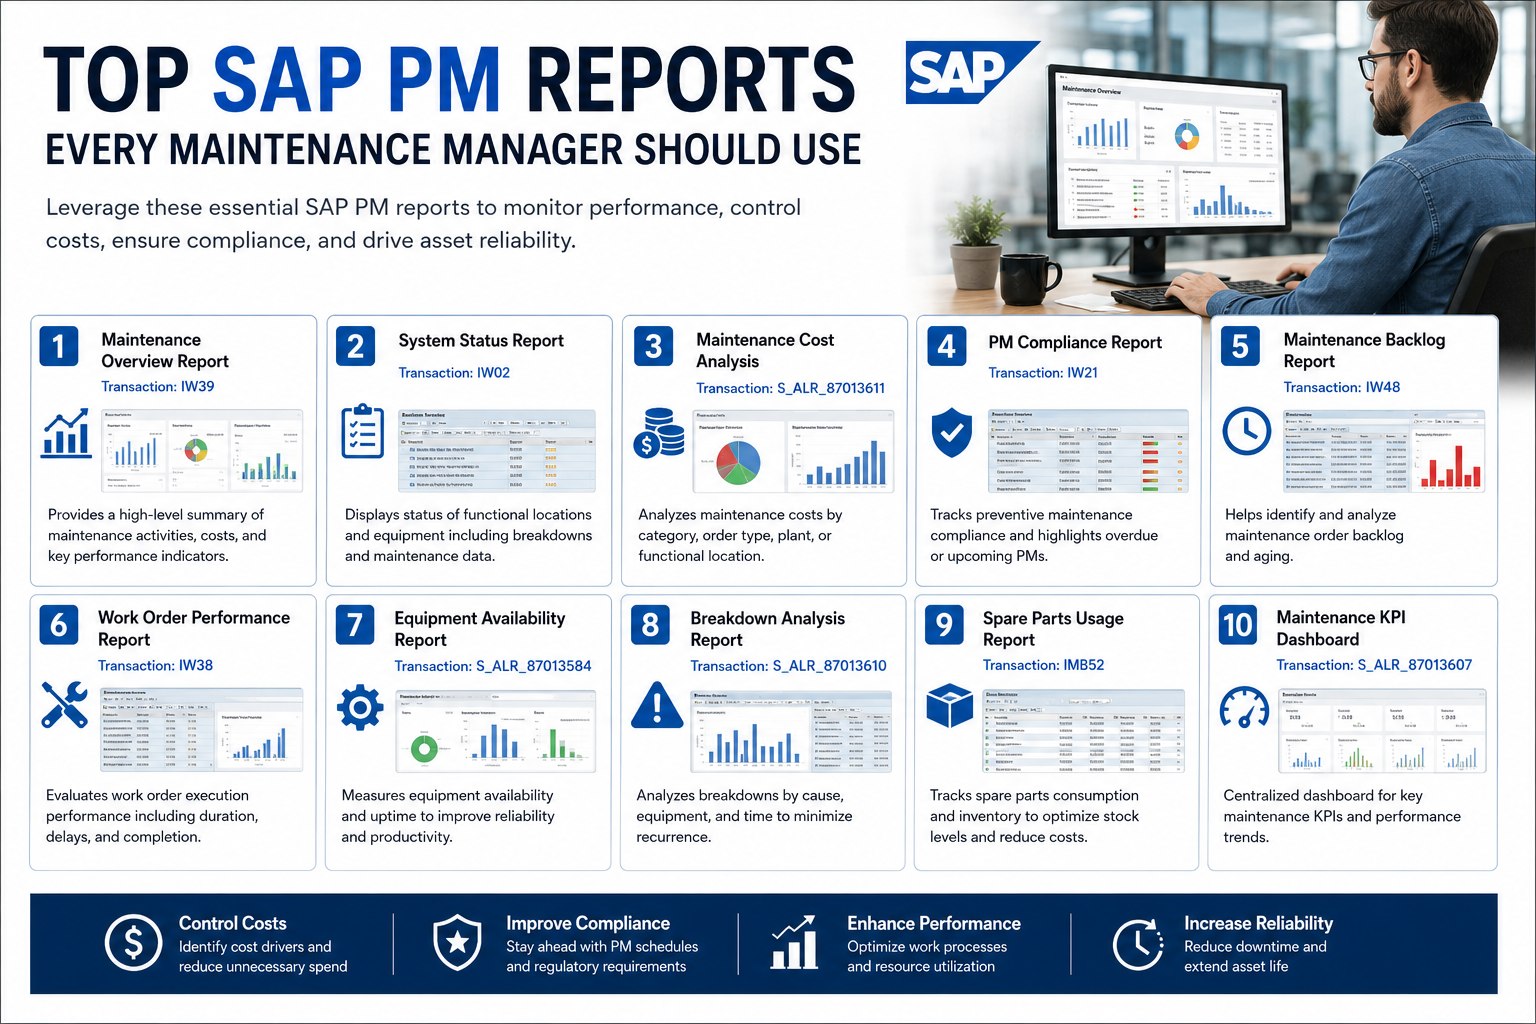
Most SAP PM users run the same three or four reports every week and never explore the rest. That's a problem because SAP's plant maintenance module ships with 30+ standard reports, and the difference between top-quartile and bottom-quartile maintenance organizations often comes down to which reports they actually use. The eight reports below cover work order operations, PM compliance, cost analysis, downtime tracking, reliability metrics, and condition monitoring. Run them on the cadence they're designed for and your maintenance reporting transforms. Book a free demo to see real-time alternatives.
SAP PM REPORTING REALITY
The Eight Reports That Distinguish Top Maintenance Organizations
30+
Standard SAP PM Reports
8
Essential for Excellence
3
Daily / Weekly / Monthly
100%
Already in Your SAP License
Why SAP PM Reports Matter More Than Most Managers Realize
SAP PM ships with one of the most complete maintenance reporting toolsets in any enterprise system, but the typical maintenance organization uses less than a quarter of what's available. Planners run IW39 to check open work orders. Maintenance managers occasionally pull a cost report. Reliability engineers might dig into MCI8 once a quarter. The rest of the reporting catalog sits dormant—and the operational visibility it would provide stays invisible.
The top-quartile maintenance operations don't have better reports than everyone else—they have the same SAP PM reports, run consistently on the right cadence, with the data piped into decisions. Maintenance leaders ready to operationalize their reporting can Sign up free to map current reporting against best-practice cadence.
The Maintenance Manager's Essential SAP PM Reports Dashboard
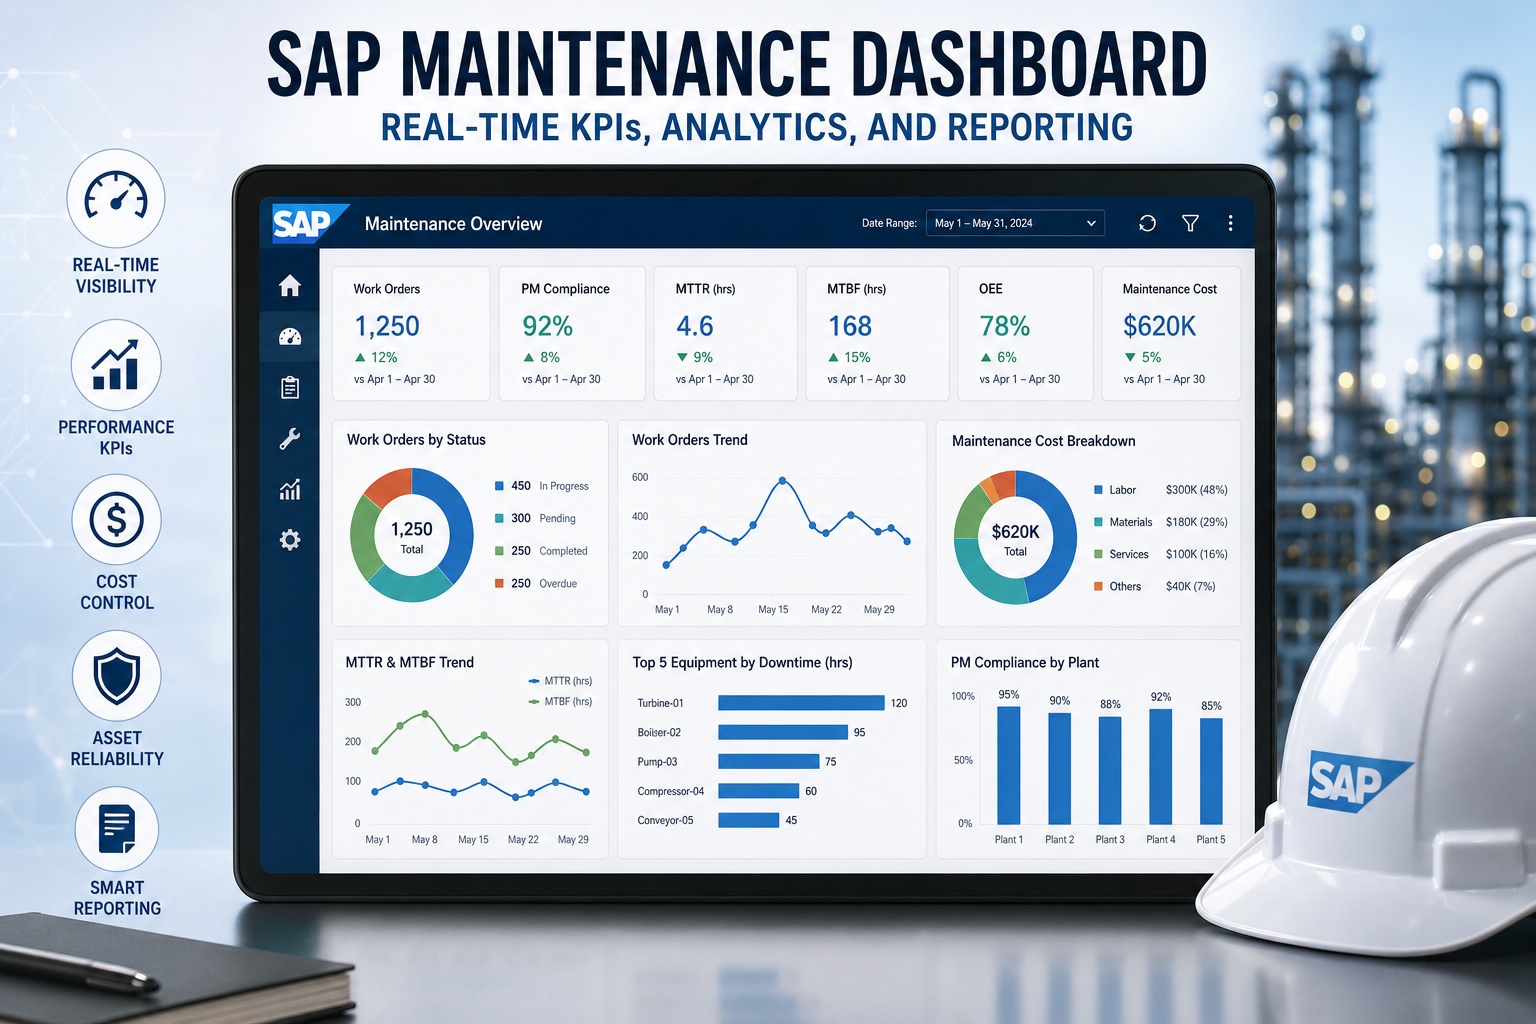
The dashboard below shows the eight SAP PM reports every maintenance manager should know, with the transaction code, recommended cadence, and what each report actually visualizes. Together they cover the operational, compliance, financial, and reliability dimensions of the maintenance function.
8 REPORTS · 3 CADENCES · 1 DASHBOARD
SAP PM Reports Maintenance Managers Should Run
IW39DAILY
Work Order List Display
Current-state view of all work orders with full filtering. The everyday workhorse for planners and supervisors.
ANCHOR · MOST-USED
IW69DAILY
Notification List Display
Active and historical notifications grouped by type, priority, and damage code. Issue-tracking foundation.
OPERATIONS
IP24WEEKLY
PM Scheduling Overview
Maintenance plans, schedule compliance, due dates, and overdue items. PM discipline starts here.
COMPLIANCE
IH06WEEKLY
Functional Location Structure
Asset hierarchy, equipment grouping, and functional location tree. The structural map of your facility.
STRUCTURE
MCI3MONTHLY
Cost Analysis Report
Maintenance cost by cost center, work type, and period. Budget vs actual variance over time.
FINANCIAL
MCI7MONTHLY
Equipment Downtime Analysis
Equipment downtime hours, availability percentages, and trend lines. The reliability scoreboard.
RELIABILITY
MCI8MONTHLY
MTBF / MTTR Analysis
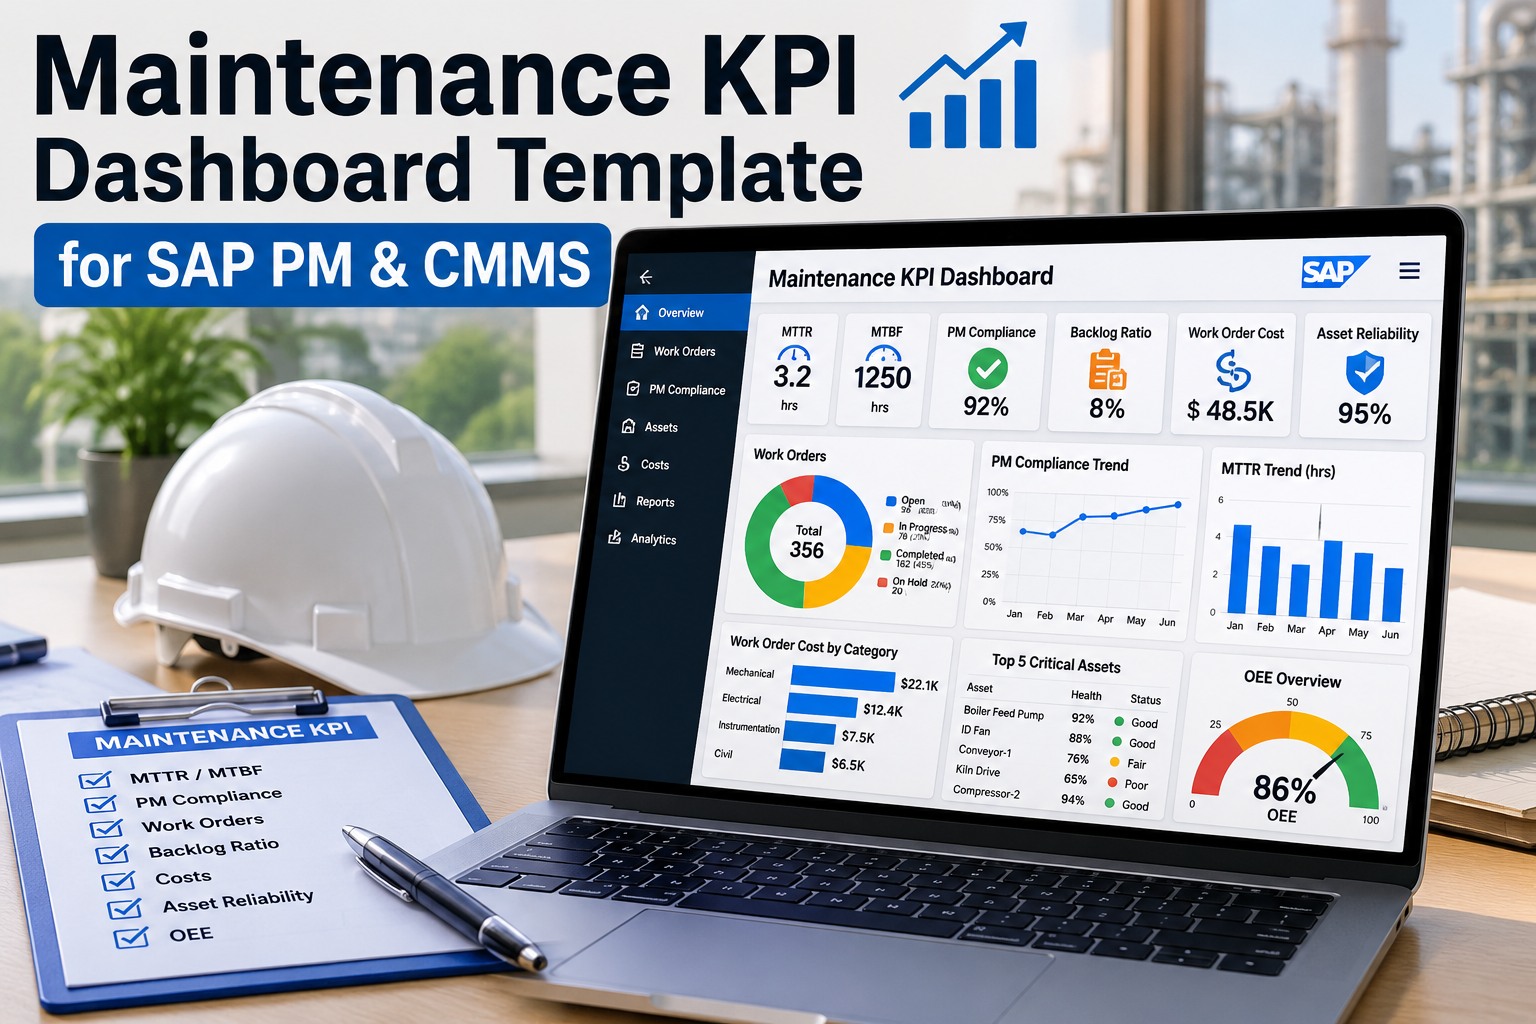
Mean time between failures and mean time to repair by equipment. Reliability KPIs that drive RCM.
RELIABILITY
IK17WEEKLY
Measuring Points & Counters
Condition monitoring data, threshold readings, sensor values. The bridge to predictive maintenance.
CONDITION
3Daily Reports
3Weekly Reports
3Monthly Reports
IW39Most-Used Anchor
The cards above are organized to be scanned visually, but each report rewards deeper exploration. IW39's filtering options alone produce dozens of useful views. MCI8 segmented by equipment criticality reveals reliability patterns that aggregate views hide. Maintenance leaders ready to systematically operationalize all eight reports can Sign up free to build your standardized reporting cadence.
How to Build Your Maintenance Reporting Cadence
Running reports on the right cadence transforms them from occasional checks into operational discipline. The three-tier cadence below maps the eight essential reports to the rhythm of maintenance management work.
DAILY
Operations Rhythm
IW39
Work Order List
IW69
Notification List
Run at start-of-shift for operational visibility. Filter by plant, equipment, or status.
WEEKLY
Planning Rhythm
IP24
PM Schedule
IH06
Functional Location
IK17
Measuring Points
Review during weekly planning meeting. Address scheduling gaps and condition trends.
MONTHLY
Strategic Rhythm
MCI3
Cost Analysis
MCI7
Downtime Analysis
MCI8
MTBF / MTTR
Review with leadership for strategic decisions on reliability investments and budget.
SEE IT IN PRACTICE
Watch the Reports Come Alive as Real-Time Dashboards
30-minute walkthrough showing how SAP PM report data flows into live dashboards updated automatically as work happens in the field.
What SAP PM Reports Miss (and How Integration Fills the Gaps)
The eight reports above are essential, but they share four structural limitations that no amount of skilled SAP usage can overcome. Understanding these limitations is what separates organizations that complement SAP PM reports with real-time CMMS dashboards from those that struggle to extract operational value.
Snapshot-Only Data
Reports show the state at the moment you ran them. By the time you read the output, the floor has already moved on.
Manual Execution Required
Someone has to remember to run each report on schedule. Skipped reports mean blind spots in operational visibility.
Limited Mobile Access
SAP GUI on a tablet isn't a mobile experience. Field supervisors can't access reports where they actually need them.
Disconnected From Execution
Reports show what was recorded, not what's happening. Real-time field data lives outside SAP's reporting reach.
The structural answer isn't replacing SAP PM reports—it's connecting them to a real-time CMMS layer that feeds the same data continuously. Reports remain valuable for historical analysis and compliance; real-time dashboards provide the moment-to-moment visibility reports can't. Leaders ready to see this complementary architecture can Sign up free to architect real-time dashboards alongside SAP PM reports.
From Static Reports to Real-Time Dashboards
The performance gap between traditional SAP PM reporting and integrated real-time dashboards shows up across every dimension that matters for maintenance decision quality.
SAP REPORTS ALONE vs INTEGRATED REAL-TIME DASHBOARDS
Maintenance Visibility Performance Delta
Data Freshness
Hours-old
Real-time
Live
Mobile Accessibility
Desktop only
iOS / Android
Field
Custom View Capacity
Limited
Unlimited
+150%
Drill-Down Interaction
Static
Interactive
3x
Field Data Integration
None direct
Bidirectional
Native
Both
SAP reports for compliance; real-time dashboards for daily operations
Same Data
Integrated CMMS uses same SAP PM data, just presented for action
The answer isn't choosing between SAP PM reports and real-time dashboards—it's running both as complementary tools serving different decision rhythms. Reports anchor compliance, audit, and strategic review. Real-time dashboards drive daily operations. Maintenance leaders ready to deploy the complementary architecture can Book a free demo to see complementary architecture in action.
Expert Perspective on Modern Maintenance Reporting
"
The maintenance managers I've watched build genuinely high-performing operations share a property that contradicts what most reporting consultants advise: they don't try to consolidate everything into one tool. They run SAP PM reports for the things SAP PM does best—standardized financial reporting, compliance documentation, audit trails, multi-year historical analysis. And they run real-time CMMS dashboards for the things real-time tools do best—daily operational visibility, mobile field access, instant drill-down, current-moment decisions. Trying to make SAP PM do real-time dashboards or trying to make CMMS dashboards do five-year audit history both fail. The architecture wins when each tool does what it was designed for.
01
Reports and Dashboards Are Complementary
SAP PM reports handle compliance, audit, financial reporting, and historical analysis. Real-time dashboards handle daily operations, mobile access, and current-moment decisions.
02
Cadence Discipline Beats Tool Choice
A maintenance team running 5 reports on disciplined cadence outperforms a team with access to 30 reports run sporadically. The cadence is the discipline.
03
Data Integration Is the Multiplier
When the same SAP PM data flows into both compliance reports and operational dashboards, the data quality lift compounds across both surfaces simultaneously.
BUILD THE ARCHITECTURE
Run SAP PM Reports With Real-Time Dashboards Alongside
Eight essential reports for compliance and audit. Real-time dashboards for daily operations. Same SAP data, different decision rhythms. See it running.
How often should each SAP PM report actually be run?
The cadence reflects the decision rhythm each report serves. Daily reports (IW39, IW69) drive operational decisions during morning huddles and shift handovers—run them at start-of-shift. Weekly reports (IP24, IH06, IK17) drive planning meetings—run them the day before your weekly review. Monthly reports (MCI3, MCI7, MCI8) drive strategic and financial review—run them at month-end close. The reports lose value when run more often than their decision rhythm requires; they lose meaning when run less often.
What's the difference between IW39 and IW28?
IW39 displays work order lists with extensive filtering and is the primary operational report for planners and supervisors—it shows what's currently happening in the work order universe. IW28 displays notification lists with focus on tracking issues and damage codes—it answers "what's broken" rather than "what's being worked on." Mature reporting cadences use both: IW28 daily to see new notifications, IW39 daily to see how those notifications translated into work orders. Together they show the full demand-to-execution flow.
Can SAP PM reports be customized without consultants?
The standard reports listed have extensive built-in customization through layout variants, selection screens, and filtering options that any SAP PM user can configure. Saving variants for regular use takes 5-10 minutes per report. Customization beyond that—custom fields, calculated metrics, joined data from other modules—generally requires ABAP development or SAP Query (SQ01/SQ02) skills, which means either training a power user or engaging consulting help. For most maintenance teams, mastering layout variants on the standard reports covers 80%+ of customization needs.
How do we make SAP PM reports accessible on mobile?
SAP Fiori provides limited mobile access to a subset of PM reports through browser-based responsive design, but the experience falls short of true mobile-first design—no offline mode, limited drill-down, and slow on older devices. The practical answer for field-accessible reporting is an integrated CMMS that pulls the same underlying SAP PM data and presents it through native iOS/Android apps with offline capability. The reports stay as the system of record; the mobile dashboards are the access layer.
Should we replace SAP PM reports with custom dashboards entirely?
No. SAP PM reports remain essential for compliance documentation, financial audit, multi-year historical analysis, and integration with enterprise reporting systems. Custom dashboards excel at daily operations and current-state visibility but typically lack the audit-grade documentation and historical depth that compliance and finance require. The high-performing architecture runs both: SAP PM reports for compliance and audit; real-time CMMS dashboards for operations. Same data flowing into both surfaces serves different decision rhythms simultaneously.