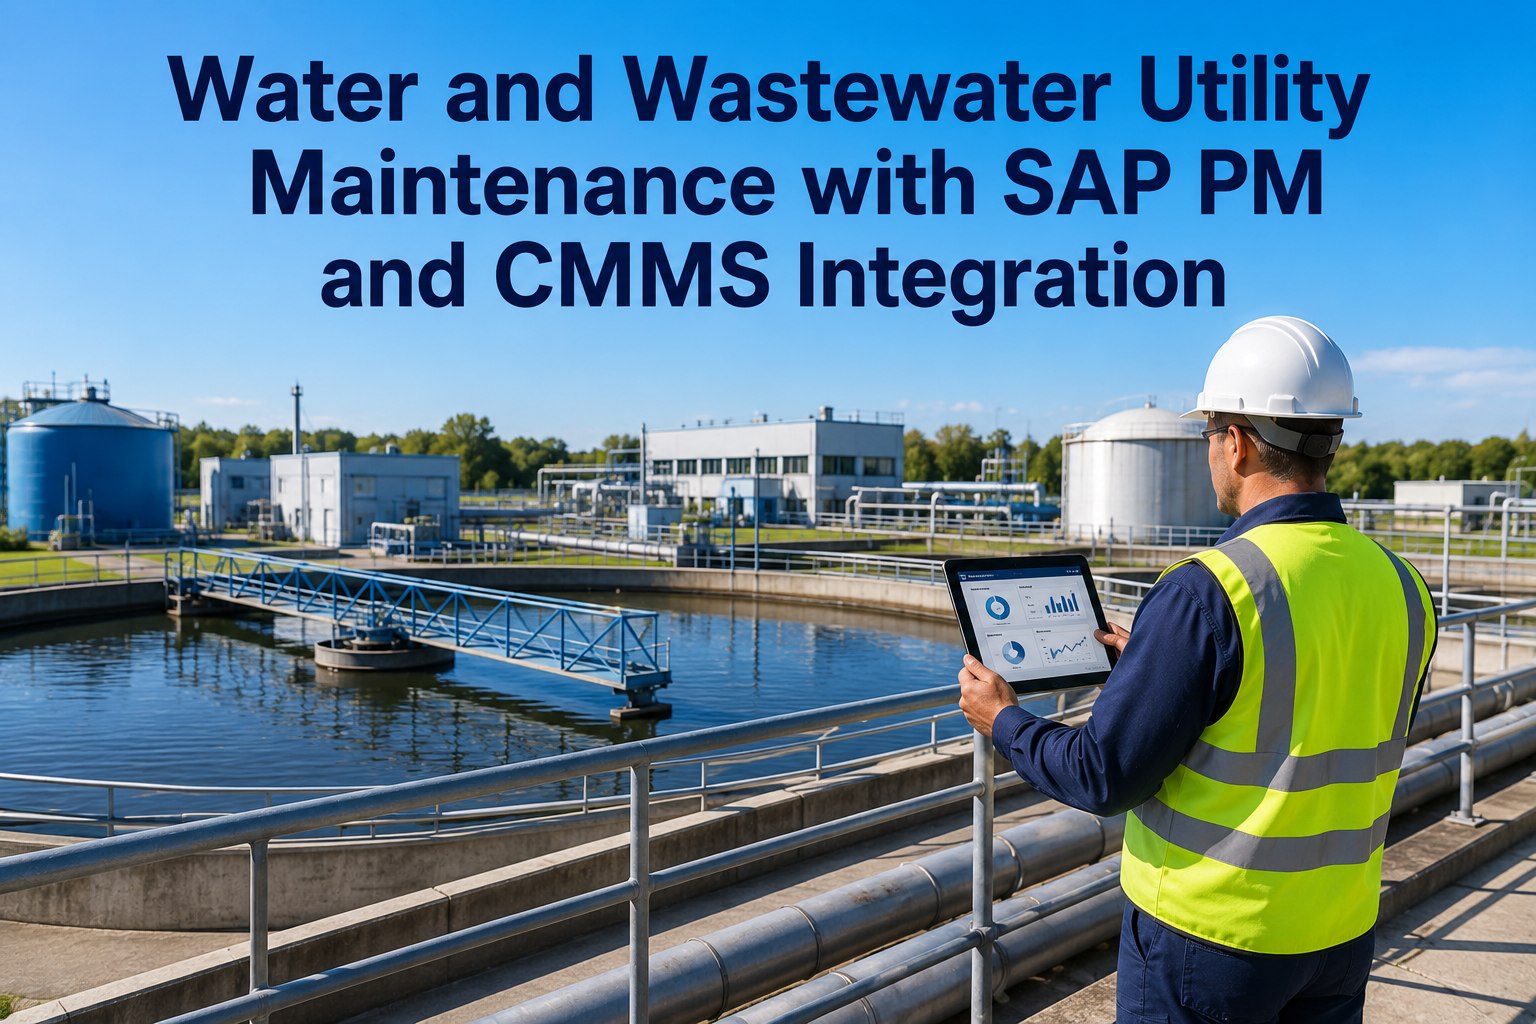
Water and Wastewater Utility Maintenance with SAP PM and CMMS Integration
American water utilities collectively need over $625 billion in infrastructure investment over the next 20 years. The assets producing that requirement are aging, distributed, and bound by regulations that compound the cost of any maintenance failure. A single Safe Drinking Water Act violation can cost six figures in fines and seven figures in remediation. A Clean Water Act violation at a wastewater plant can run higher. Integrated SAP PM and CMMS operations turn that compliance pressure into structured maintenance discipline that documents itself. Book a free demo to walk through water utility maintenance integration.
U.S. Water & Wastewater Infrastructure, 2025-2026
The Scale of Maintenance Required Across U.S. Water Systems
$625B+
EPA 7th DWINSA estimate of drinking-water infrastructure investment needed over 20 years
Source: EPA Drinking Water Needs Assessment
$422.9B
Of that need is distribution and transmission—aging pipe replacement and rehabilitation
Source: EPA 7th DWINSA
9.2M
Lead service lines identified across U.S. drinking water systems requiring replacement
Source: EPA 2023 finding
70%+
Of inspected water systems violate SDWA Risk and Resilience Assessment requirements (Sept 2023+)
Source: EPA inspections
The Scale of Water Utility Maintenance
U.S. water and wastewater utilities collectively operate over 50,000 community water systems and 16,000 wastewater treatment plants—an asset base whose median age exceeds 50 years and includes pipes in major cities that are over a century old. The maintenance organization sitting on top of that asset base has to coordinate distributed work across treatment plants, pump stations, distribution mains, collection systems, lift stations, and downstream treatment facilities, all while meeting SDWA, Clean Water Act, NPDES, and Lead and Copper Rule requirements that each carry their own documentation and reporting obligations.
The integration challenge is fundamentally different from a single-site industrial facility. A refinery has its assets within a fence line. A utility has assets distributed across hundreds or thousands of square miles, with PM cycles that have to flex around weather, source water variability, seasonal demand, and regulatory inspection windows. This is the operating environment where SAP PM and CMMS integration moves from useful to essential—because the alternative is paper records and spreadsheets that don't survive regulatory scrutiny. Water utility maintenance and reliability leaders ready to scope this integration on their system can Sign up free to begin a utility asset and integration audit.
How SAP PM + CMMS Solves the Utility's Unique Challenges
Water utilities present three integration challenges that don't exist for single-site industrial operations. First, the asset hierarchy spans multiple functional locations across geographically distributed facilities, with different regulatory regimes per facility type. Second, the compliance documentation requirements vary by asset class—SDWA reporting differs from CWA reporting differs from NPDES permit conditions. Third, the work order initiator is often a SCADA alarm or regulatory inspection finding rather than a planner-generated PM, requiring tight integration between operational technology and the maintenance management layer.
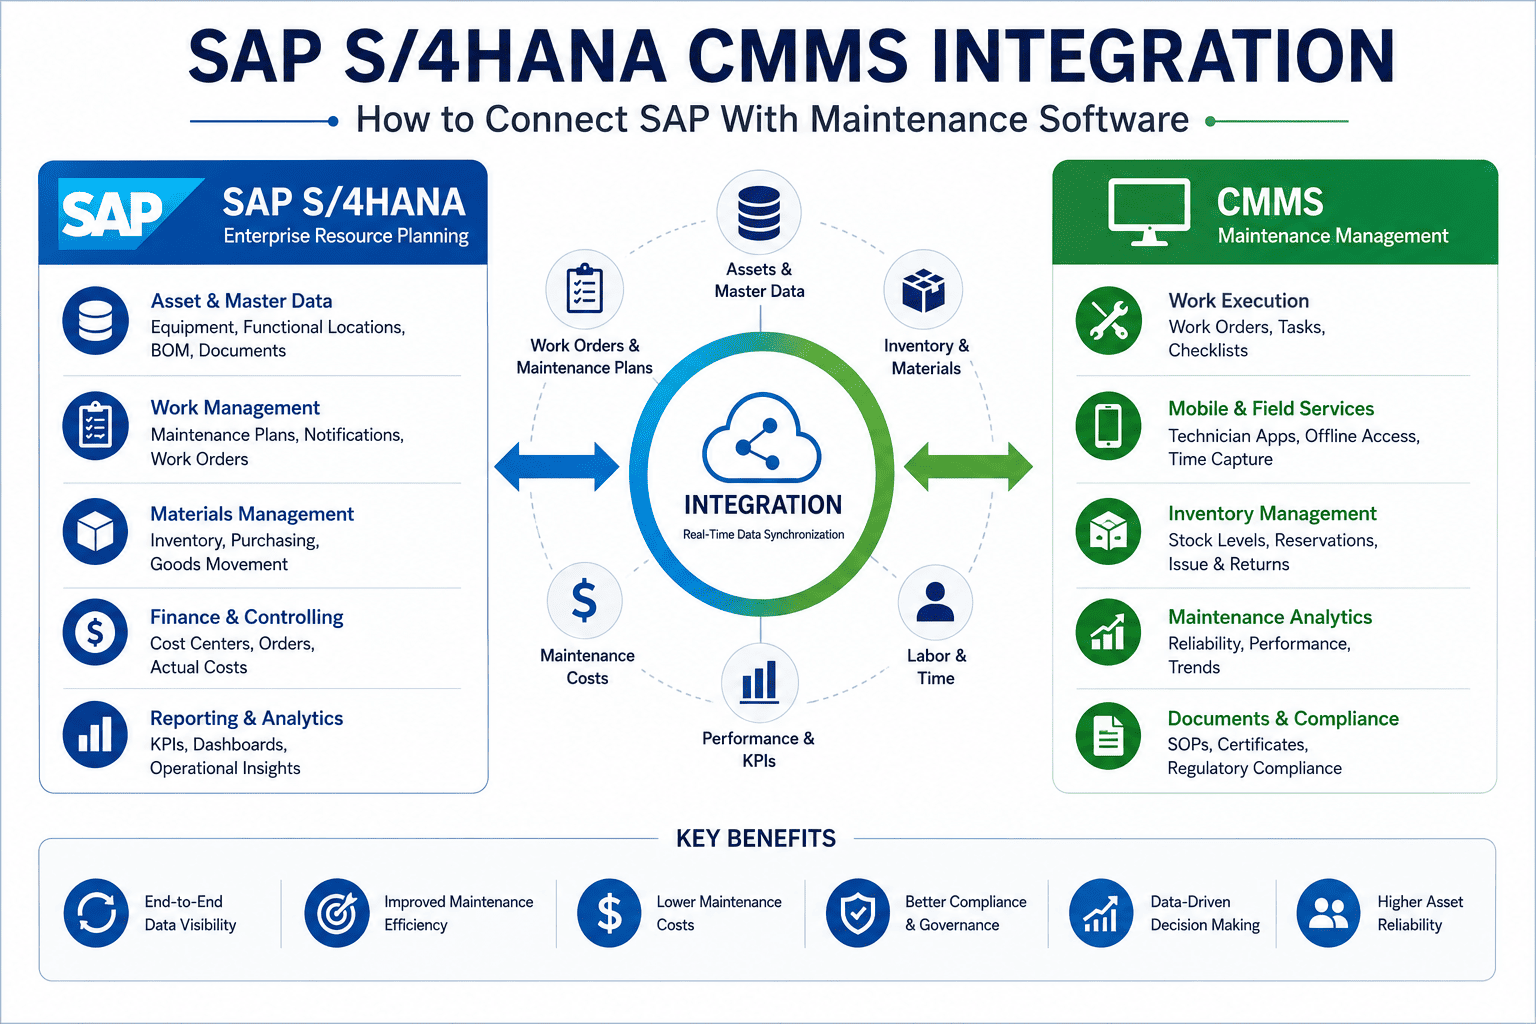
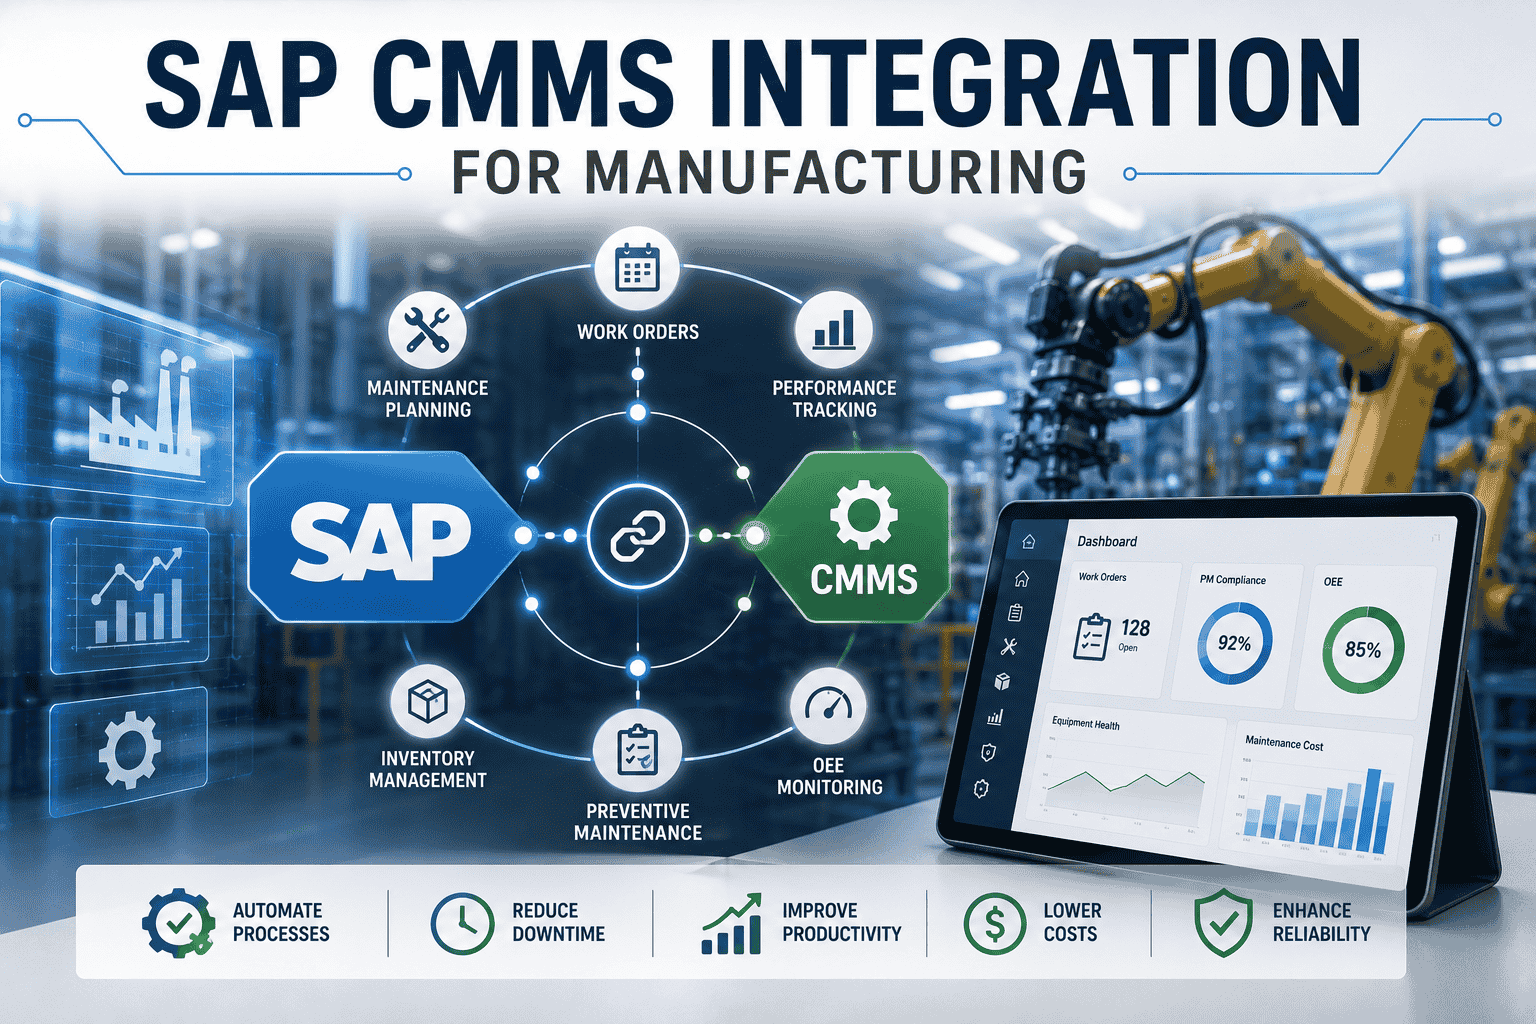
SAP PM provides the financial governance, asset master, and cost center backbone that integrated utility operations require. The CMMS layer provides the field execution, mobile work orders, and operations-technology connectivity that translate plant-level reality into structured work. Together, the integration architecture solves the documentation, distribution, and OT connectivity challenges that make utility maintenance harder than industrial maintenance.
The Water Utility System Topology
The diagram below shows the full water lifecycle from source through discharge, with maintenance touchpoints and compliance scope called out at each stage. Each zone has different asset classes, different PM strategies, and different regulatory drivers. Production-grade utility CMMS implementations cover all six zones with consistent master data architecture and zone-specific maintenance workflows.
Water Utility System Topology · 6 Asset Zones
From source water through treatment, distribution, collection, and discharge
50,000+Community water systems operating in the U.S. requiring SDWA compliance
16,000+Public wastewater treatment plants subject to CWA / NPDES requirements
240K/yrWater main breaks across U.S. distribution networks annually
The integration architecture has to handle all six zones with consistent master data, consistent work order workflow, and zone-specific compliance reporting. The most common implementation pattern is to anchor the equipment master and functional location hierarchy in SAP PM, run mobile field execution and SCADA integration through the CMMS layer, and produce zone-specific compliance reports that draw from the same underlying work order data. Utility maintenance leaders ready to model this architecture against their existing systems can Sign up free to map current asset architecture to the six-zone framework.
From Asset Failure to Compliance-Documented Restoration
The single highest-stakes workflow in utility maintenance is the response to an event that has compliance implications—a main break, an SSO (sanitary sewer overflow), an NPDES exceedance, or a treatment process upset. The pipeline below shows how an integrated SAP-CMMS architecture turns the event from a documentation challenge into a routine, evidence-producing workflow.
From Compliance Event to Documented Closure
Integrated workflow from SCADA alarm to regulatory report
T+0
SCADA Alarm or Field Report
Operational event detected via SCADA (pump failure, low chlorine, high turbidity) or reported by field crew (main break, manhole overflow). Event auto-logged with timestamp and location.
T+10 min
SAP Notification & Severity Triage
Notification auto-created in SAP PM with equipment linkage, cost center, and compliance flag. Severity scored. Operations and compliance teams alerted per escalation matrix.
T+30 min
Work Order & Crew Dispatch
Work order generated with full asset history, mobile dispatch to nearest available crew, parts reservation, and required permit/JSA documentation pre-attached. Public notification triggered if customer-impacting.
T+Hours
Field Restoration & Data Capture
Crew completes restoration. Mobile capture of repair details, time, parts, conditions, samples taken. Photos pre/post. Test results entered for compliance verification.
T+24-72 hrs
Regulatory Report Auto-Compiled
CSO/SSO event report, NPDES exceedance documentation, or LCR-related event report auto-compiled from work order data. Compliance officer reviews and submits to regulator within statutory window.
The differentiator from manual record-keeping isn't speed—it's evidence completeness. When the regulator asks six months later for documentation of the response to a specific event, the answer comes from a single integrated record rather than from spreadsheet reconciliation across paper logs, email threads, and field notebooks. That documentation completeness is what survives audits and avoids the enforcement actions that turn a single compliance event into a multi-year consent decree.
See Integrated Utility Maintenance Running on a Live Water System
Walk through a real utility operation with SCADA integration, mobile field crews, compliance documentation, and SAP-posted work orders. 30-minute live walkthrough on production architecture.
The financial case for utility CMMS integration sits on three compounding factors: avoided regulatory penalties (SDWA and CWA violations carry six-to-seven figure exposure each), reduced emergency response costs (main break and SSO response premium pricing), and operational efficiency at scale (a utility with 50,000 service connections has fundamentally different cost structure than 5,000).
Paper / Spreadsheet vs Integrated SAP-CMMS: Annual Utility Performance Delta
Swipe to compare
Operating Metric
Paper / Spreadsheet
Integrated SAP-CMMS
Shift
SDWA / CWA documentation completeness
Variable
Continuous
Material
Main break response time
4-8 hours
2-4 hours
−50%
PM compliance rate
55-65%
88-92%
+30 pts
CSO/SSO event response & reporting
Multi-day reconciliation
Same-day documented
Material
Audit finding remediation cost
$150-500K
$15-50K
−85%
Capital plan board approval rate
Variable
Consistent
Material
6-12 moTypical payback for SAP-CMMS integration at mid-size utility
$1-3M/yrAvoided regulatory and emergency response cost at typical utility scale
The largest single ROI lever isn't operational savings—it's avoided enforcement action. A consent decree from a CWA violation can run $5-50 million in capital obligations and ongoing compliance monitoring. The documentation discipline that integrated CMMS produces is the most reliable way to avoid the regulator's perception of negligence that triggers enforcement escalation in the first place. Utility finance and operations leaders ready to model this risk-adjusted ROI can Book a free demo to walk through risk-adjusted ROI modeling on a utility scale.
Expert Perspective: What Distinguishes Mature Utility Programs
The water and wastewater utilities I've seen mature their maintenance programs successfully share a property that often surprises outside consultants: they treat compliance documentation as a byproduct of operations, not an additional task to do. Every work order captures the data the regulators need. Every PM completion generates the evidence that demonstrates the asset is being maintained as required. Every SCADA event triggers a documented response sequence that produces audit-ready evidence by the time the work is closed. The utilities that struggle with compliance treat documentation as a separate workflow run by a compliance team after the fact. Inevitably the documentation lags, the gaps surface during regulatory audits, and the cost of remediation runs orders of magnitude higher than the cost of integrated workflow would have been.
Compliance Is a Byproduct
Every work order captures regulator-required data as part of normal operation. The documentation isn't a separate task; it's automatic output from the work the crews do anyway.
SCADA Drives PM, Not Vice Versa
Modern utility PM programs use SCADA data and condition monitoring to drive maintenance decisions rather than calendar-based PMs alone. The integration architecture has to support this.
Master Data Discipline at Scale
A utility's equipment master spans hundreds of pump stations, miles of pipe, and thousands of valves. Master data discipline isn't optional—it's the foundation that determines whether everything else works.
90-Day Path to Integrated Utility Operations
Water utilities that successfully deploy SAP-CMMS integration follow a consistent cadence: inventory the asset base, establish master data discipline, integrate operational technology, and validate compliance reporting workflows. The roadmap below is what disciplined utilities execute.
90-Day Utility Integration Deployment
From asset inventory to compliance-documented operations
Days 1–20
Asset & Master Data Baseline
Inventory assets across all six zones. Establish functional location hierarchy in SAP PM. Validate equipment master against GIS and existing CMMS data. Cost center alignment with departmental structure.
Days 21–45
SCADA & OT Integration
Integrate SCADA, process historian, and operations technology systems via standard protocols. Map alarm conditions to notification triggers. Validate end-to-end data flow from sensor to SAP work order.
Days 46–70
Mobile Crews & PM Activation
Deploy mobile work orders to field crews. Activate PM plans across all six zones. Validate compliance reporting workflow with sample events. Train operations and compliance teams.
Days 71–90
Compliance Reporting & Optimization
Activate automated SDWA, CWA, and NPDES reporting workflows. Validate against current regulator requirements. Tune workflows from initial operational data. Establish KPI dashboard for executive review.
By day 90, the integration is operational across the utility's full asset base, the compliance reporting workflows are producing audit-ready documentation as a byproduct of daily operations, and the executive dashboard provides board-level visibility into asset condition and program health. Operations and compliance leaders ready to start the asset baseline phase can Sign up free to begin the asset inventory baseline this week.
Turn Utility Compliance Pressure Into Documented Discipline
Six asset zones covered. SCADA-integrated work orders. Compliance documentation as byproduct of operations. See the framework running on a live water and wastewater utility.
How does SAP PM integration work with existing SCADA and process historian systems?
Integration with operational technology runs through standard protocols including OPC-UA, Modbus, and REST APIs. The integration architecture takes alarm conditions and process measurements from SCADA, applies condition-based logic to determine when to trigger SAP PM notifications, and posts work orders linked to the specific equipment master record. Most utilities have 70-80 percent of the necessary data already flowing through SCADA; the integration project is typically about connecting that existing data to maintenance workflows rather than deploying new sensors. The bidirectional flow also allows SAP to push asset status changes back to SCADA dashboards for operations visibility.
What's the difference between SDWA and CWA compliance requirements for SAP PM?
SDWA (Safe Drinking Water Act) governs treatment and distribution of drinking water and focuses on contaminant levels, treatment standards, and reporting to the EPA and state primacy agencies. CWA (Clean Water Act) governs wastewater treatment and discharge through NPDES permits with specific effluent limits. From a SAP PM perspective, both regimes require documentation of equipment maintenance, calibration of measurement instruments, and event response. The work order structures, notification types, and reporting workflows differ by regulation, but the underlying integration architecture supports both with appropriately configured workflows per zone.
How do we handle the Lead and Copper Rule with integrated maintenance?
The Lead and Copper Rule (LCR) and the recent LCRR (Revisions) require utilities to identify and replace lead service lines, monitor water quality at customer taps, and document corrosion control treatment. Integration architecture supports this through service-line inventory in the asset master, work order workflows for replacement programs, and compliance documentation of corrosion control PM activities. The 9.2 million lead service lines identified across U.S. utilities require structured replacement programs that integrated CMMS handles directly through work order generation, contractor coordination, and customer notification workflows.
Can the system handle utility-specific asset types like sewer mains and force mains?
Yes. The SAP PM functional location hierarchy supports linear assets like sewer mains, force mains, water mains, and service lines through pipe-segment structures with associated GIS attributes. Linear assets are modeled as equipment records with length, diameter, material, installation date, and condition attributes. Work orders for inspection, cleaning, CCTV, and repair link to specific segments. Integration with GIS systems through standard protocols allows maintenance work to be planned and reported on geographic maps, which is increasingly the standard interface for utility maintenance crews.
What's the typical implementation timeline for a mid-size utility?
Focused implementations on a single major facility (treatment plant or major pumping facility) typically run 60-90 days. Full utility-wide implementations covering treatment, distribution, collection, and wastewater treatment typically run 6-12 months for utilities serving 50,000-250,000 connections, and 12-18 months for larger municipal utilities. The implementation cadence prioritizes asset master data baseline first, followed by SCADA integration, mobile crew deployment, and compliance reporting workflows. Pilot zones can be operational within 90 days while broader rollout continues in parallel.