AI Oil Analysis: Lubricant Condition Monitoring at Scale
By Riley Quinn on May 2, 2026
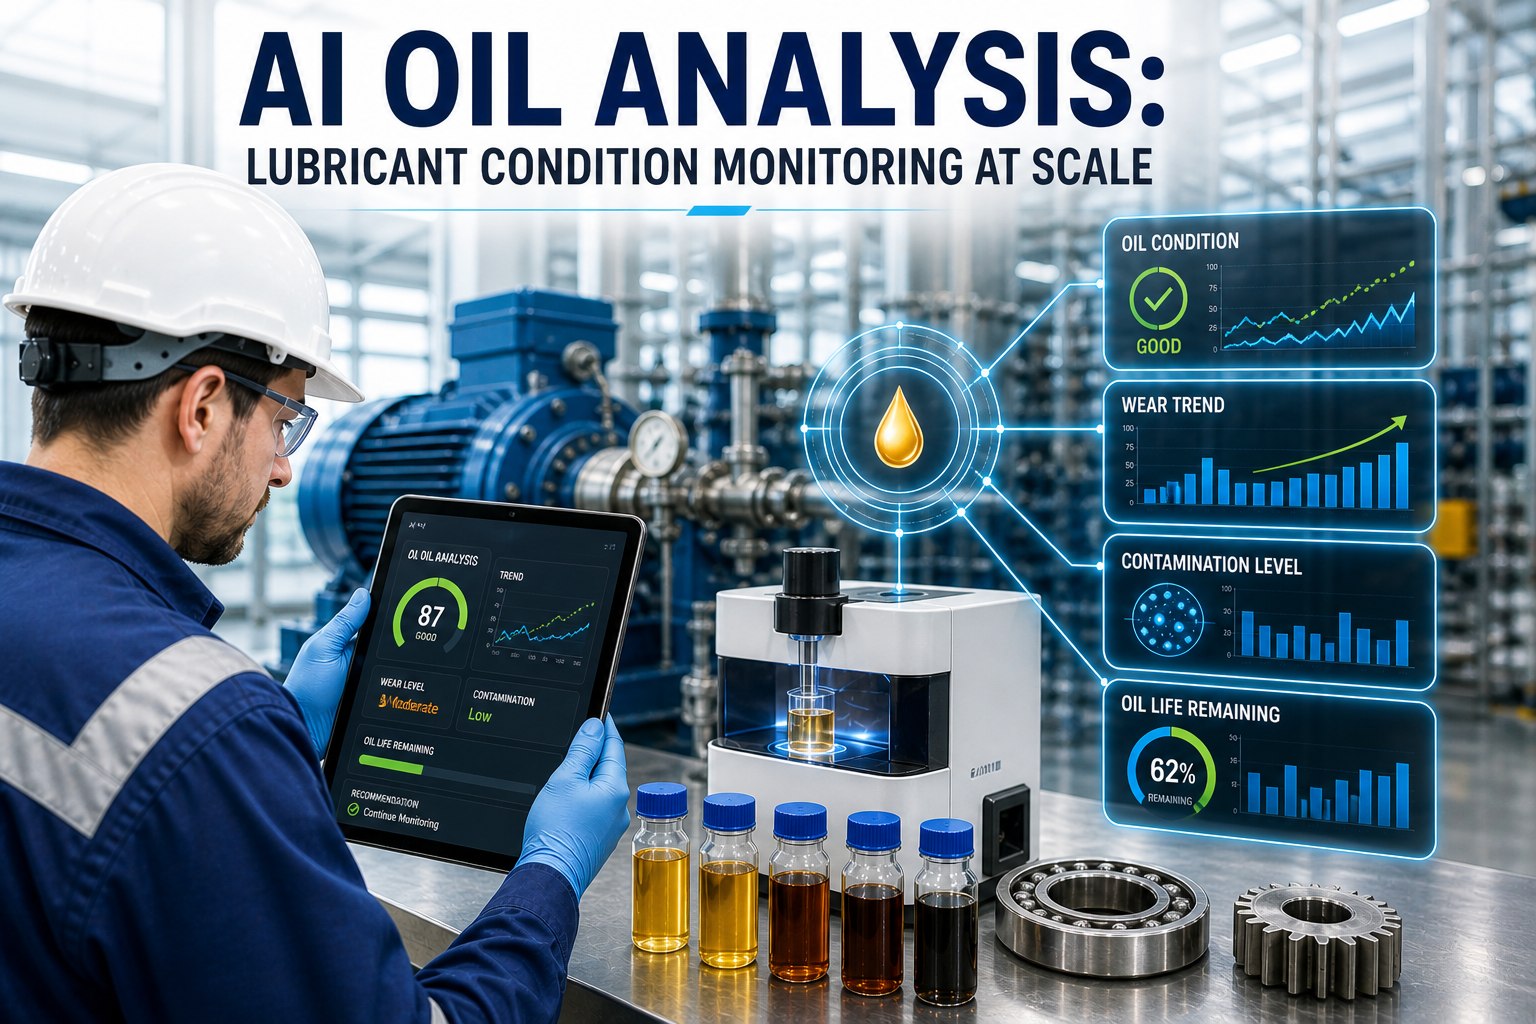
70% of all machine failures trace back to lubrication. Not bearings. Not vibration. Not even electrical faults. The oil itself — degraded, contaminated, or wrong-spec — is the root cause behind two out of every three breakdowns in industrial plants. And the data is right there: spectrometry catches wear metals down to parts-per-million, ferrography classifies particle shapes, ISO 4406 cleanliness codes track contamination ingress, and TAN/TBN reveal chemistry shifts weeks before any other sensor sees the failure. The problem isn't data scarcity. It's that most plants still treat oil samples as quarterly lab reports filed in a binder — months too late to act on. AI oil analysis flips this entirely: real-time inline spectrometry, ML-driven trend detection, automated wear-particle classification, and CMMS work orders generated the moment a degradation pattern crosses threshold. See how Oxmaint deploys AI oil analysis across fleets and plants — start your free trial.
MAY 12, 2026 5:30 PM EST , Orlando
Upcoming Oxmaint AI Live Webinar— Build Your AI Oil Analysis Program in One Session
Join the OxMaint team in Orlando to design an AI-powered lubricant condition monitoring program — spectrometric trend detection, wear-particle classification, contamination prediction, and automated CMMS work orders for fleets, gearboxes, hydraulics, and turbines.
The TriVector — How AI Oil Analysis Reads Three Dimensions Simultaneously
A single oil sample tells three stories simultaneously: how the oil itself is doing, what's gotten into it, and what the asset is wearing. Modern AI oil analysis treats these as three orthogonal axes — the TriVector — and trains separate models on each, then fuses the outputs into one asset health score. Here's what each axis measures and what AI catches that lab reports miss.
Axis 01
Fluid Health
Is the oil itself degrading?
TBNTotal Base Number — reserve alkalinity for engines
TANTotal Acid Number — oxidation in hydraulics & turbines
ViscosityOil film thickness sufficient to separate parts
Oxidation IRChemical degradation via FTIR spectroscopy
ICP SpectrometryWear metals at ppm — Fe, Cu, Cr, Pb, Al, Sn
FerrographyParticle shape classification — fatigue vs sliding
PQ IndexTotal ferrous content — large particles
LaserNet FinesParticle imaging — wear morphology
AI Sensor Fusion: Fluid + Contamination + Wear axes are scored independently then combined into a single asset health index. A single spike in any one axis triggers investigation; combined spikes across two axes auto-generate an urgent CMMS work order.
What Wear Particle Shape Tells AI About Failure Mode
This is where AI oil analysis becomes truly diagnostic. When ICP spectrometry detects high metal counts, ferrography microscopically images the wear particles. CNN-trained models classify particle shape — and shape determines failure mode. Each shape signature points to a different mechanical problem with different remediation paths. See AI wear-particle classification running on your fleet's actual oil samples — book a 30-minute session.
Spherical
Fatigue Wear
Subsurface metal fatigue — bearing rolling element pitting beginning. Indicates load or lubrication film failure. Hours-to-days warning before catastrophic spalling.
Cutting / Sliding
Abrasive Wear
Long, thin cuts — hard particle abrasion. Indicates external contamination ingress or poor filtration. Filter immediately and identify ingress path.
Chunky / Irregular
Adhesive Wear
Metal-to-metal welding and tearing — lubrication film breakdown. Indicates oil film loss, viscosity collapse, or inadequate lubricant for load. High-severity event.
Laminar / Flat
Rolling Contact
Thin platelets from rolling-element bearings. Indicates progressive bearing surface fatigue. Trend monitoring with vibration cross-correlation recommended.
Stop Filing Oil Reports — Start Acting on Them in Real Time
Oxmaint's AI oil analysis platform integrates with on-site MiniLab spectrometers, inline ISO particle counters, and lab-uploaded TriVu 360 data — auto-generating CMMS work orders the moment any TriVector axis crosses your asset-specific threshold.
The Sample-to-Work-Order Pipeline — How AI Closes the Loop
Traditional oil analysis: take a sample on Monday, ship to lab Tuesday, results back Friday, planner reviews next Monday, work order issued Tuesday. Total cycle: 8–10 days. AI oil analysis with on-site instrumentation collapses this to minutes. Here's the full pipeline from sample bottle to dispatched technician.
01
0 min
Sample Capture
Field tech draws sample using approved sampling port. QR code on bottle pre-links sample to asset record in CMMS — no manual data entry.
02
+1 min
On-Site Spectrometry
MiniLab/SpectrOil/FluidScan runs ICP wear metals, viscosity, water content, FTIR oxidation, and ISO particle count in parallel. Results to local platform.
03
+2 min
AI Trend Analysis
ML model compares results against asset-specific baseline + fleet trends. CNN classifies any wear particles. Outputs TriVector score with confidence levels.
04
+3 min
Auto Work Order
If thresholds breached: WO auto-created with diagnosed fault, recommended action, parts reserved, tech assigned. Mobile push notification sent.
Where AI Oil Analysis Pays Back Fastest
Not every asset class delivers the same ROI from AI oil analysis. Five equipment categories consistently produce 5–20× returns within the first year because their failure modes are dominated by lubricant-related causes and their downtime costs are high enough that early warning matters.
Wind Turbine Gearboxes
Single gearbox replacement: $250K–$500K + crane logistics. AI catches wear metals 6–9 months before failure — extends gearbox life 30–50%.
12–20× ROI
Mining & Heavy Equipment Fleets
Engine failure on a haul truck = $50K+ rebuild plus production loss. AI catches glycol/fuel dilution and bearing wear early — fleet uptime up 15–25%.
8–12× ROI
Power Plant Turbines
Steam/gas turbine TAN trends + varnish detection prevent journal bearing failure. Single trip event = $1M+ in lost generation.
10–15× ROI
Transformer Oil (DGA)
Dissolved Gas Analysis catches insulation breakdown 2–6 months before failure. Avoids transformer replacement at $500K–$3M per unit plus outage.
15–20× ROI
Hydraulic Systems & Compressors
ISO 4406 cleanliness shifts catch ingress events that destroy servo valves and pump barrels. Plant-wide hydraulic AI = $200K–$800K saved annually.
5–10× ROI
Expert Review — Why Oil Analysis Is the Most Underused PdM Technology
The strange thing about oil analysis is that it's both the cheapest and the most diagnostically rich predictive maintenance technology available — and the most underused. A single sample tells you what's degrading, what's contaminated, and what's wearing, all from the same bottle. Vibration analysis can tell you a bearing is failing; oil analysis tells you it's failing because the lubricant viscosity collapsed three weeks ago when water ingress hit 0.3% during the rainstorm and the oil oxidized faster than expected. The reason most plants underuse oil analysis isn't capability — it's latency. Quarterly samples shipped to a lab and reviewed weeks later don't drive decisions. AI changes the latency equation entirely: on-site MiniLab analysis plus inline particle counters plus ML trend detection collapses the sample-to-action loop from 8–10 days down to under 5 minutes. Once that latency is fixed, plants discover that 70% of their failures really were lubricant-related — and that they could have prevented most of them.
CNN Wear Classification = 95%+ Accuracy
Convolutional neural networks trained on labeled wear-particle datasets routinely achieve 95%+ classification accuracy across spherical, cutting, chunky, and laminar particle shapes — automating what previously required a tribology specialist.
Drain Intervals Extended 30–50%
Digital twins forecasting lubricant degradation enable condition-based oil changes instead of calendar-based — extending drain intervals 30–50% while reducing failure risk. Lubricant procurement spend drops measurably.
8–10 Days → 5 Minutes
Traditional lab-based oil analysis cycle: 8–10 days from sample to work order. On-site AI oil analysis: under 5 minutes. The latency reduction alone changes which decisions are economically possible.
Your 60-Day AI Oil Analysis Rollout
An AI oil analysis program doesn't require capital equipment from day one — most plants start with a hybrid program (existing lab + AI-augmented analytics on uploaded results) and add on-site spectrometry for highest-value asset categories in phase 2.
Days 1–20
Asset Inventory & Lab Integration
List all lubricated assets — fleet, gearboxes, hydraulics, turbines, transformers
Configure asset-specific sampling frequencies and threshold limits per oil grade
Connect existing lab provider data feeds — ML model trains on historical results
Days 21–40
QR-Tagged Sampling & AI Trends
Print QR-coded sample bottles linked to asset records — eliminates manual entry errors
AI trend detection live: per-asset baselines established, anomaly thresholds calibrated
First trend-driven CMMS work orders flowing automatically
Days 41–60
On-Site Spectrometry & Particle CNN
Deploy on-site MiniLab/inline particle counter on highest-value asset class
Wear-particle CNN active — fatigue/abrasive/adhesive classification automated
First documented prevented gearbox or bearing failure validates full-program ROI
Turn 70% of Your Failures Into Predictable Events
Oxmaint's AI oil analysis platform integrates with your existing lab provider, on-site spectrometers, and inline particle counters — TriVector trend detection, CNN wear classification, and CMMS work order automation in one unified platform.
What does AI add to traditional oil analysis that lab reports don't already provide?
Traditional oil analysis delivers a static snapshot — a single lab report with results compared against generic alarm limits set by the lab. AI oil analysis adds four capabilities lab reports cannot match. First, asset-specific baselines: ML models learn what "normal" looks like for your specific transformer, your specific gearbox, your specific hydraulic system — rather than applying generic OEM limits that produce false alarms on healthy assets and miss real problems on hard-running ones. Second, trend detection: AI catches a 12% drift across three samples that no individual sample would flag, predicting failure 8–12 weeks before any single result hits the alarm threshold. Third, CNN wear-particle classification: convolutional neural networks classify ferrography images into fatigue, abrasive, adhesive, and rolling-contact wear modes at 95%+ accuracy — automating what used to require a tribology specialist. Fourth, latency collapse: on-site spectrometry plus AI processing reduces the sample-to-CMMS-work-order cycle from 8–10 days to under 5 minutes, changing which decisions are economically viable.
How does the TriVector model work for asset health scoring?
The TriVector model treats lubricant condition as three orthogonal axes: Fluid Health (is the oil itself degrading?), Contamination (what has entered the system?), and Machine Wear (is the asset deteriorating?). Each axis is scored independently using its own ML model trained on the relevant test data — TBN/TAN/viscosity/oxidation IR for fluid health, ISO 4406 cleanliness/water/glycol/fuel dilution for contamination, ICP wear metals/ferrography/PQ index/LaserNet imaging for wear. The three scores fuse into a single asset health index. The diagnostic value comes from cross-axis correlation: a wear spike alongside a viscosity collapse points to lubricant film failure, while a wear spike alongside high copper and tin specifically suggests bearing material degradation. Single-axis spikes trigger investigation; combined spikes across two or three axes auto-generate urgent CMMS work orders with the diagnosed failure mode pre-populated.
Do I need on-site spectrometry equipment to deploy AI oil analysis?
No — most plants start with a hybrid program that adds AI analytics to existing lab data flows, then add on-site instrumentation only for highest-value asset classes. Phase 1 typically connects existing lab provider data feeds (Polaris, Eurofins, Bureau Veritas, etc.) to the AI platform via API, where ML models train on your historical results to establish per-asset baselines. This delivers immediate value through trend detection, wear-particle classification, and automated CMMS work order generation — without any capital equipment investment. Phase 2 deploys on-site spectrometry (MiniLab, SpectrOil, FluidScan, FerroCheck, or inline particle counters) on the asset classes where 5-minute sample-to-action latency justifies the equipment cost — typically wind turbine gearboxes, transformer DGA, power plant turbines, and large mining fleets. Most plants find that 70%+ of program ROI comes from Phase 1 alone, with on-site spectrometry adding incremental value on the most critical asset categories.
Why does wear-particle shape matter for diagnosis?
Wear-particle shape is the most diagnostically valuable single piece of information in oil analysis because shape directly indicates failure mode, which determines remediation path. Spherical particles indicate fatigue wear — subsurface metal fatigue with bearing rolling element pitting beginning, giving hours-to-days warning before catastrophic spalling. Cutting/sliding particles indicate abrasive wear from external contamination ingress or filtration failure — remediation is filter replacement and ingress path identification, not bearing service. Chunky/irregular particles indicate adhesive wear from metal-to-metal welding and tearing — lubricant film breakdown from viscosity collapse or wrong-spec oil — high-severity event requiring immediate intervention. Laminar/flat particles indicate rolling contact fatigue progression — trend monitoring with vibration cross-correlation. Same total ferrous content can come from any of these modes, but the maintenance response is completely different. CNN-trained models classify shapes at 95%+ accuracy and pre-populate work orders with the correct remediation path automatically.
What's the realistic ROI for AI oil analysis deployment?
Documented ROI varies by asset class but consistently runs 5–20× returns in the first year. Highest-ROI applications: wind turbine gearboxes (12–20× ROI from extending gearbox life 30–50% and avoiding $250K–$500K replacement events with crane logistics costs); transformer DGA (15–20× ROI from catching insulation breakdown 2–6 months before failure on units worth $500K–$3M); power plant turbines (10–15× ROI from preventing journal bearing failure events that cost $1M+ in lost generation); mining and heavy equipment fleets (8–12× ROI from catching glycol/fuel dilution and engine bearing wear early); hydraulic systems and compressors (5–10× ROI from catching ISO 4406 cleanliness shifts before they destroy servo valves and pump barrels). The compounding benefit comes from oil drain interval extension — condition-based drains instead of calendar-based typically extend intervals 30–50% while reducing failure risk, cutting lubricant procurement spend on top of the avoided-failure savings.