Electrical Energy Audit for Cement Plants: Step-by-Step Guide
By Samuel Jones on March 7, 2026
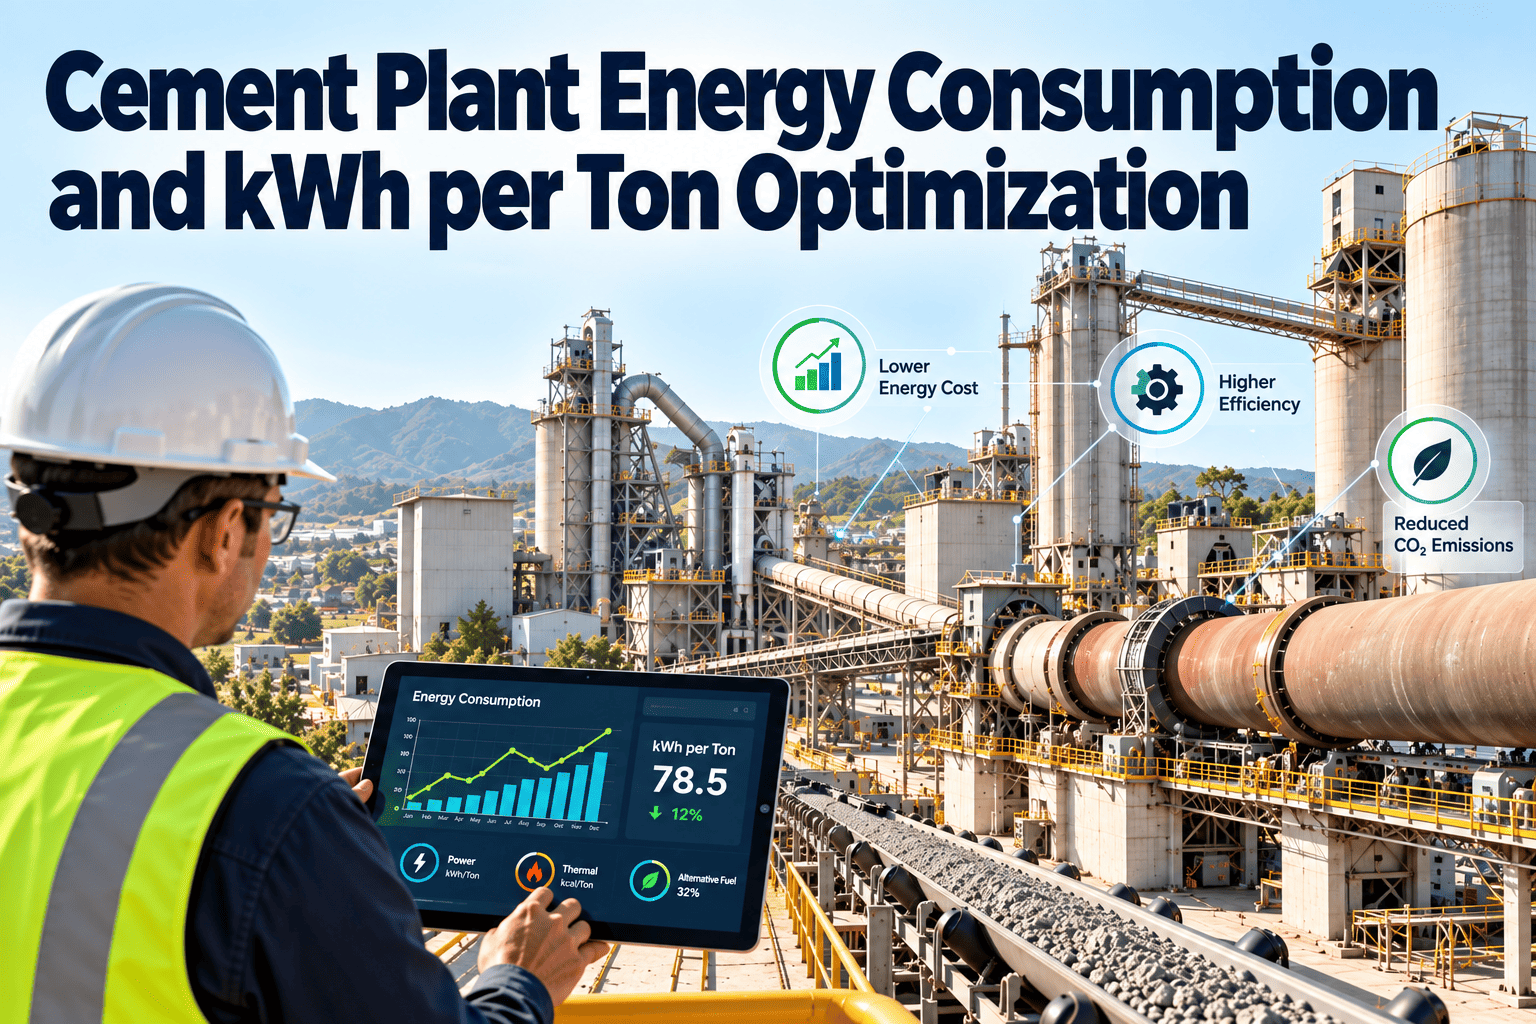
Cement plants consume 110–120 kWh of electrical energy per ton of cement produced, yet most facilities operate 15–25% above optimal efficiency benchmarks. An electrical energy audit systematically uncovers these hidden inefficiencies across motors, drives, grinding mills, compressed air systems, and auxiliary equipment — translating directly into six-figure annual savings. With energy costs accounting for 40–45% of total cement production expenses, even a 5% reduction in electrical consumption can recover hundreds of thousands of dollars annually. Start tracking your plant's energy performance with Oxmaint to digitize audit findings and automate corrective maintenance workflows from day one.
40–45%
of cement production costs are energy-related
110–120
kWh electrical energy per ton of cement produced
60%+
of plant electricity consumed by grinding mills alone
1.4 yr
average payback on energy efficiency improvements
This step-by-step guide walks cement plant engineers and maintenance managers through every phase of a comprehensive electrical energy audit — from initial planning and baseline measurement through analysis, implementation, and continuous monitoring. Each phase includes actionable checklists, quantifiable benchmarks, and integration points where digital CMMS tools accelerate results.
What Is an Electrical Energy Audit in Cement Manufacturing?
An electrical energy audit is a structured, data-driven assessment of how electricity flows through every subsystem of a cement plant. Unlike general energy assessments that focus primarily on thermal (kiln) processes, an electrical audit zeroes in on the 11–12% of total energy consumed as electricity — powering everything from raw mills and cement mills to fans, compressors, conveyors, and lighting. The audit identifies where watts are wasted, quantifies savings potential for each inefficiency, and prioritizes corrective actions by ROI. For cement plants producing 1–2 million tons annually, the electrical bill alone can exceed $8–15 million per year, making even marginal improvements worth pursuing aggressively.
Electrical Energy Consumption Breakdown in a Typical Cement Plant
Raw Mill & Grinding
26%
28–30 kWh/t
Cement Grinding (Finish Mill)
38%
40–44 kWh/t
Kiln & Pyroprocessing Auxiliaries
22%
24–26 kWh/t
Fans, Blowers & Compressed Air
8%
8–10 kWh/t
Conveyors, Lighting & Auxiliaries
6%
6–8 kWh/t
Source: Industry benchmarks from Scientific Reports (2025) and IEA Cement Technology Roadmap
The 7-Phase Electrical Energy Audit Framework
A rigorous electrical energy audit follows a sequential framework where each phase builds on verified data from the previous step. Skipping phases — a common shortcut in under-resourced plants — introduces estimation errors that compound downstream, leading to misallocated capital and underwhelming savings. The framework below reflects best practices from facilities that consistently achieve 10–20% electrical consumption reductions post-audit.
01
Pre-Audit Planning & Scope Definition
Duration: 1–2 Weeks
Every successful audit begins with clearly defining what will be measured, who is responsible, and what outcome the plant expects. Start by assembling the audit team — typically a lead electrical engineer, a process engineer familiar with grinding operations, a maintenance supervisor, and a data analyst. Define the audit boundary: will you cover the entire plant or focus on specific high-consumption areas like the cement mill circuit first?
Phase 1 Checklist
✓ Collect 12–24 months of electricity billing data and load profiles
✓ Obtain single-line electrical diagrams and motor schedules
✓ Document rated capacity vs. actual production throughput
✓ Identify all metering points and verify calibration status
✓ Set audit objectives: target kWh/ton reduction and payback threshold
✓ Assign team roles and schedule walkdown dates
02
Baseline Energy Measurement & Data Collection
Duration: 2–4 Weeks
This phase establishes the quantitative foundation of the entire audit. Install portable power analyzers on major feeders, motor control centers, and individual high-draw equipment. Record voltage, current, power factor, harmonics, and kWh consumption at 15-minute intervals across at least two full production cycles. Simultaneously, log production output (tons of clinker and cement) to compute specific energy consumption (SEC) per ton for each subsystem. Oxmaint's real-time asset monitoring integrates directly with power analyzers to automate this data capture, eliminating manual logging errors that typically introduce 5–10% measurement variance.
Key Measurements to Capture
Power Factor
Target: >0.95
Load Profile (15-min)
Min. 2 cycles
Harmonic Distortion
THD <5%
SEC (kWh/ton)
Per subsystem
03
Motor & Drive Systems Assessment
Duration: 2–3 Weeks
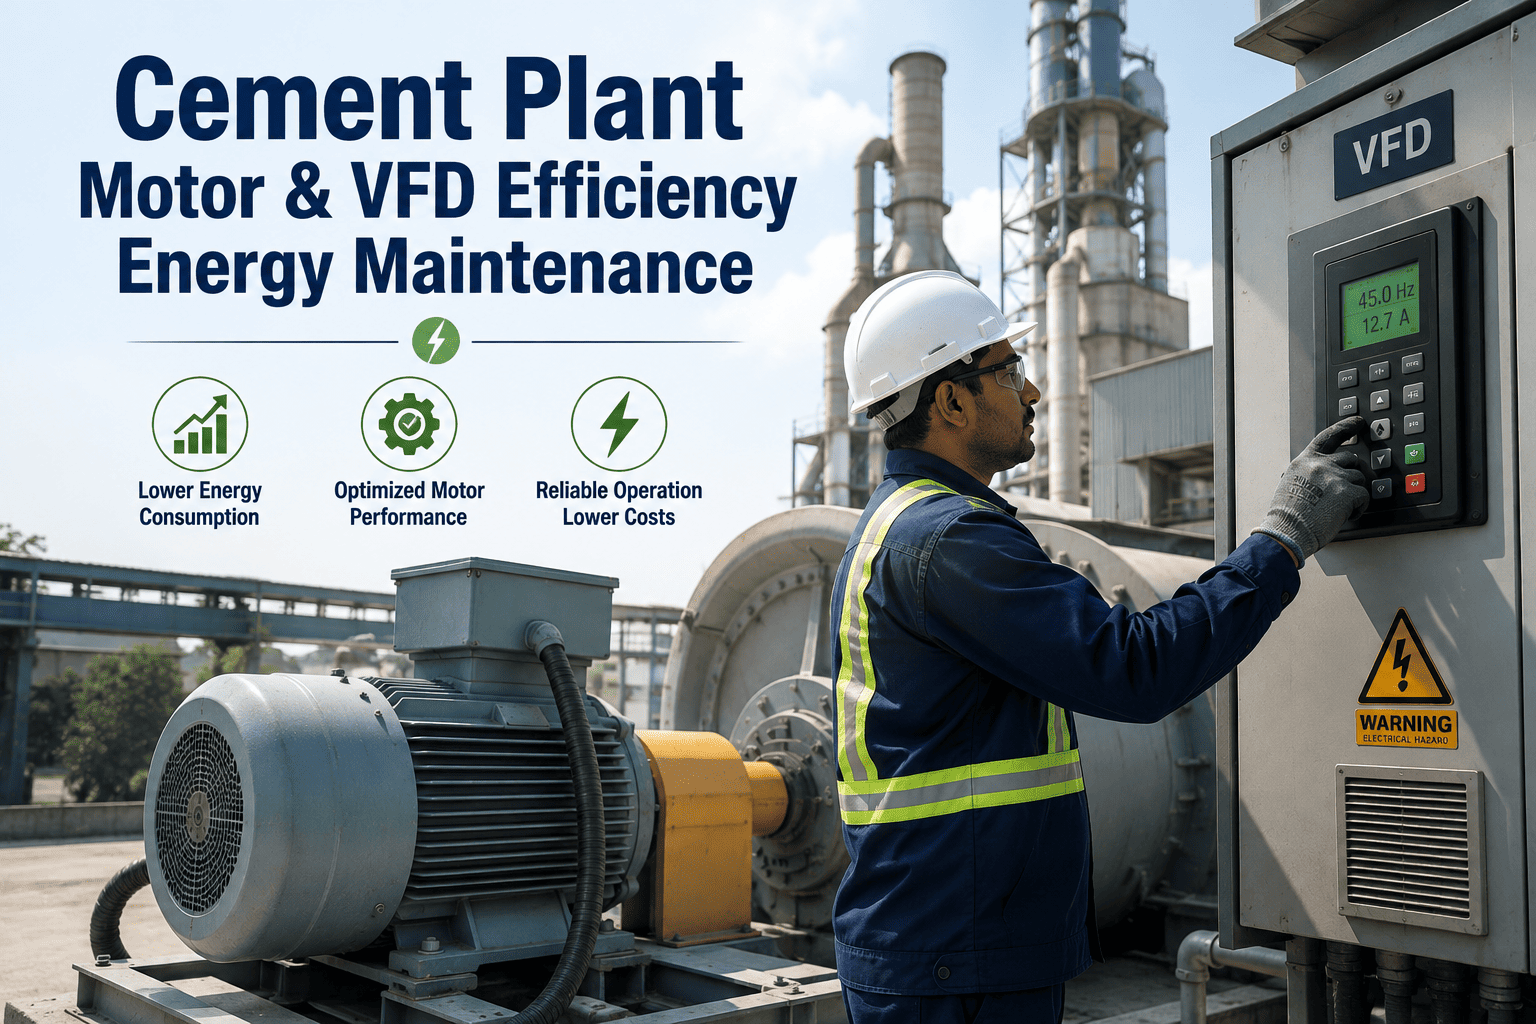
Motors account for 70–80% of all electrical consumption in a cement plant. Evaluate every motor above 50 kW: measure actual loading versus rated capacity, check bearing condition via vibration analysis, test insulation resistance, and assess whether variable frequency drives (VFDs) would yield savings on variable-load applications like fans and pumps. Motors consistently running below 50% load are prime candidates for right-sizing or VFD installation, which can reduce energy consumption on that drive by 20–50%.
Motor Efficiency Issue
Typical Waste
Correction Action
Savings Potential
Oversized motors (<50% load)
8–15% excess
Right-size or install VFD
20–50% on drive
Low power factor (<0.85)
Penalty charges + losses
Capacitor bank installation
3–8% system-wide
Rewound motors (efficiency drop)
2–5% per rewind
Replace with IE3/IE4 motors
5–10% per unit
Missing VFDs on fans/pumps
30–40% throttle waste
Retrofit VFD controls
25–45% on drive
04
Grinding Circuit Energy Analysis
Duration: 2–3 Weeks
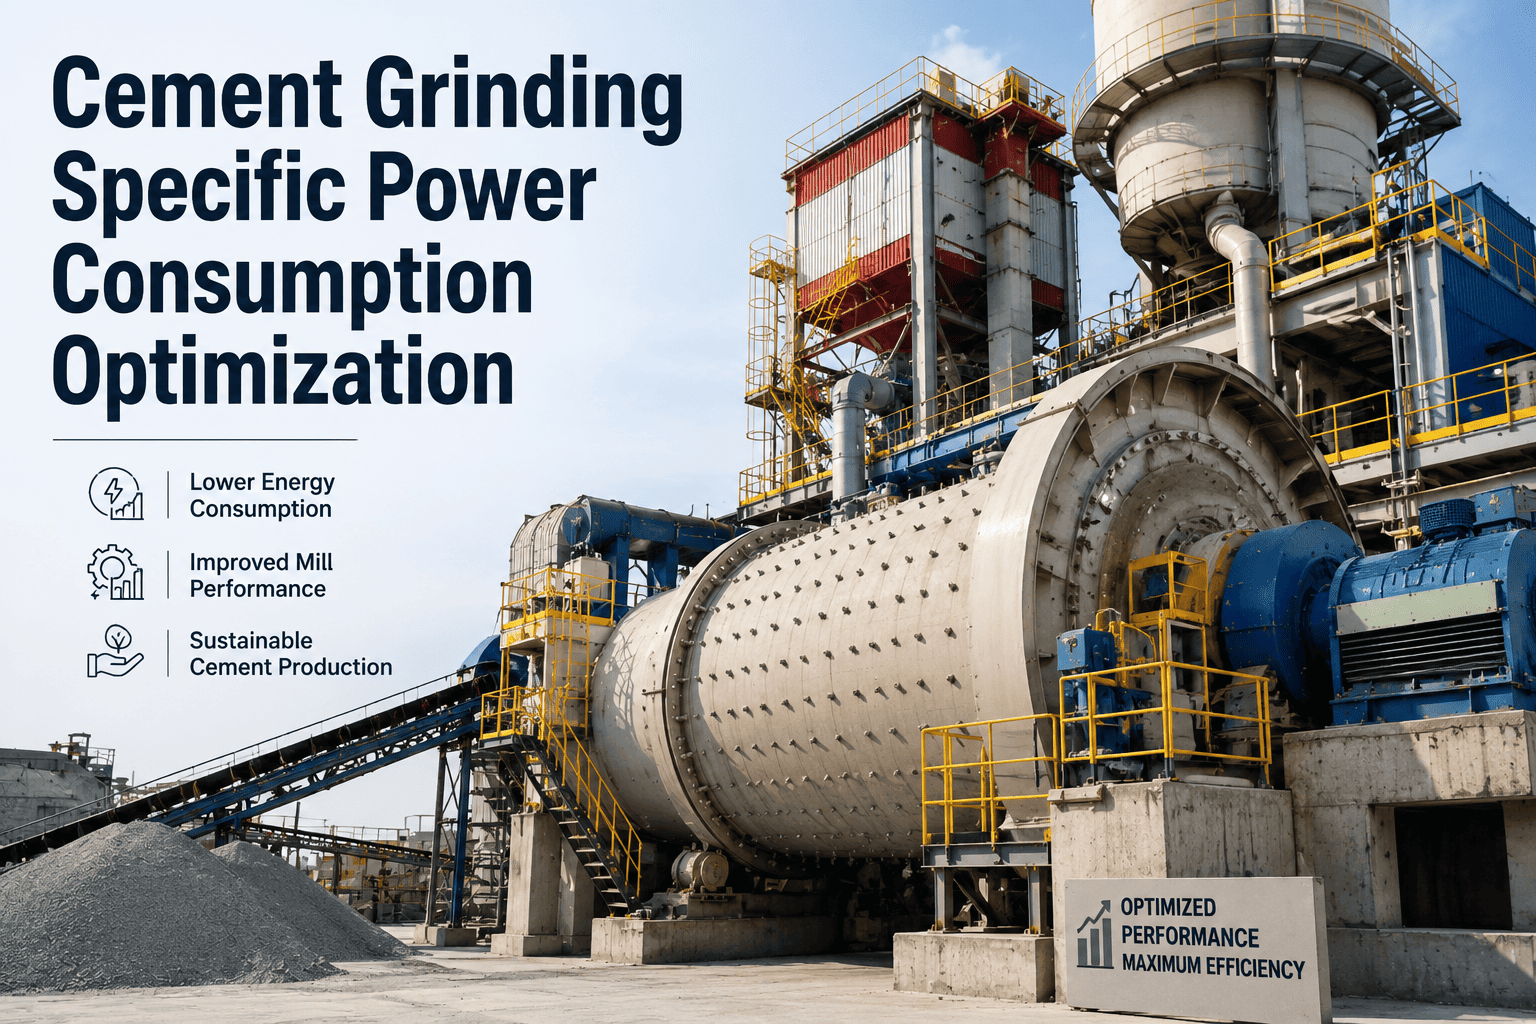
Grinding consumes over 60% of total plant electricity. Audit both raw mill and finish mill circuits by measuring specific energy consumption per ton of product at current operating parameters, then benchmarking against industry best practices. For ball mills, the benchmark SEC for cement grinding is 30–36 kWh/ton; vertical roller mills (VRMs) typically achieve 20–26 kWh/ton. Evaluate separator efficiency, grinding media condition, mill ventilation, and classifier performance. Advanced roller mills can save up to 11.9 kWh/ton compared to conventional ball mills, and upgrading finish grinding systems has demonstrated savings potential of 25.93 kWh/ton in documented studies. Book a demo to see how Oxmaint tracks grinding circuit KPIs and triggers maintenance actions when SEC drifts above threshold.
05
Compressed Air & Auxiliary Systems Review
Duration: 1–2 Weeks
Compressed air systems in cement plants typically operate at 15–30% energy waste due to leaks, excessive pressure settings, and inefficient compressor loading. Conduct an ultrasonic leak survey across all pneumatic lines — a single 3mm leak at 7 bar can waste over 4,000 kWh annually. Evaluate compressor sequencing, receiver tank sizing, pressure drop across filters and dryers, and whether variable speed compressors would match demand profiles better than fixed-speed units running in load/unload mode. Also assess transformer loading, power distribution losses, lighting systems, and cooling equipment for quick-win improvements.
06
Analysis, Prioritization & Action Plan
Duration: 2–3 Weeks
Compile all measurement data into a unified energy balance showing where every kilowatt-hour goes. Identify gaps between actual and benchmark performance for each subsystem. Quantify the savings potential (kWh/year and $/year) for every improvement opportunity, estimate implementation cost, and calculate simple payback period. Rank all opportunities into three tiers: quick wins (payback under 6 months, minimal capital), medium-term projects (6–24 months payback), and strategic investments (over 24 months payback requiring capital approval). Oxmaint converts audit findings into trackable work orders automatically, assigning each corrective action to the responsible technician with deadline visibility across the entire maintenance team.
Quick Wins
< 6 months payback
Leak repairs, power factor correction, lighting upgrades, belt tension adjustments, idle equipment shutdown protocols
Medium-Term
6–24 months payback
VFD retrofits on fans and pumps, motor right-sizing, separator upgrades, compressor sequencing optimization
Execute the prioritized action plan beginning with quick wins to build momentum and demonstrate early ROI. For each implemented measure, conduct measurement and verification (M&V) to confirm actual savings match projections. Establish a permanent energy monitoring system that tracks SEC per subsystem on a daily basis — plants that monitor continuously sustain savings 3x longer than those relying on periodic audits alone. Integrate energy KPIs into your CMMS dashboard so maintenance teams see the energy impact of every work order, asset condition change, and operational adjustment in real time. Schedule a demo to explore Oxmaint's energy monitoring dashboards built specifically for cement plant operations.
Turn Audit Findings Into Measurable Savings
Oxmaint digitizes every phase of your electrical energy audit — from baseline data capture to work order execution and continuous SEC tracking. Cement plants using Oxmaint report 15–25% faster corrective action completion.
Electrical Energy Audit Tools & Instruments Required
The accuracy of an electrical energy audit depends entirely on the quality and calibration of measurement instruments deployed. Below is the essential toolkit for a comprehensive cement plant electrical audit, along with the specific parameters each instrument captures.
Power Quality Analyzer
Measures voltage, current, power factor, harmonics (THD), and energy consumption on 3-phase circuits. Essential for identifying power quality issues that cause motor overheating and efficiency losses.
Portable Data Logger
Records electrical parameters at configurable intervals (typically 15 minutes) over extended periods. Critical for capturing load profiles across complete production cycles and shift patterns.
Thermal Imaging Camera
Detects hot spots in electrical panels, cable connections, motor windings, and transformers. Temperature anomalies above 10°C differential indicate potential failures and energy losses.
Ultrasonic Leak Detector
Pinpoints compressed air leaks and partial discharge in electrical insulation. Compressed air leak detection alone typically identifies 15–30% waste in cement plant pneumatic systems.
Common Electrical Inefficiencies Uncovered During Cement Plant Audits
After conducting audits across hundreds of cement facilities, industry consultants consistently find the same recurring patterns of electrical waste. Understanding these patterns before starting your audit helps focus measurement efforts on the highest-impact areas and prevents overlooking systemic issues that individually seem minor but collectively drain substantial energy.
Damper-Controlled Fans Without VFDs: Many cement plants still throttle airflow using mechanical dampers rather than adjusting fan speed electronically. A fan operating at 80% airflow via damper control uses nearly full power, while a VFD-controlled fan at 80% flow uses roughly 50% power — the cubic relationship between speed and power makes this one of the highest-ROI upgrades available.
Poor Power Factor Across Motor Groups: Cement plants with aging capacitor banks or no automatic correction often run at 0.80–0.85 power factor, resulting in reactive power penalties from utilities and increased I²R losses throughout the distribution network. Proper correction to 0.95+ typically saves 3–8% on the total electricity bill.
Worn Grinding Media and Inefficient Classifiers: Ball mills with worn liners and media consume 10–15% more energy per ton of product. Combined with poorly adjusted separators that recirculate excessive fines, the grinding circuit can operate 20–30% above benchmark SEC without triggering obvious alarms.
Idling Equipment During Non-Production Hours: Conveyors, compressors, and auxiliary systems often continue running during kiln stops, shift changes, and maintenance windows. Implementing automated shutdown sequences tied to production status can recover 2–5% of total plant consumption.
Harmonic Distortion from VFDs Without Filtering: Ironically, plants that have installed VFDs without proper harmonic filters can experience total harmonic distortion (THD) above 10%, causing additional heating losses in cables, transformers, and motors throughout the facility. The audit must measure THD at the point of common coupling to quantify this impact.
How a CMMS Accelerates Every Audit Phase
A digital CMMS platform transforms an electrical energy audit from a one-time project into a continuous improvement engine. During the audit itself, CMMS provides the historical work order data, asset condition records, and maintenance logs that auditors need to correlate energy waste with equipment health. Post-audit, every identified improvement becomes a trackable work order with assigned responsibility, deadline, and verification criteria. Plants running integrated KPI tracking alongside maintenance workflows detect SEC drift within days rather than waiting months for the next utility bill to reveal regression.
A
Historical Data Access
Pull asset maintenance history, failure logs, and operational data to correlate energy anomalies with equipment condition changes
➜
B
Audit Task Management
Create and assign measurement tasks, track completion across audit team members, capture findings in structured digital format
➜
C
Corrective Work Orders
Convert every audit finding into an actionable work order with priority, cost estimate, and expected energy savings attached
➜
D
Continuous Monitoring
Track SEC trends on dashboards, trigger alerts when energy KPIs exceed thresholds, and verify sustained savings over time
Digitize Your Next Electrical Energy Audit
From baseline data capture through corrective action tracking and continuous SEC monitoring — Oxmaint provides the digital backbone that turns one-time audit findings into permanent efficiency gains across your cement plant.
Benchmarking your plant's specific electrical consumption against industry standards reveals exactly how much improvement potential exists. The table below shows benchmark ranges compiled from published research and industry surveys — positioning your plant against these figures during the audit immediately highlights which subsystems deserve the most attention.
Subsystem
Best Practice
Industry Average
Poor Performer
Raw Material Grinding
14–18 kWh/t
22–28 kWh/t
32–40 kWh/t
Cement Grinding (OPC)
24–28 kWh/t
32–38 kWh/t
42–55 kWh/t
Kiln Auxiliaries
18–22 kWh/t clinker
24–28 kWh/t clinker
30–38 kWh/t clinker
Compressed Air System
4–6 kWh/t
7–10 kWh/t
12–18 kWh/t
Total Plant SEC
85–95 kWh/t
110–120 kWh/t
135–160 kWh/t
Post-Audit: Sustaining Energy Savings Long-Term
The biggest risk after an electrical energy audit is regression — savings that erode within 12–18 months as equipment degrades, operating habits drift, and maintenance priorities shift back to reactive mode. Plants that sustain savings share three characteristics: they embed energy KPIs into daily management reviews, they tie maintenance schedules to energy performance triggers (not just calendar intervals), and they conduct mini-audits quarterly on their top five energy-consuming systems. Linking your audit outputs to kiln energy optimization workflows ensures that electrical and thermal efficiency improvements reinforce each other rather than competing for resources.
01
Daily SEC Dashboard Reviews
Display real-time specific energy consumption per subsystem on control room monitors. When SEC drifts above threshold, the system should generate an automatic work order for investigation — not wait for monthly reporting cycles.
02
Energy-Triggered Maintenance
Configure CMMS alerts based on energy deviation, not just calendar-based PM schedules. If a mill's SEC rises 5% above baseline, trigger an inspection work order for media wear, classifier performance, and ventilation blockage before production impact escalates.
03
Quarterly Focus Audits
Conduct 2–3 day mini-audits on the top 5 energy consumers every quarter. Compare current measurements against the original audit baseline. This catches regression early and maintains institutional focus on energy efficiency.
04
Cross-Functional Energy Teams
Establish a permanent energy committee with representatives from maintenance, operations, process engineering, and finance. Monthly meetings review energy performance, approve investments, and ensure accountability for sustained improvements.
Frequently Asked Questions
How long does a complete electrical energy audit take for a typical cement plant?
A comprehensive electrical energy audit for a standard 1–2 MTPA cement plant typically requires 8–14 weeks from planning through final report delivery. The data collection phase alone needs at least 2–4 weeks to capture complete production cycles across different operating conditions. Plants that maintain digital maintenance records through a CMMS can reduce the pre-audit planning phase significantly because historical data is already structured and accessible.
What is the typical ROI from an electrical energy audit in a cement plant?
Industry studies show that the average simple payback on energy efficiency recommendations from cement plant audits is approximately 1.4 years, with average annual savings of around $130,000 per recommendation implemented. Plants achieving 10–15% overall electrical consumption reduction from audit findings typically recover their full audit investment within 3–6 months through quick-win implementations alone.
Should the audit cover thermal energy as well as electrical?
While thermal energy (kiln fuel) represents roughly 90% of net energy consumption in cement manufacturing, a dedicated electrical audit provides deeper, more actionable findings for the electrical systems that represent 11–12% of total energy. Many plants conduct separate thermal and electrical audits with different specialist teams. However, some electrical improvements — like VFD-controlled kiln fans — directly affect both electrical consumption and kiln thermal efficiency.
Can we conduct an electrical energy audit using internal staff, or do we need external consultants?
Internal teams with qualified electrical engineers and access to proper instrumentation can conduct effective audits, particularly for Level 1 (walk-through) and Level 2 (detailed) assessments. External consultants add value through benchmarking databases from audits across hundreds of facilities, specialized instrumentation, and objectivity that internal teams may lack. A hybrid approach — internal staff conducting measurements with external consultants providing analysis and benchmarking — often delivers the best results.
How does a CMMS improve the effectiveness of an electrical energy audit?
A CMMS accelerates every audit phase by providing structured historical data (maintenance records, failure logs, asset condition history) that correlates energy anomalies with equipment health. Post-audit, the CMMS converts findings into trackable work orders with assigned ownership and deadlines. Most critically, it enables continuous energy monitoring through dashboard KPIs that alert teams when efficiency regresses — preventing the savings erosion that affects 60% of plants relying on periodic audits alone.
What is the most impactful single improvement typically found during cement plant electrical audits?
Variable frequency drive (VFD) installation on large fans and pumps consistently ranks as the highest-impact single improvement. Due to the cubic relationship between motor speed and power consumption, reducing fan speed by just 20% cuts energy use by nearly 50% on that drive. In cement plants where multiple large fans (kiln ID fan, raw mill fan, cement mill fan) operate on damper control, VFD retrofits can deliver 500,000–1,500,000 kWh annual savings per unit with payback periods under 18 months.
How frequently should electrical energy audits be repeated?
Full comprehensive audits should be conducted every 3–5 years, with quarterly mini-audits on the top 5 energy-consuming subsystems in between. Plants with continuous SEC monitoring through their CMMS can extend full audit intervals because they detect efficiency degradation in real time. Any major equipment change (new mill, kiln upgrade, compressor replacement) should trigger a targeted audit of the affected circuit within 3 months of commissioning to establish new baselines.