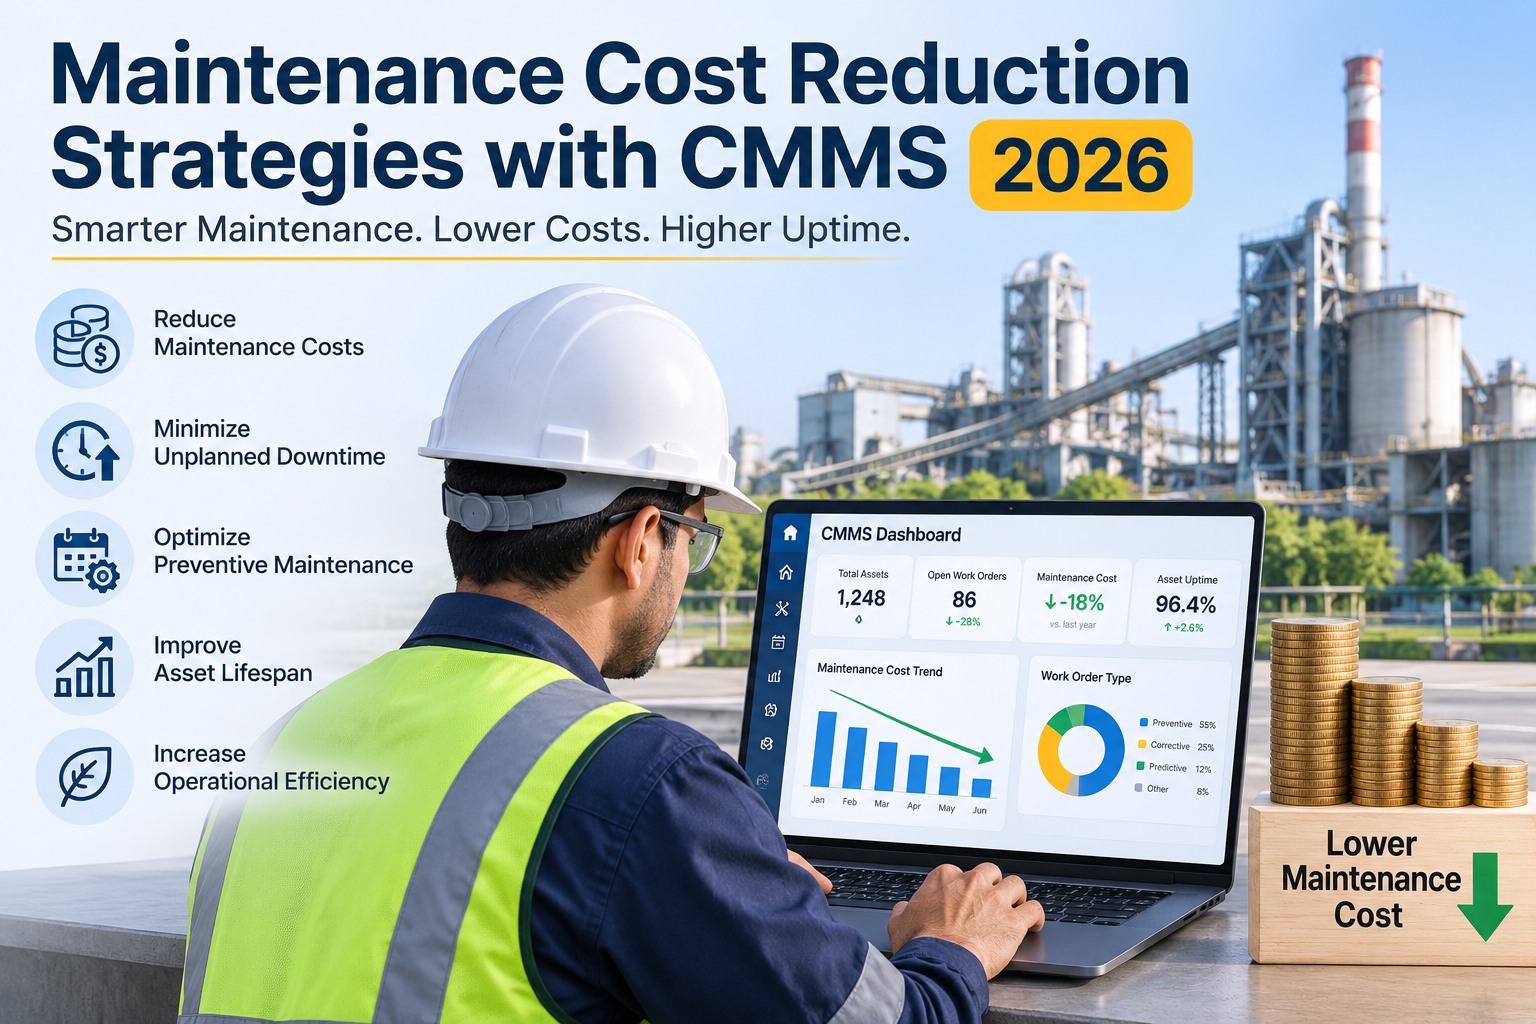
Maintenance in the cement industry represents 15-25% of total manufacturing expenditure — yet 73% of maintenance leaders expect their budgets to either grow or hold steady in 2026, signaling a historic shift from cost-center thinking to strategic asset investment. The numbers demand attention: a single day of unplanned kiln downtime costs a 1 MTPA cement plant up to $300,000, the average large manufacturing facility loses $253 million per year to unplanned stoppages, and emergency spare parts now cost 18-25% more than planned purchases due to supply chain volatility. Meanwhile, Fortune 500 companies stand to save an estimated $233 billion in maintenance costs annually through full adoption of predictive maintenance and condition monitoring. The gap between plants that budget reactively and those that plan strategically is no longer a matter of marginal efficiency — it is the difference between profit and loss. If your 2026 maintenance budget is still built on last year's spreadsheet plus an inflation adjustment, sign up for Oxmaint to start building data-driven budgets from real work order history, asset condition data, and automated cost tracking — or book a demo to see how leading cement plants are turning maintenance spend into measurable ROI.
The 2026 Maintenance Budget Landscape: What Has Changed
Maintenance budgeting in 2026 is being shaped by forces that did not exist even three years ago. Understanding these shifts is essential before allocating a single dollar to your maintenance program this year.
Maintenance as a Profit Lever
88% of maintenance teams expect headcount to increase or hold, and 73% expect budgets to grow or remain stable. Manufacturing leaders now treat maintenance as essential to operational excellence and margin protection — not an overhead line to be cut during downturns. Budgets must reflect this elevated strategic status with clearly tied performance metrics. Start building yours with Oxmaint — where every maintenance dollar is tracked against measurable outcomes.
AI Investment Pressure
65% of maintenance teams plan to adopt AI by end of 2026, yet budget constraints (25%) and lack of expertise (24%) remain the top barriers. Financial planning must now include line items for sensor infrastructure, software subscriptions, and training — costs that did not exist in traditional maintenance budgets but are becoming non-negotiable for competitive plants.
Aging Asset Crisis
The average age of industrial fixed assets has reached 24 years — the oldest in nearly 70 years. Older equipment demands progressively more maintenance spend, more frequent overhauls, and more sophisticated monitoring. Budget models that assume stable year-over-year costs on aging assets are guaranteed to underestimate actual spending.
Labor Market Reality
45% of maintenance leaders cite lack of resources as their primary challenge. The average maintenance professional is 54 years old with 26 years of experience — retirements are accelerating knowledge loss. Budgets must account for competitive wages, contractor premiums (23% of work is outsourced), and digital tools that capture institutional knowledge before it walks out the door.
Maintenance Budget Allocation: Where Every Dollar Goes
Industry benchmarks provide the starting framework, but cement plant budgets require specific allocation models that reflect the unique cost structure of pyroprocessing, grinding, and material handling operations. The breakdown below represents optimized allocation for a plant targeting best-in-class reliability performance:
The True Cost of Unplanned Downtime in Cement Plants
Maintenance budgets that fail to account for the full downstream cost of unplanned failures consistently underestimate required spend. These are not theoretical projections — they represent documented cost data from operating cement plants that reinforce why proactive budget allocation delivers superior financial outcomes.
Build Your 2026 Maintenance Budget on Real Data, Not Guesswork
Oxmaint tracks every work order, labor hour, part cost, and downtime event — giving you the historical data foundation to build budgets that actually match reality. Most plants are running within one week.
Five-Step Budget Building Framework for Cement Plant Maintenance
Effective maintenance budgets are not created in a single planning session — they are built through a systematic process that connects historical performance data to forward-looking asset needs. This framework turns production efficiency KPI tracking into actionable financial planning.
Historical Spend Analysis (3-5 Year Window)
Pull complete maintenance cost data from your CMMS — work order volumes, labor hours, parts consumption, contractor invoices, and energy costs associated with maintenance activities. Adjust for inflation, capacity changes, and one-time capital events. Plants without digital records should treat this as the highest-priority reason to deploy a CMMS immediately: you cannot budget accurately from memory. Categorize spend by asset, maintenance type (reactive vs. planned), and cost element to identify where money is actually going versus where you think it goes.
Asset Condition and Lifecycle Assessment
Evaluate every critical asset against its lifecycle position. With industrial equipment averaging 24 years old, many cement plant assets are approaching or have exceeded design life. Create a tiered asset risk matrix: assets in the final 20% of expected life require 2-3x the maintenance budget of mid-life assets. Schedule condition assessments for kiln refractories, mill liners, crusher wear parts, and major drive systems — the data directly informs both the preventive maintenance allocation and the contingency reserve.
Maintenance Strategy Mix Optimization
Determine the optimal balance between reactive, preventive, predictive, and condition-based maintenance for each asset class. Currently, 71% of teams rely primarily on preventive maintenance, but roughly 30% of scheduled PM work is performed too frequently — wasting budget on unnecessary interventions. Shifting high-value assets to predictive maintenance saves 8-12% over pure preventive programs. Model the cost difference: fewer unnecessary PMs mean lower labor and parts spend, redirected toward sensor technology and analytics that catch failures 30-90 days in advance.
Revenue-Impact Prioritization
Rank every budget line item by its impact on production revenue. Kiln maintenance gets top priority because kiln downtime carries the highest cost. Next, rank mill systems, followed by material handling, then auxiliary systems. This is not about cutting costs — it is about directing spend where it protects the most revenue. A plant that invests $50,000 in kiln refractory monitoring to prevent a single $300,000/day unplanned shutdown has achieved a return no other line item can match.
Quarterly Review and Dynamic Reallocation
Static annual budgets fail by Q2 in cement plants. Build quarterly review checkpoints where actual spend is compared against budget, downtime data is analyzed, and allocations are adjusted. CMMS dashboards automate this comparison — showing spend-to-budget variance by asset, department, and maintenance type in real time. Reserve 10-15% of the total budget for reallocation based on Q1 and Q2 actuals, ensuring resources flow to where the data says they are needed most.
ROI of Predictive Maintenance: Budget Justification Data
Justifying maintenance technology investments requires speaking the language of finance — ROI, payback period, and net present value. The following data points represent documented outcomes that plant managers can use directly in budget proposals and capital expenditure requests:
These figures transform maintenance from a cost justification exercise into a revenue protection argument. When presenting to executive leadership, frame every maintenance dollar as insurance against production loss — not as an expense to be minimized. A plant that spends $200,000 on predictive monitoring to prevent $2 million in annual downtime losses is generating 10x return, making it one of the highest-ROI investments available to any cement operation. Start tracking your maintenance ROI with Oxmaint and build the data case your CFO will approve.
Turn Your Maintenance Budget into a Revenue Protection Strategy
Oxmaint gives you complete visibility into maintenance costs by asset, department, and work type — making budget variance tracking automatic and executive reporting effortless. Join the 52% of industrial plants already using CMMS.
Common Budgeting Mistakes That Drain Cement Plant Profits
Even experienced plant managers fall into budgeting traps that silently erode maintenance effectiveness and inflate total cost of ownership. Recognizing these patterns is the first step to eliminating them from your 2026 financial plan.
Budgeting on Last Year + Inflation
The most common — and most dangerous — approach. Simply adding an inflation percentage to last year's number ignores asset aging curves, changing failure modes, regulatory requirements, and technology investments. A 24-year-old motor does not need the same budget as a 5-year-old motor. Use asset-level condition data to build bottom-up budgets that reflect actual equipment needs.
Zero Contingency Allocation
82% of companies experienced at least one unplanned downtime event in the past three years. Budgets without a 5-10% contingency reserve guarantee overspend when — not if — a major failure occurs. The contingency fund is not a luxury; it is a mathematical certainty that will be needed. Use CMMS failure history to right-size the reserve based on your plant's actual risk profile.
Ignoring Over-Maintenance Waste
Approximately 30% of preventive maintenance is performed more frequently than necessary, and only 18% of age-related failures actually follow a predictable time-based pattern. Every unnecessary PM consumes labor, parts, and production time. Condition-based triggers — replacing calendar schedules where sensor data is available — typically recover 8-12% of wasted PM spend without increasing failure risk.
Treating All Assets Equally
A kiln that costs $300,000 per day when down does not deserve the same budget methodology as an auxiliary conveyor. Flat per-asset budgeting spreads resources too thin on critical equipment and overspends on non-critical assets. Implement criticality-weighted budget allocation: the top 20% of revenue-impacting assets should receive 60-70% of the preventive and predictive maintenance budget.
Excluding Technology ROI from Budget Proposals
Maintenance technology — CMMS, sensors, AI analytics — is often treated as a discretionary IT expense rather than a maintenance investment with quantifiable returns. Frame every technology request in terms of downtime prevented, labor saved, and inventory reduced. A CMMS that saves 20-50% on maintenance planning time and reduces unplanned downtime by 30-50% pays for itself within the first budget cycle.
Annual-Only Budget Reviews
Cement plant conditions change quarterly — equipment degrades, production targets shift, regulatory requirements update. A budget reviewed only annually cannot adapt to mid-year asset failures, unexpected capital needs, or newly identified savings opportunities. Implement quarterly budget-to-actual reviews with automated CMMS reporting to catch variances early and reallocate resources proactively.
Leveraging CMMS Data for Financial Forecasting
The difference between a guess and a forecast is data. A CMMS transforms maintenance budgeting from an annual estimation exercise into a continuous financial intelligence system. Here is how each data layer contributes to budget accuracy in cement plant operations:
Work Order Cost History
Every completed work order captures labor hours, parts consumed, contractor costs, and associated downtime. Aggregated over 12-36 months, this data reveals actual cost-per-asset, cost-per-failure-type, and seasonal spending patterns. CMMS analytics transform this raw history into forecasting models that predict next year's spend by asset class with 85-90% accuracy — dramatically outperforming spreadsheet-based estimates.
PM Schedule Compliance and Cost
Track what percentage of scheduled PMs are completed on time, how much each PM actually costs versus its estimate, and which PM tasks consistently run over budget. This data directly informs PM frequency optimization — the path to eliminating the 30% of preventive maintenance that is performed too often.
Downtime and Failure Analytics
Correlate maintenance spend with downtime outcomes. Which assets consume the most budget but still generate the most unplanned stops? These are candidates for strategy upgrades — shifting from calendar-based PM to predictive monitoring. The financial argument writes itself when you can show that a $50,000 asset has consumed $200,000 in reactive repairs over three years while causing $1.5 million in production losses.
Inventory Consumption Trends
CMMS inventory modules track parts usage by asset, frequency of reorder, and lead times. This data feeds procurement budgets with precision — replacing the common practice of bulk ordering based on vendor minimums. Plants using data-driven inventory management reduce spare parts carrying costs by 15-25% while improving first-time fix rates by having the right parts available when needed.