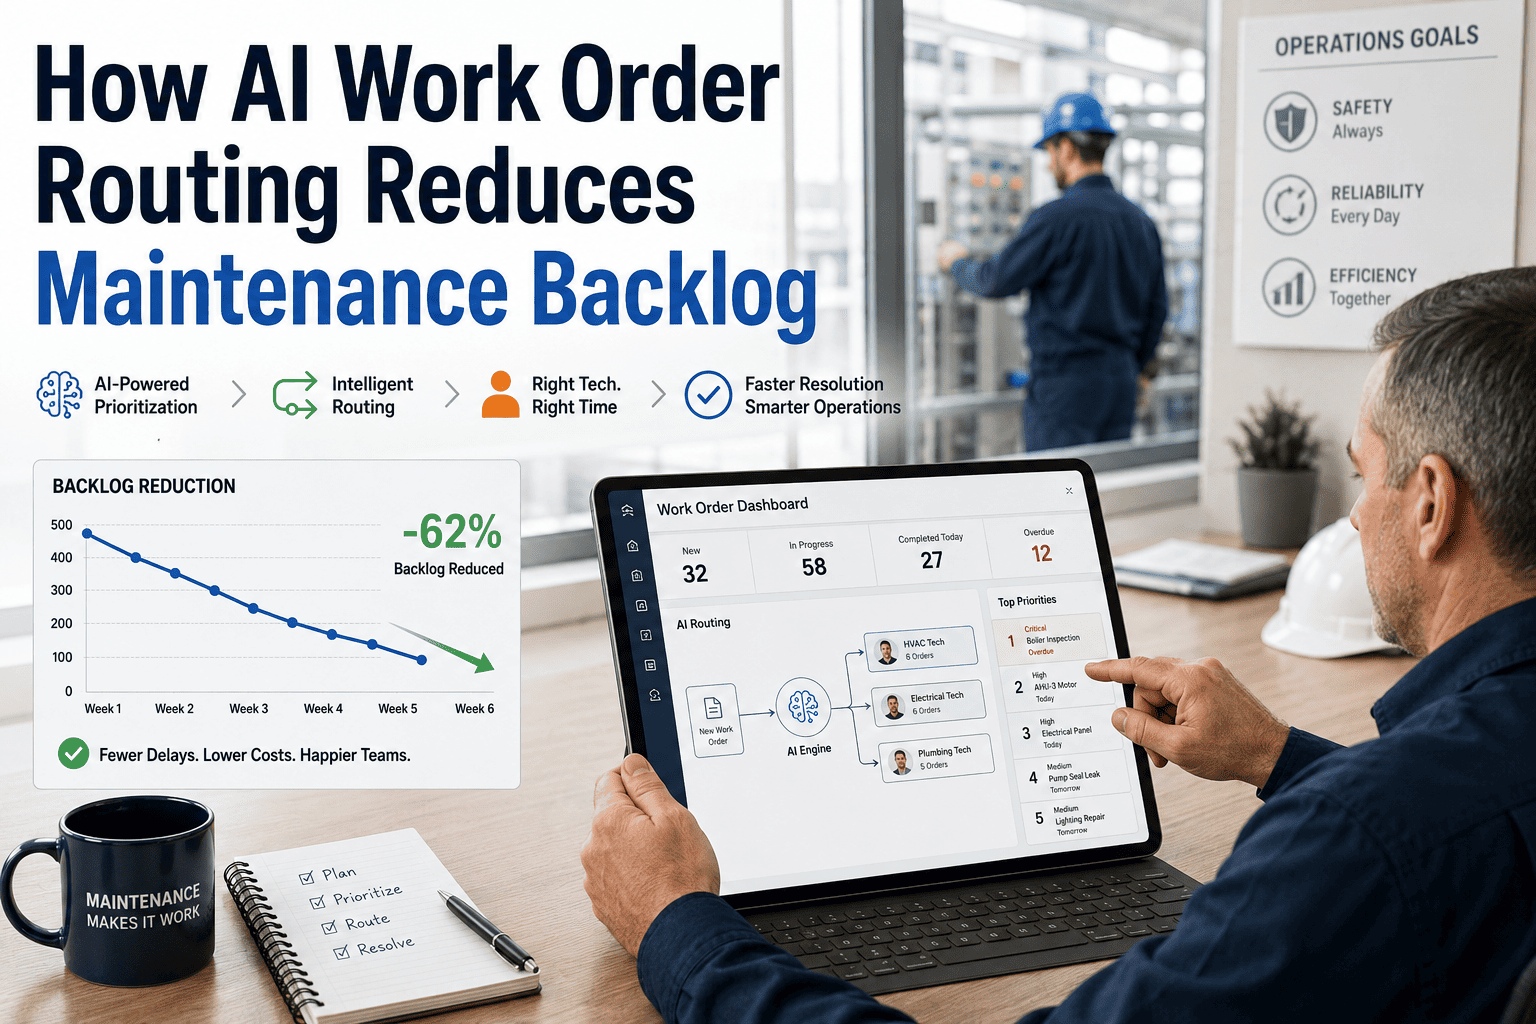
A maintenance planner at a mid-sized cement plant once described their backlog like this: "We have 1,400 open work orders. About 200 of them matter. The rest are duplicates, things that fixed themselves, jobs that were done but never closed, or requests from three managers ago that nobody cancelled." That plant was spending 40% of its weekly planning capacity triaging a queue that was 86% noise. The real cost was invisible — not in the backlog itself, but in the critical work aging unexecuted while the team waded through irrelevant requests. Research from SMRP and the ARC Advisory Group consistently shows that unmanaged maintenance backlogs increase emergency repair spend by 23%, reduce asset availability by 18%, and inflate total maintenance cost by 15–30% versus facilities with structured backlog programs. The backlog problem is not a labor shortage — it is a prioritization and visibility failure that a structured system resolves in 90 days.
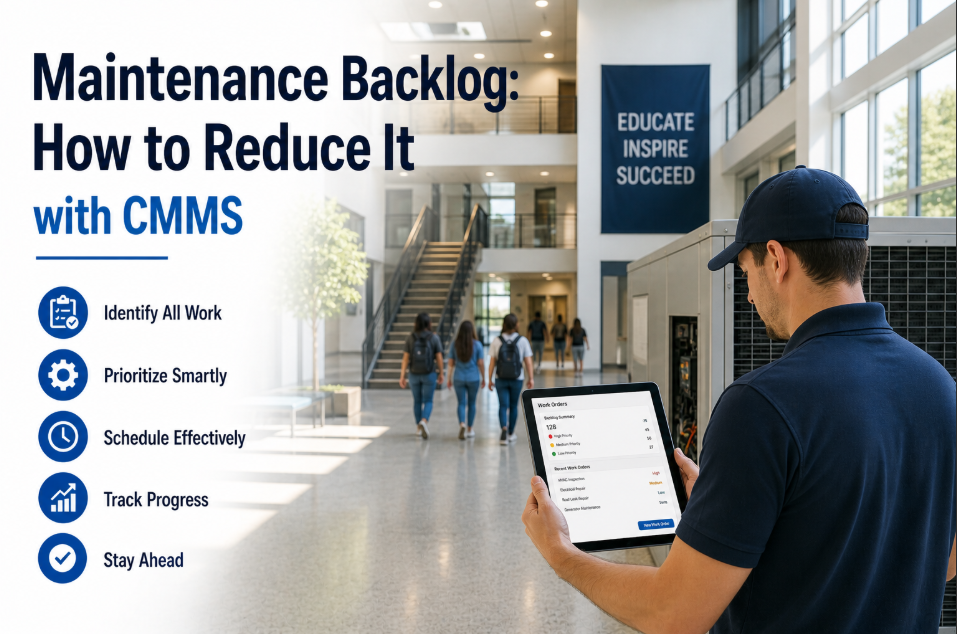
Every maintenance backlog has two layers: the active layer of work that genuinely needs execution, and the passive layer of aged, vague, duplicated, or irrelevant work orders consuming planning bandwidth without producing output. The first step in backlog management is not executing work faster — it is separating these two layers through systematic rationalization, then applying objective priority scoring to the active layer so the highest-consequence tasks execute first, every week, without exception. Sign up for Oxmaint to deploy a live backlog dashboard, automatic priority scoring, and aging escalation alerts across your entire maintenance operation in under one working day.
What if every open work order in your plant was automatically scored, ranked, and visible to every planner and technician — with the highest-consequence tasks surfacing to the top of the queue without any manual sorting?
The Real Cost of an Unmanaged Backlog
Most maintenance leaders know their backlog is large. Few have calculated what it is actually costing them. The four numbers below come from aggregated benchmarking data across 340+ industrial facilities — cement, chemical, steel, and food manufacturing — where structured backlog management programs were implemented. They represent the documented delta between facilities with structured programs and those without.
The 5 Backlog Management Capabilities Every Plant Needs
Managing a maintenance backlog effectively requires five distinct capabilities working together. Missing any one produces a program that runs for 60–90 days and then reverts to accumulation. The matrix below shows what each capability does, why it cannot be skipped, and its impact on backlog health — so you can audit your current program before deciding where to invest. Teams wanting to see these capabilities in action can create a free Oxmaint account and load existing WO data for an immediate backlog health assessment.
Priority Scoring Methods: How They Perform in Practice
Not all priority scoring approaches deliver equal results. The method you choose determines how accurately your queue reflects operational risk — and how much planner time is consumed maintaining the system. The four methods below are the most widely used in industrial maintenance. Each is rated against five performance dimensions based on documented implementation outcomes. Reducing unplanned downtime with CMMS begins with selecting the right scoring method for your asset criticality profile — the wrong choice produces a queue that looks prioritized but still generates reactive floods.
Each WO scored 1–5 on four factors: safety consequence (score of 5 overrides queue — triggers immediate execution regardless of position); production impact (linked to criticality matrix, not requester judgment); failure probability (updated by condition monitoring data or technician observation); and cost of delay (captures accelerating cost of deferral on degrading assets). Multiply all four for a score of 1–625. Oxmaint applies this scoring automatically at WO creation using asset criticality and WO type data. Planners review a pre-scored, pre-ranked queue rather than manually triaging hundreds of items — reducing priority triage time by 65–70% per planner per week.
Plots each WO on a 5×5 grid with likelihood on one axis and consequence on the other. Produces a risk score of 1–25 and a colour zone (green/yellow/red). Widely used for safety and compliance programs. The critical weakness for daily queue management: it produces large bands of equally-scored work — many WOs land in the same cell and still require subjective triage within each band. Better as a secondary review tool for safety-classified WOs than as the primary queue ranking mechanism for a mixed-type backlog of hundreds of items.
Simple three-tier system where every WO is manually classified A, B, or C. Quick to implement and easy for technicians to understand. The critical weakness: within each tier, there is no ranking — a large A-tier still contains dozens of equally "urgent" tasks requiring subjective sorting. Classification drift is common over time, with planners over-classifying work as "A" to ensure execution, defeating the purpose entirely. Effective for plants with fewer than 50 open WOs; inadequate as the sole priority system at any larger scale.
WO priority scores derived from the Risk Priority Number (RPN = Severity × Occurrence × Detectability) calculated for each failure mode in a formal FMEA. The most technically accurate method — scores are grounded in engineering analysis, not human judgment. The implementation barrier is significant: requires a completed FMEA for all assets in scope, typically 6–18 months for a mid-scale industrial plant. The ideal long-term target state after RCM implementation; not suitable as an initial backlog management system without existing FMEA documentation already in place.
Before vs. After: What a Structured Backlog Program Changes
The operational difference between an unmanaged and a managed maintenance backlog is visible in every planning meeting, every shift handover, and every maintenance cost report. The contrast below reflects documented outcomes from facilities that implemented structured programs — not projected targets, but measured results from the 12 months following program launch. Understanding how asset lifecycle management with CMMS connects backlog aging data to long-term capital decisions transforms backlog from a short-term operational metric into a strategic asset management tool.
Oxmaint deploys all five backlog management capabilities out of the box — priority scoring, aging escalation, WO quality gates, reserved capacity tracking, and live backlog dashboards. Most plants are live within one working day.
Backlog Health Benchmarks: Where Do You Stand?
Frequently Asked Questions: Maintenance Backlog Management
The SMRP world-class target is 2–4 labor weeks — meaning total open WO estimated hours equal 2–4 times your weekly craft labor capacity. Below 2 weeks suggests work is being under-identified or that technicians are self-planning without formal WO creation. Above 6 weeks indicates either insufficient capacity, poor prioritization, or excessive reactive work. The composition matters as much as size: a 3-week backlog of priority-scored, parts-confirmed, planned WOs is healthy. A 3-week backlog of aged, vague, unscored WOs is a liability that generates emergency failures within 90 days.
Cancellation criteria must be formal and documented: cancel WOs where the fault no longer exists (confirmed by asset owner); the asset has been decommissioned; the WO duplicates another open WO for the same fault; the improvement request has been superseded by a capital project; or the WO has been in queue for more than 12 months with a priority score below 15 and the asset owner confirms work is no longer required. Never cancel unilaterally — all cancellations require documented rationale and asset owner sign-off. Undocumented cancellations create audit exposure for safety-classified items closed without engineering sign-off.
Report five metrics weekly against benchmark targets: total backlog in labor weeks (not raw WO count — count is meaningless without capacity context); reactive work ratio (target below 20%); PM compliance rate (target above 90%); schedule compliance (target above 85%); and percentage of backlog older than 90 days (target below 10%). Trend direction matters more than point-in-time values — a backlog rising from 3.0 to 3.8 labor weeks over 6 weeks is a leading indicator requiring management intervention before it reaches 6+ weeks and triggers a reactive crisis. Present a trend chart, not a single number.
It is direct and measurable: each percentage point improvement in PM compliance reduces future corrective WO creation by 2–4% because prevented failures do not generate emergency corrective WOs. Facilities improving PM compliance from 70% to 90% consistently observe 30–45% corrective backlog reduction within 12 months — not from clearing existing WOs faster, but from generating 35–40% fewer new corrective WOs. This is why the most sustainable long-term backlog strategy prioritizes PM execution over backlog clearance in the short term: PM investment pays dividends by reducing the rate of backlog accumulation for years after initial execution.
Yes — a properly configured CMMS assigns priority scores automatically at WO creation using three data sources: the asset criticality classification from the plant's criticality matrix (assigning production impact and safety consequence scores by asset ID); the work order type (safety WOs automatically score maximum on consequence; PM WOs score higher than corrective for the same asset); and the failure mode description if linked to an FMEA database. The planner's role shifts to reviewing and confirming the system-assigned score rather than calculating from scratch — reducing priority triage time by 65–70% and eliminating the personal judgment that allows high-consequence work to age behind prominent low-consequence requests.
They can be sustained if the program addresses both sides simultaneously: clearance rate (executing work faster through planning discipline and reserved capacity) and accumulation rate (reducing new corrective WO generation through PM compliance and condition monitoring). Programs only focusing on clearance achieve short-term reduction and then plateau as reactive work floods in from unmaintained assets. Facilities sustaining world-class backlogs (2–4 weeks) for 3+ years consistently hit 90%+ PM compliance and less than 20% reactive ratio simultaneously — making the backlog a managed flow rather than a growing accumulation.
The SMRP benchmark is 1 dedicated planner per 15–20 craft technicians. Above 25:1, planners cannot keep pace with WO intake, job package preparation, parts confirmation, and backlog review simultaneously — and the queue begins aging uncontrolled. Many facilities operate at 30:1 or higher and compensate by having technicians self-plan, which reliably produces lower schedule compliance, higher reactive ratios, and growing backlogs. Each additional planner at a 25:1 ratio typically generates $400,000–$700,000 in annual productivity improvement through better schedule compliance and reduced reactive work — making planning capacity one of the highest-ROI investments available in a mature maintenance department.
Related Resources for Cement Plant Optimization
Reduce Unplanned Downtime in Cement Plants with CMMS
Eliminating the reactive flood that inflates backlogs — the foundational step before any backlog management program can sustain results beyond the first 90 days.
Cement Plant Asset Lifecycle Management with CMMS
Connecting backlog aging data to capital planning — when corrective WO costs exceed replacement thresholds, lifecycle management converts queue items into capital investment decisions.
Cement Production Efficiency KPI Tracking
Real-time dashboards for backlog size, reactive ratio, PM compliance, and schedule compliance — the five metrics that reveal whether your maintenance program is improving week over week.
Total Productive Maintenance for Cement Plants
How TPM's autonomous maintenance pillar reduces corrective WO generation rate — directly attacking backlog growth at the source rather than at the clearance end of the equation.